
Abstract
This retrospective study investigates the potential benefits from the introduction of point-of-care tests for rapid diagnosis of infectious diseases. We analysed a sample of 441 hospitalized patients who had received a final diagnosis related to 18 pathogenic agents. These pathogens were mostly detected by standard tests but were also detectable by point-of-care testing. The length of hospital stay was partitioned into pre- and post-laboratory diagnosis stages. Regression analysis and elementary queueing theory were applied to estimate the impact of quick diagnosis on the mean length of stay and the utilization of healthcare resources. The analysis suggests that eliminating the pre-diagnosis times through point-of-care testing could shorten the mean length of hospital stay for infectious diseases by up to 34 per cent and result in an equal reduction in bed occupancy and other resources. Regression and other more sophisticated models can aid the financing decision-making of pilot point-of-care laboratories in healthcare systems.
Keywords
Introduction
The purpose of clinical microbiology laboratories is to provide laboratory results that are affordable, accurate and timely. 1 The delays between patient admission, sampling and provision of test results are associated with late diagnosis and, hence, problems in patient care, unnecessary hospitalization, empirical use of antibiotics, nosocomial infections and waste of resources. To avoid such delays, a growing number of rapid point-of-care (POC) diagnostic tests have been developed.2–6 Most of these tests are based on immunochromatographic or agglutination assays.2,7 POC tests are performed near the patient, aiming at an immediate diagnosis, a more effective treatment and a shorter length of stay (LOS) in the hospital.2,8–11 POC tests are already used to detect influenza virus, Legionella pneumophila, Group B Streptococcus, Streptococcus pneumoniae, rotavirus, respiratory syncytial virus, human immunodeficiency virus (HIV) and so on.12–17 In the past decade, new molecular techniques and laboratory automation have significantly advanced clinical microbiology 18 enabling rapid detection of pathogens.4,5,7,19 In the future, new threats from infectious microorganisms will necessitate even more rapid diagnosis. 18
Economic constraints exert pressures on many national healthcare systems, influencing hospital budgets, resource availability and quality of services. In Crete, Greece, the times to laboratory diagnosis of infectious diseases in public hospitals are quite long. Here we present a retrospective study involving hospitalized patients, to investigate the potential benefits of quick diagnosis and support the decision-making in financing the pilot implementation of POC technologies. The study mainly focused on the impact assessment of time to laboratory diagnosis reduction on total LOS, bed occupancy and utilization of other hospital resources.
Methods
Study setting
Laboratory data over a period from October 2011 to September 2014 were anonymously recorded at five public hospitals in Crete, Greece, denoted hA, hB, hC, hD and hE. The data relate to specific tests performed at the clinical microbiology laboratories for the detection of 18 agents (Table 1), which are also detectable by rapid tests.2,13,14 Then, we identified the inpatients with positive laboratory tests and appended their clinical course data to generate sojourn time records of all officially hospitalized patients whose sole reason for hospitalization was an infection by the examined pathogens. The analysis which follows is based on this patient group.
Number of patients, attributes and hospitalization time statistics for each pathogen and patient group.
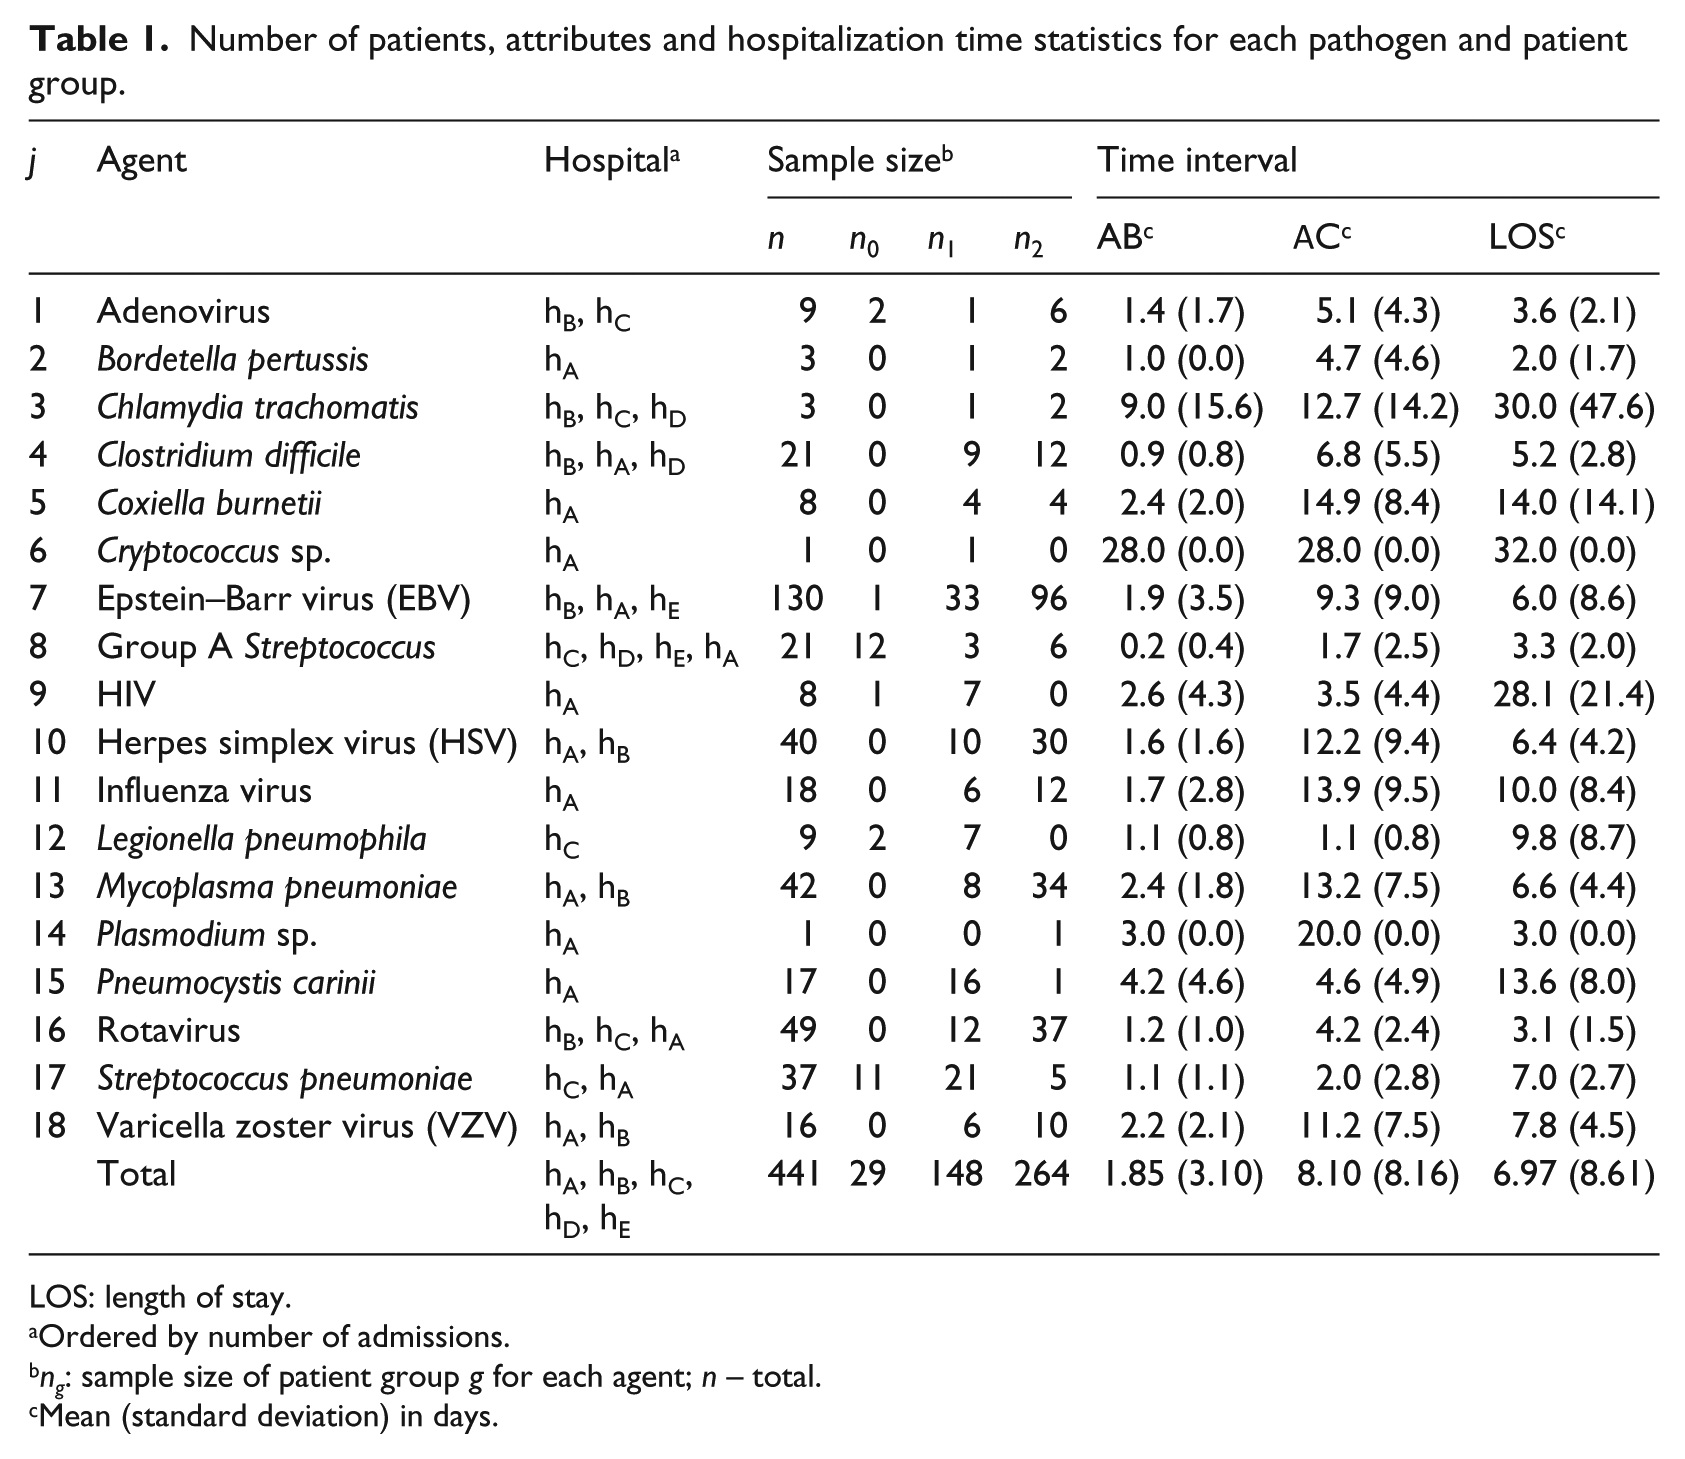
LOS: length of stay.
Ordered by number of admissions.
ng: sample size of patient group g for each agent; n – total.
Mean (standard deviation) in days.
Analysis
The following four time points were recorded for each hospitalized patient:
A – admission date;
B – sampling date (B ⩾ A);
C – date of reporting of laboratory analysis results (C ⩾ B);
D – discharge date.
Here the dates B and C correspond to the diagnostic sampling which identified the pathogenic agent and the time when a positive laboratory diagnosis was made. Laboratory diagnosis essentially confirms or invalidates the initial suspicion and finalizes diagnosis and treatment decision-making. Segment AB refers to the time interval between admission and targeted sampling, BC refers to the laboratory analysis turnaround time (TAT) and the time interval AC is the pre-diagnosis period or the time to laboratory diagnosis. CD refers to post-diagnosis hospitalization during which patients received appropriate treatment and recovered. All time intervals are discretized in days and the difference between two times of the same day is truncated to zero.
Our first objective was to assess how the patients’ sojourn times could have changed had they received quick diagnostic tests right upon admission. The application of POC testing upon admission is already suggested in other studies.2,20 Although there were cases in which appropriate treatment was delivered during AC or a fraction thereof, as a result of correct clinical diagnoses, such information was mostly lacking. This was one of the main problems we had in investigating the impact of long times AC on patient LOS. From the total population, we set aside a reference group, indexed 0, comprising individuals who were immediately diagnosed, that is, AC = 0. Then, we divided the remaining cases, AC > 0, into two disjoint groups indexed 1 and 2. Group 1 consists of patients with C < D, for whom the laboratory diagnosis at time C led to a definitive diagnosis prior to discharge and the post-diagnosis time interval CD corresponds to a targeted therapy period. Group 2 comprises patients with D ⩽ C, who were discharged upon or before the reporting of laboratory results and had no post-diagnosis hospitalization, which is rather common in practice.21,22 For example, during the 2000 enterovirus epidemic in Marseille, the etiological diagnosis was mostly obtained after the patient’s discharge and recovery (mean laboratory TAT 12.4 ± 4.3 days > mean LOS 5.4 ± 4.8 days (95% confidence intervals)). 21
In the sequel, g = 0, 1, 2 denotes the hospitalization times related to group g and the subscript q marks the corresponding values after the implementation of POC quick tests. For example, LOS1 denotes the observed LOS of a group 1 patient and LOS1,q an estimate of LOS1 after the introduction of quick test. Also, for simplicity, we use the same notation for a random variable, its mean value or an estimate thereof whenever no ambiguity can arise or when a formula is valid for all these quantities.
LOS equals the length of the time interval AD. For groups 0 and 1, we have that

Since all reference group patients were diagnosed upon admission, we have AC0 = AC0,q = 0 and LOS0 = LOS0,q = CD0. For group 1 patients, a naïve estimate of the resulting mean LOS after the introduction of POC quick tests would be LOS1,q = CD1. In the next section, however, we show that the length AC1 of hospital stay preceding the laboratory diagnosis affects CD1 as well. After testing different statistical models and various combinations of predictor variables (see the next section), we adopted the linear regression model

where Ij is a binary function indicating the presence (Ij = 1) or absence (Ij = 0) of infectious agent j, j = 1, …, 18, and the coefficients a0, a1 and bj are estimated by minimizing the sum of squared errors. The data set used for parameter estimation comprises patients from both groups 0 and 1. Assuming a scenario of immediate diagnosis, substituting AC1,q = 0 in equation (1) for group g = 1 results in LOS1,q = CD1,q and, in view of equation (2), ignoring the error term

where AC1 is the current group 1 average time from admission to laboratory diagnosis. An important consequence of equation (3) is that LOS1,q is expected to be significantly shorter than LOS1 when a1 is positive. A positive a1 indicates that pre-diagnosis hospitalization has a positive feedback on the length of post-diagnosis stay and, therefore, on average it is not beneficial for the treatment of patients. On the other hand, a negative a1 would indicate that eliminating AC may result in just a small reduction or even an increase in LOS if a1 < 1. In practice, the initial clinical assessment which may span a portion or even the whole interval AC is always necessary (regardless of the sign of a1) for the formulation of a diagnostic plan. In an exact model, the length of initial clinical assessment is typically represented by a0. To rule out a potential underestimation of a0, we can modify equation (3) assuming that the quick tests will save a fraction (1 – ϕ)AC1 rather than the whole AC1. Equation (3) is generalized to

where the parameter ϕ ∈ [0, 1] is unknown and represents the unmodelled average fraction of AC1 which is necessary for clinical diagnosis and/or during which appropriate treatment was delivered. The time (1 – ϕ + a1)AC1 corresponds to the unnecessary or detrimental contribution of AC1. We see that LOS1,q is increasing in ϕ. Therefore, an upper bound or conservative estimate of LOS1,q is obtained by setting ϕ = 1 in equation (4). As discussed previously, a positive a1 is an indication that AC is not beneficial and, therefore, equation (4) with ϕ = 0 or, equivalently, equation (3) gives a plausible estimate for LOS1,q.
We now turn to group 2 patients who were discharged upon or before the reporting of analysis results. The data of this group contain no information that would be helpful in estimating the effect of rapid diagnosis on CD and LOS, because hospitalization does not include any post-laboratory diagnosis treatment. Although the adoption of POC testing is expected to be beneficial for this group as well, the only conclusion that can safely be drawn is that the LOS of group 2 patients will not increase. A conservative estimate of LOS2,q is therefore given by

Group 2 could perhaps be useful for extracting information about the beneficial portion ϕ of AC for groups 0 and 1. However, such a task is beyond the scope of this work because it would require elaborate statistical analysis to eliminate, to the extent possible, the biases of group 2 (1) having patients with nearly half the average age of the other groups (21 vs 41 years, respectively) and (2) lacking incidents with pathogens associated with long hospitalization times such as HIV and P. carinii, which are frequent in groups 0 and 1.
In the next section, we compute the parameters of equation (2) and use equations (3) to (5) to estimate the expected reduction of the overall mean LOS due to POC testing. The corresponding savings in average occupancy and resource use are computed using Little’s 23 law from queuing theory

Results
The data set comprises 441 patients hospitalized due to the examined infectious pathogens, excluding false-positive incidents, past infections and outpatients.
The hospitalization subintervals (AB, AC, etc.) differ significantly among incidents, even within each agent group (large standard deviation (SD) values in Table 1). For example, the average AB of all incidents was 1.85 days (SD = 3.10) and the average AC was 8.10 days (SD = 8.16). The main reasons for these variations are the differences in patients’ clinical responses to infections and treatments and the variations of diagnostic sampling times and laboratory TATs.
Reference group 0 (n0 = 29) comprised 10 patients whose samples were collected in the emergency departments (EDs) and 19 clinic patients, all laboratory-diagnosed during the day of admission. Group 0 patients had an average hospitalization LOS0 = 4.83 (SD = 2.88) days, the patients (n1 = 148) of group 1 had LOS1 = 12.25 (SD = 12.64) and AC1 = 4.96 (SD = 5.69), and the patients (n2 = 264) of group 2 had LOS2 = 4.24 (SD = 3.19) days. We shall use these numbers in the sequel to estimate LOSq.
Variable and model selection
We used data from groups 0 and 1 and tested various predictor variables and three generalized linear models 24 based on the Gaussian (linear regression), Poisson (log linear) and the negative binomial approximations for CD. The latter is suited to deal with highly variable (overdispersed) data. 25
Variable selection
For each model, we used AC as a predictor variable either alone or combined with one or more of the following infectious agents, age, gender and hospital:We used the Akaike Information Criterion (AIC)
24
to eliminate the less informative variables for each model and the residual standard error

p is the number of model parameters and n = n0 + n1 – 2 = 175 is the number of group 0 and 1 cases excluding two records lacking age entries. For all models, the combination (AC, infectious agent) minimized both criteria and rendered similar

2. Model selection
The residual
Regression results
The analysis was carried out using mainly the R statistical package. The model is the same as equation (2) with Adenovirus (j = 1 in Table 1) taken as the reference category for pathogens with coefficient b1 = 0 by default. Also b14 = 0 because there was no incident with Plasmodium sp. (j = 14) in groups 0 and 1.
We see that the 95 per cent confidence interval for a1, [0.17, 0.67], lies on the positive real axis. As explained in the previous section, a positive a1 implies that, on average, the pre-diagnosis hospitalization is not beneficial for group 1 patients (i.e. the longer the AC1, the longer the CD1 and, consequently, the longer the LOS1). However, the correlation between AC and CD in groups 0 and 1 is weakly positive (RAC,CD = 0.32). This raises the question of whether CD does have a linear dependence on AC. Using the F statistic, the null hypothesis a1 = 0 is rejected (analysis of variance (ANOVA); p < 0.0001 in Table 2). It therefore follows that a1 > 0, which implies that the delays in sampling and laboratory analyses lead to a prolonged post-diagnosis LOS.
Regression results a of CD for groups 0 and 1.
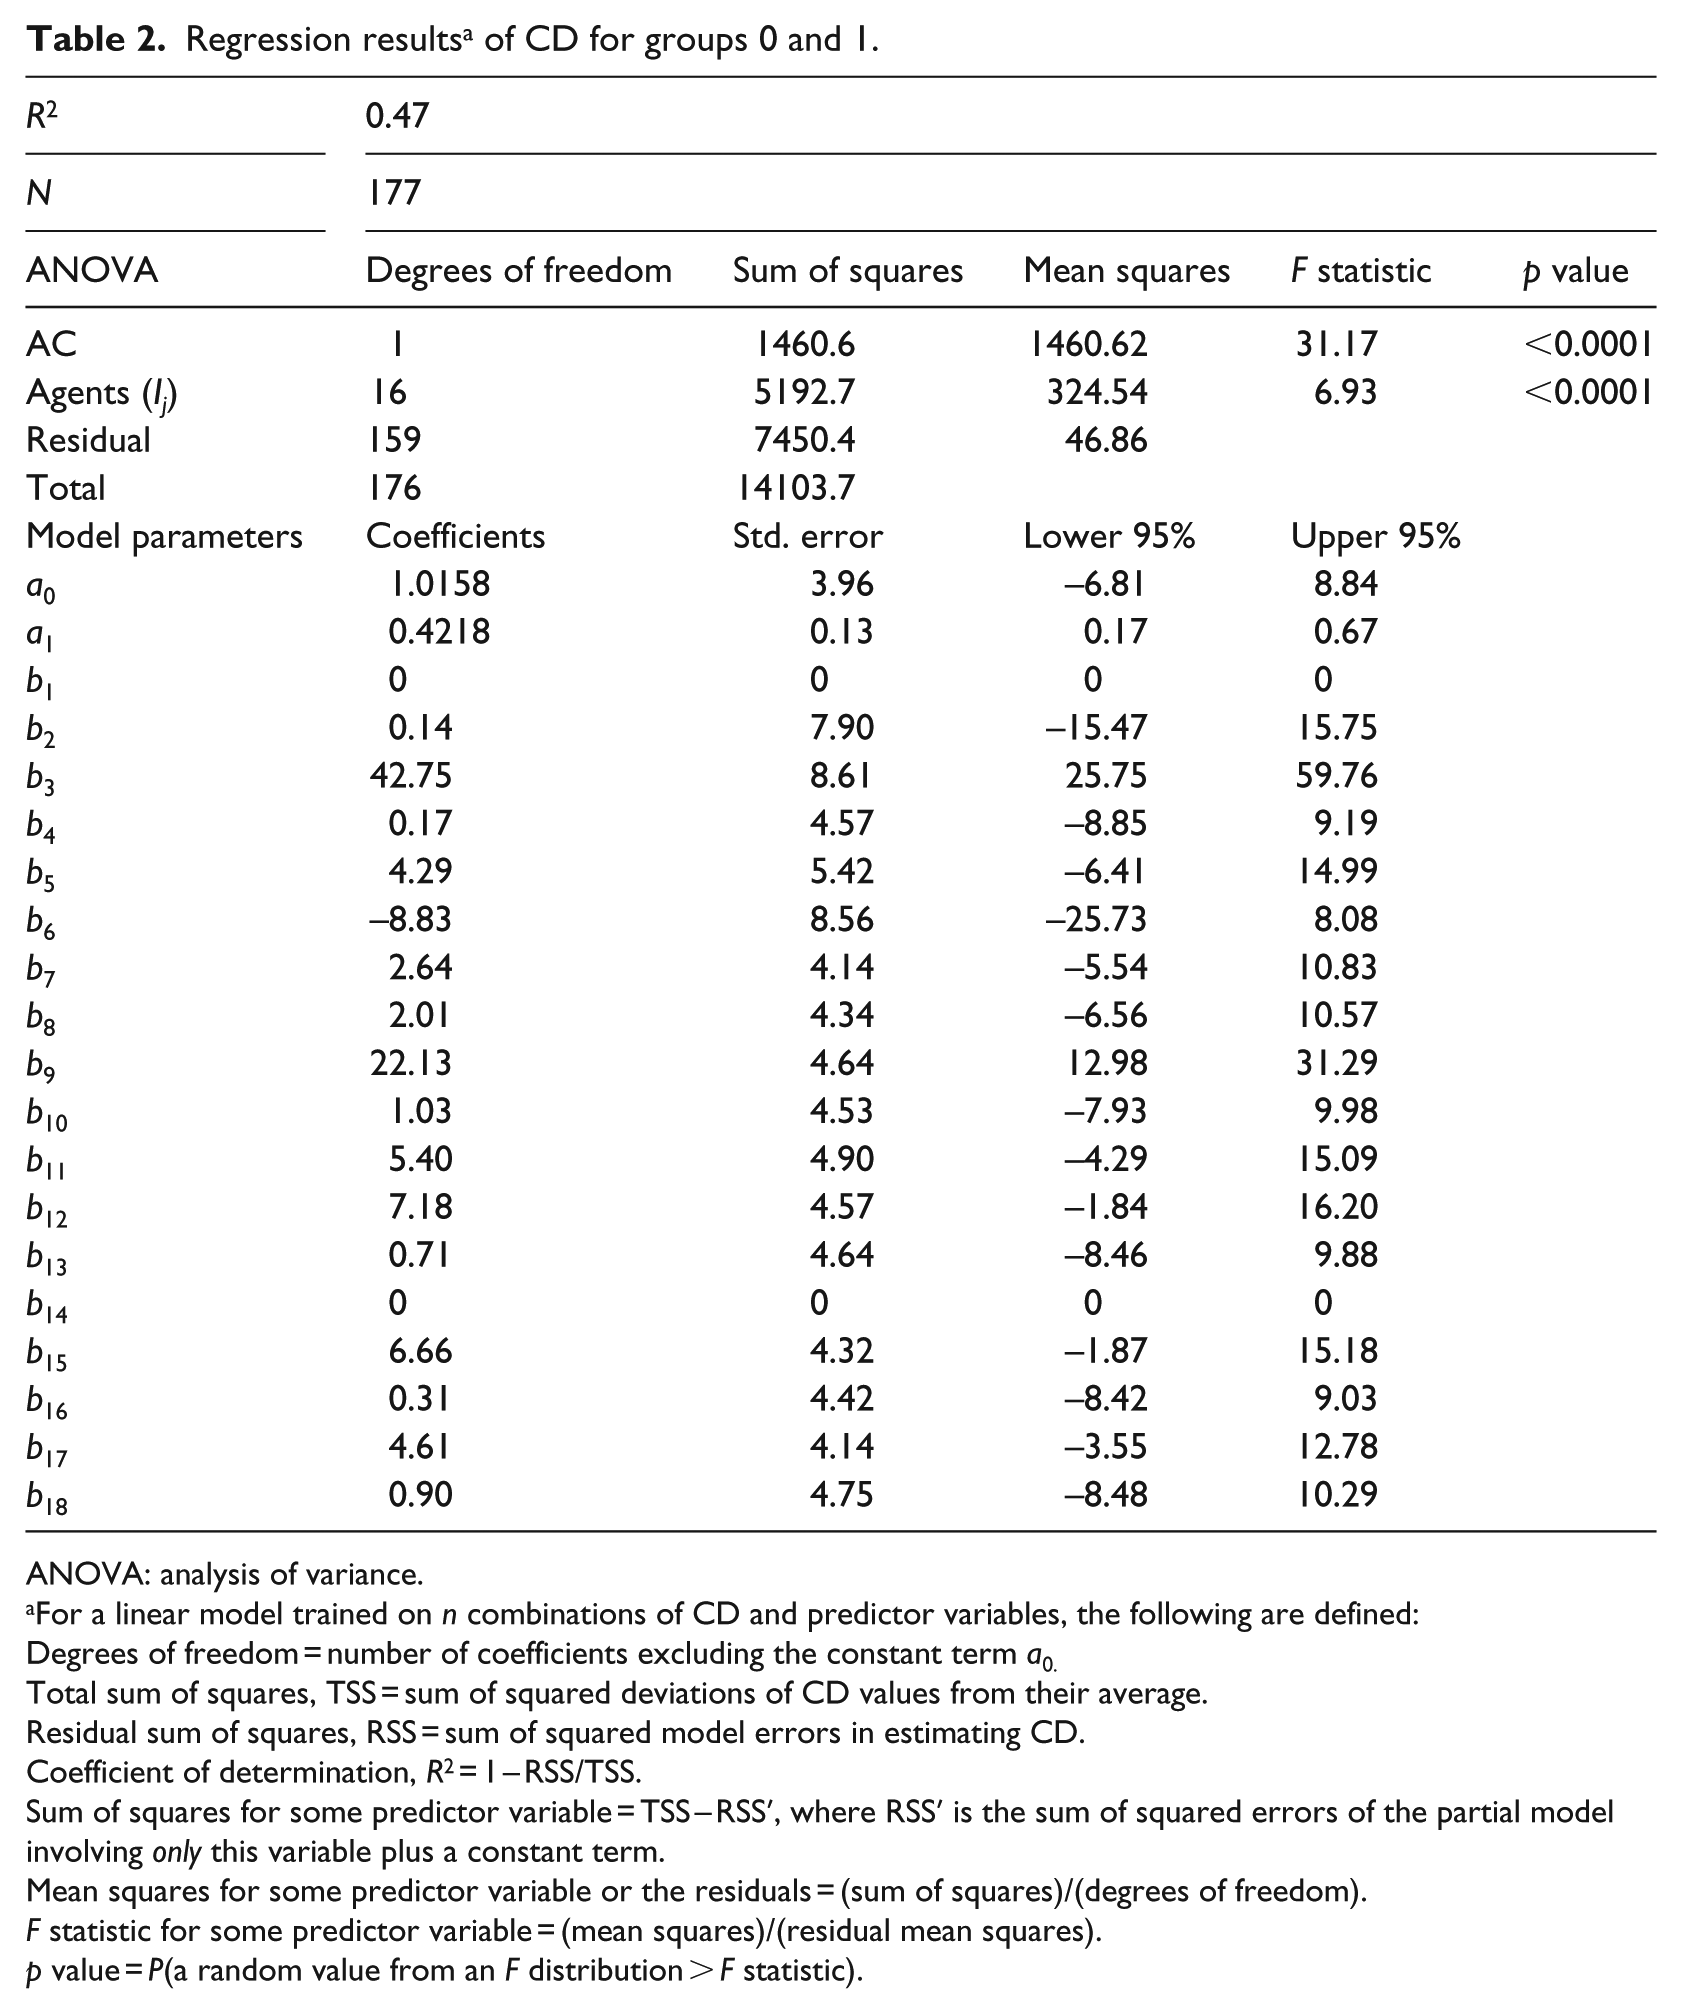
ANOVA: analysis of variance.
For a linear model trained on n combinations of CD and predictor variables, the following are defined:
Degrees of freedom = number of coefficients excluding the constant term a0.
Total sum of squares, TSS = sum of squared deviations of CD values from their average.
Residual sum of squares, RSS = sum of squared model errors in estimating CD.
Coefficient of determination, R2 = 1 – RSS/TSS.
Sum of squares for some predictor variable = TSS – RSS′, where RSS′ is the sum of squared errors of the partial model involving only this variable plus a constant term.
Mean squares for some predictor variable or the residuals = (sum of squares)/(degrees of freedom).
F statistic for some predictor variable = (mean squares)/(residual mean squares).
p value = P(a random value from an F distribution > F statistic).
A plausible estimate of the mean LOS of group 1 patients had they received a quick diagnostic test is given by equation (3) or (4) with ϕ = 0

Setting ϕ = 1 in equation (4), we obtain a conservative estimate

The regression model (2) had 10 unusual residuals registered in Table 3. Excluding the bigger residuals one at a time did not lead to any improvement because new outliers came up that were absent in the original model. Nevertheless, to take into account this fact, we first summed all group 1 residuals and then divided this sum (130.07) by n1 and incremented estimate (equation (7)) to obtain another conservative estimate LOS1,q = 5.20 + (130.07/148) = 6.08. Because this value is smaller than 10.17, we keep the latter as a conservative estimate of LOS1,q.
Unusual residuals for groups 0 and 1.
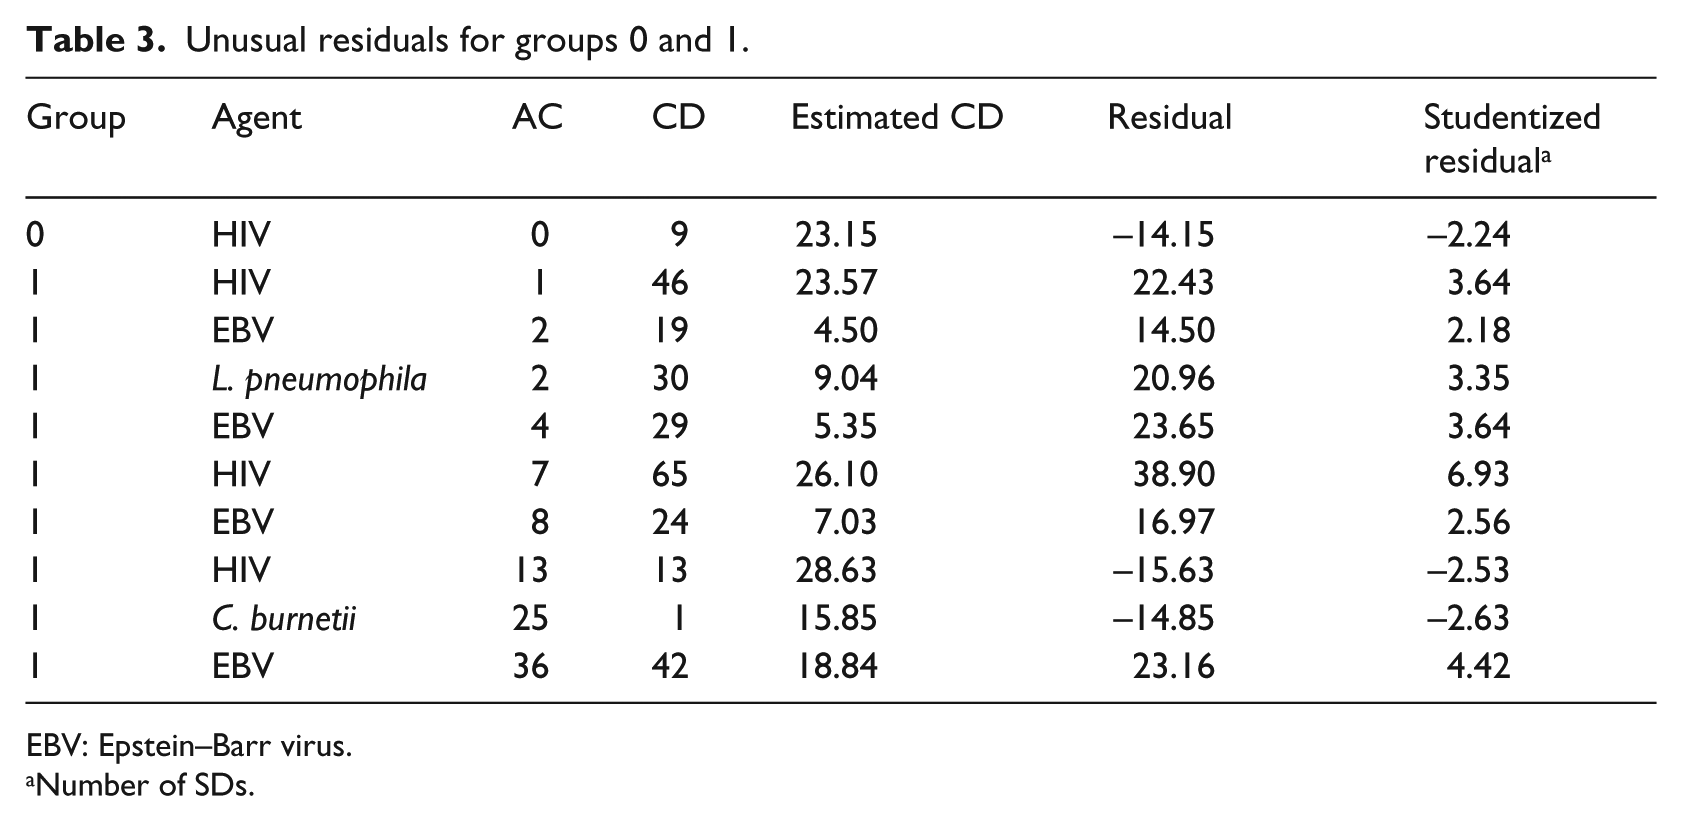
EBV: Epstein–Barr virus.
Number of SDs.
Overall performance indices
An estimate for the mean LOSq of a randomly selected or ‘average’ patient is computed by a linear combination of conditional group expectations

This formula is employed for obtaining a plausible and a conservative estimate of LOSq using the corresponding estimates 5.20 and 10.17 for LOS1,q from equations (7) and (8) and the sample averages LOS0 = LOS0,q = 4.83 and LOS2 = LOS2,q = 4.24. Substitution of these values into the formula given above gives the overall expected LOS under the two scenarios: LOSq(plausible) = 4.60 days and LOSq(conservative) = 6.66 days. The current average LOS equals 6.97. Therefore, an LOS reduction of 10.1–34 per cent could be achieved through a systematic use of POC testing.
A reduction in the mean LOS causes an equal relative reduction in the use of various healthcare resources. To see this, take, for example, the mean number of occupied beds (in bed days) before and after the introduction of POC testing, denoted N and Nq, respectively. Let λ be the inpatient admissions rate. Application of Little’s formula yields N = λ × LOS and Nq = λ × LOSq, which imply that the ratios Nq/N and LOSq/LOS are equal. Furthermore, upon subtraction we obtain

For the specific data set studied herein, we have that λ = 441 patients in 3 years and an estimate for LOS – LOSq ranging from 0.70 to 2.37 days. Therefore, quick diagnosis could free up a minimum of 309 and an average of 1045 hospital bed days for these patients, and result in a reduction of clinicians and paramedical personnel working hours and other important resources associated with hospitalization.
Discussion and conclusion
A longitudinal study using laboratory and clinical data of hospitalized patients has been presented, showing that patients treated for pathogenic infections often incur laboratory testing and reporting delays. This is a consequence of a batch processing policy whereby a test is performed only when a sufficient number of specimens are gathered. A statistical analysis indicated that the adoption of POC tests could reduce hospital LOS and, accordingly, the use of medical resources.
For infectious diseases, the early delivery of laboratory results gives clinicians the opportunity to change the administered antibiotic therapy from empirical, broad spectrum treatment to a directed treatment against the pathogen of interest.11,26 In addition, the early detection of some pathogens such as Legionella species, B. pertussis and influenza viruses may improve public health indicators. 27 The POC strategy was also critical during the H1N1 influenza epidemic helping to avoid unnecessary isolation measures and treatment with oseltamivir. 2 Additional benefits from the adoption of POC testing include reductions in hospital stay, antibiotics use, ordering of irrelevant tests and laboratory utilization.2,3,28–30 Other studies have touched upon the issues of accuracy, speed and cost, which are the commonly used criteria for assessing alternative testing technologies. 17
In this study, the time to laboratory diagnosis was zero only for a small subset of patients (the reference group, n0 = 29), for which the mean LOS is 4.83 days (SD = 2.88). This value is very close to 4.60, our estimate of the mean LOS after the adoption of rapid POC testing. The average laboratory TAT, BC, was 6.25 (SD = 7.44) days. The introduction of POC testing can eliminate TAT. A low-cost, highly sensitive, specific and stable POC platform for virus diagnostics has a response time shorter than 15 min. 13 Community-acquired pneumonia can be identified within a few hours by new platforms: the multiplex polymerase chain reaction (PCR) platform FILMARRAY (1 h), the GeneXpert platform (2 h) and the Curetis Unyvero P50 pneumonia cartridge (4 h) can detect 17 bacterial and fungal pathogens from respiratory samples. 31 Finally, C. trachomatis is detected by a multiplex PCR assay in less than 2 h. 32
Cohen-Bacrie et al. 2 report that the immediate discharge rate of patients who were admitted at the ED and tested by rapid POC methods was 2.6 times higher than that for patients tested by a conventional diagnostic procedure. Our analysis indicates that the longer the time to diagnosis, AC, the longer the after diagnosis hospitalization, CD, and, consequently, the longer the total LOS (Table 2; a1 = 0.42). Therefore, had all test results been reached upon admission, the total LOS would have been reduced and a fraction of the patients would have been discharged earlier. The inclusion of additional numerical and categorical variables such as inpatient’s age, gender and hospital attended was not found statistically significant.
The application of POC tests in Greek hospitals could decrease mean LOS, free up beds and save medical and nursing staff working hours as well as other important resources. A multivariable data analysis involving infants tested for herpes simplex virus (HSV) 25 concluded that the total LOS increased by 22 per cent for every 12-h increase in TAT. It has also been observed 33 that implementing a quicker test for respiratory pathogen detection decreases the mean LOS of inpatients with a positive laboratory result. 3 Also, the use of a quick test resulted in a 59 per cent reduction in the mean LOS of confirmed cases. 21 Moreover, the use of POC testing in an ED reduced the mean LOS by 51 per cent for adults with enterovirus meningitis (from 2.91 ± 2.31 days in 2005 to 1.43 ± 1.09 days from 2008 to 2010, p = 0.0009). 2 Our calculations for Crete yielded a conservative estimate of 10 per cent LOS reduction and a more plausible estimate of 34 per cent. This assessment does not include a possible shortening in hospitalization times for patients who received the laboratory diagnosis confirmation upon or after discharging. 22 Considering groups 0 and 1 jointly, the two estimates were (1) LOSq,0–1(plausible) = 5.14 (53% reduction) and (2) LOSq,0–1(conservative) = 9.28 days (16% reduction). Therefore, there is clear evidence that our forecasts do not overestimate the benefits of rapid POC testing.
The numerical results suggest that quick diagnosis may reduce hospitalization times by about 2.4 days per incident. Little’s formula from queuing theory was subsequently used to obtain estimates of the average occupancy and resource utilization. In another study, the application of quicker diagnostic procedures decreased the mean LOS by 3.2 days. 21 In this study, we computed occupancy-related indices only, describing the utilization of elastic resources, such as the number of bed days, attendance times of clinicians and paramedical personnel, meals served and cleaning services.
The method used in this study could be applied to any other country when the financing of a pilot operation of quick POC tests is a serious challenge and has to be supported by a proof of concept. The savings from the reduction in the use of resources as well as other indirect benefits of the rapid diagnosis should be accounted for and compared with the running costs of POC tests. A number of additional performance indices (queueing delays, bottlenecks, availability-admission capacity) can be computed through the use of other queueing theory formulas. This preliminary study should be followed by a pilot study involving both POC and central laboratory testing to selected patient groups,2,34 in order to conduct a systematic cost–benefit analysis of POC labs. 35 This topic will be the subject of further research.
Footnotes
Declaration of Conflicting Interests
The author(s) declared no potential conflicts of interest with respect to the research, authorship, and/or publication of this article.
Funding
The author(s) disclosed receipt of the following financial support for the research, authorship, and/or publication of this article: This work was supported by a scholarship granted to the first author by the Greek State Scholarships Foundation (IKY) under ‘IKY Fellowships of Excellence for Postgraduate Studies in Greece – Siemens Programme’ grant.