
Abstract
Objectives
Accurate prediction of hospital length of stay (LOS) is essential for effective patient flow management, resource allocation, and improved clinical outcomes, particularly in resource-intensive settings such as intensive care units (ICUs). Existing LOS prediction models often rely on post-admission data or focus on homogeneous patient populations, which limits their utility for early operational planning. This study aims to develop a sequential machine-learning framework to predict total hospital LOS using admission-time information. The framework predicts ICU admission and ICU duration as intermediate outcomes, which are then incorporated as features to improve total LOS prediction while also providing standalone operational value for early resource planning.
Methods
We propose a sequential prediction framework that decomposes LOS prediction into staged tasks, enabling early and interpretable clinical and operational decision support. The framework was validated using a large dataset consisting of 1,104,203 patient admissions from 52 Maryland hospitals, including 20 admission diagnoses and 29 comorbidities. Deep learning and classical machine learning models were employed for both classification and regression tasks, and performance was compared with traditional single-stage LOS prediction approaches.
Results
The XGBoost classifier predicted ICU admission with an accuracy of 0.73, sensitivity of 0.76, and specificity of 0.72. Incorporating ICU-specific predictions improved total hospital LOS prediction performance. For LOS classification, the proposed framework achieved an F1 score of 0.701 (a 5.1% relative improvement) and a macro AUC-ROC of 0.76 (a 1.9% relative improvement) compared with single-stage models. Regression analysis resulted in a mean absolute error of 2.62 days for LOS prediction.
Conclusion
The proposed sequential, ICU-informed machine-learning framework enhances the accuracy and interpretability of total hospital LOS prediction using admission-time data. By explicitly modeling ICU admission and ICU LOS as intermediate outcomes, the framework provides actionable insights to support early patient flow management, resource utilization, and operational planning within hospital systems.
Keywords
Introduction
Hospital length of stay (LOS) reflects both patient severity and hospital efficiency, and measures the time from admission to discharge across units like the intensive care unit (ICU), critical care unit (CCU), and surgical wards. 1 Both unnecessary long or insufficiently short stays can be problematic for patient outcomes and hospital operations. Prolonged stays raise the risk of infections, 2 miscommunication due to more provider hand-offs, 3 and reduced capacity, 4 especially during crises like pandemics.5,6 Conversely, short stays may lead to inadequate care and higher readmission risk. Accurately predicting LOS is therefore critical not only for patient care but also for operational planning, as it supports more efficient bed utilization and staff scheduling, helping to improve system-level resource management. 7
The hospital LOS, depends on a combination of patient-specific and hospital-related factors. From the patient side, individuals with more severe conditions are generally expected to stay longer. While primary diagnosis influences LOS, it is not always the main driver. For example, a patient admitted with intracerebral hemorrhage (ICH) may have prolonged LOS due to a secondary condition like acute kidney injury (AKI). Thus, LOS prediction should consider all diagnoses and comorbidities at admission to be accurate and not misleading. On the hospital side, operational factors like discharge delays, insurance approvals, and hospital capacity all affect LOS. Lack of beds in downstream units prolongs ICU stays and reduces hospital throughput. These complexities motivate our goal to improve LOS prediction at admission by addressing limitations found in prior research. Most LOS studies focus on homogeneous groups, limited to diagnoses like cardiology, diabetes, or neurology.8–11 In contrast, fewer studies address heterogeneous populations. 12 Studies also vary in whether they treat LOS as a regression or classification task, in the thresholds used for classification, and in the choice of predictive methods and evaluation metrics.
Among studies on homogeneous populations, Hachesu et al. 13 classified LOS for 2,064 cardiology patients into three groups and achieved 96.4% accuracy using neural networks, support vector machines (SVMs), and decision trees. Tsoukalas et al. 14 used SVMs to classify LOS in 1,492 sepsis patients with thresholds at 4, 8, and 12 days, reporting 0.69–0.82 accuracy and 0.69–0.73 area under curve (AUC). Turgeman et al. 15 applied regression trees to 20,321 cardiology patients, resulting a mean absolute error (MAE) of 1 and coefficient of determination (R2) of 0.79. For heterogeneous populations, Livieris et al. 16 used semi-supervised models on 4,403 inpatients and achieved 63.23–65.30% accuracy. Baek et al. 17 used a 30-day LOS threshold and reported 0.9732 accuracy and 4.68 MAE. Tully et al. 18 applied an XGBoost classifier with SMOTE balancing to predict whether ambulatory surgical patients would stay in the post-anesthesia care unit for three hours or longer, and the model achieved an AUC of 0.712. Rajkomar et al. 19 applied RNNs across six disease groups, achieving 85–86% AUC, these results are hospital-specific with using the data obtained within 24 hours of admission. For regression tasks, R2 scores vary: 0.554 Cui et al., 12 0.2 Saly et al., 20 and 0.146 Liu et al. 21 MAEs range from 2.19 to 3.51 days, with root mean squared error (RMSE) of 3.10 reported by Cui et al. 12
Recent studies have applied machine learning to predict ICU admission (i.e., whether a patient will require ICU care during hospitalization) and ICU length of stay (ICU-LOS), addressing challenges such as non-linearity, class imbalance, and diverse clinical features. 22 For example, Peres et al. 23 used a stacking model on 99,492 ICU admissions and achieved an RMSE of 3.82 and AUC of 0.87. In that cohort, 68.6% of patients were admitted through the emergency department, and 52.8% were female. Another recent work Brochini et al. 24 modeled ICU and hospital LOS separately for survivors and nonsurvivors but relied on post-admission data. Ma et al. 25 proposed a JITL-ELM model using 48-hour physiological data, achieving an AUC of 0.8510. Similarly, Iwase et al. 26 used 91 variables within 24 hours post-ICU admission and reported high AUCs for mortality and LOS prediction using Random Forest. Navaz et al., 27 using MIMIC-II data, applied decision tree methods and reported variable accuracy across LOS categories. Lan et al. 28 highlights the value of ML in early risk stratification and ICU planning, and developed machine learning models using preoperative data to predict prolonged ICU admission (>24h) after elective non-cardiac surgery. Using a cohort of over 135,000 patients, their gradient boosting model achieved a high performance (AUC-ROC=0.90).
While past studies report good results, they often rely on post-admission data or focus on single diagnoses,8–11 which limits their generalizability and practical utility. Some models were also trained using data from a single hospital,16,17 further reducing their ability to generalize across different care settings. This issue of poor generalizability was also emphasized by Gokhale et al., 29 who, after systematically reviewing 15 studies on LOS prediction in general surgery and knee arthroplasty patients, highlighted that only a few studies employed machine learning methods, along with the lack of external validation, as key shortcomings of existing models. In contrast, recent evidence shows that models trained on multi-institutional datasets achieve significantly better generalization Rockenschaub et al. 30 To address these gaps, our approach uses only admission-time information, which provides actionable insights at the earliest stage of care. We further disaggregate length of stay (LOS) to capture the effects of unit-level capacity constraints, incorporate 20 admission diagnoses and 29 comorbidities to reflect patient clinical complexity, and leverage data from 52 hospitals to enhance the generalizability of our findings. Together, these features make our approach a more practical tool for early decision-making and system-level hospital management.
Methodology
Our proposed framework (Figure 1) predicts total hospital LOS through three sequential stages: (1) ICU admission prediction, (2) ICU-LOS prediction, and (3) total LOS prediction. The main goal of this framework is to predict total hospital LOS. The model uses a sequential structure in which each stage builds on the predictions from the previous stage. First, ICU admission is predicted, then ICU length of stay (ICU-LOS), and finally total hospital LOS. Because ICU admission and ICU-LOS strongly affect overall hospital stay, incorporating these intermediate predictions improves the accuracy of LOS prediction. In addition, each stage provides operational insights for ICU bed allocation, staffing planning, and discharge coordination, so the intermediate predictions also support clinical and operational decision-making. Sequential modeling framework for length of stay prediction. (ICU: Intensive care unit; LOS: Length of stay).
Data preprocessing
All post-admission information was excluded from the dataset. Specifically, we retained only pre-admission data, historical records, and admission diagnoses. The preprocessing steps were as follows: • Observations with ICU-LOS or total LOS exceeding 60 days (0.27%) were removed. • Diagnoses or procedures observed in fewer than 0.5% of cases were excluded. • Categorical variables were one-hot encoded; age was standardized using Z-score normalization. • Features with both low SHAP importance and high multicollinearity (VIF • Missing values in categorical variables were retained as a separate category prior to one-hot-encoding. Missingness in binary variables were replaced with 0, and rows with missing LOS or AGE values were removed due to their negligible frequency (< 0.1%).
After preprocessing, the final dataset comprised 1,104,203 records and 122 variables, including ICU, ICU-LOS, and total LOS.
Data splitting strategy
To ensure model generalizability and prevent data leakage across stages, we implemented a structured multi-stage data splitting strategy (Figure 2). The dataset was partitioned into four non-overlapping subsets: Subset I (20%) is the training data for Stage 1, Subset II (20%) used as the training data in Stage 2, Subset III.a (30%) is the training data of Stage 3, and Subset III.b (30%) is held-out as the test set for final LOS evaluation. The test set remained strictly isolated throughout all feature selection, hyperparameter tuning, and model training processes across all three stages. The hyperparameter tests were conducted using the respective training subsets. During the final evaluation, the test set (Subset III.b) was processed sequentially through the trained pipeline to obtain unbiased estimates of generalization performance. Data splitting approach to prevent data leakage and overfitting.
Stage 1 – ICU admission prediction
The objective is to predict whether a patient will require ICU admission using only admission data (Figure 1).
Input features: 119 admission variables (ICU, ICU-LOS, and total LOS are excluded)
Output: Trained binary classification model (ICU = 0 or 1).
Process: 1. Train classification model on Subset I 2. Generate predicted ICU class (ICU
p
) for Subsets II, III.a, and III.b 3. Append ICU
p
as a new feature to these subsets
Since the ICU admission variable is highly imbalanced (12.55% positive class). We evaluated SMOTE, up-sampling, and under-sampling techniques; general up-sampling provided optimal performance and was applied exclusively to training data. The models evaluated at this stage include Logistic Regression, AdaBoost, Random Forest, XGBoost, and neural networks with varying architectures.
Stage 2 – ICU-LOS prediction
The objective is to predict the duration of ICU stay using admission data augmented with ICU p (Figure 1).
Input features: 120 variables (119 original + ICU p from Stage 1)
Output: ICU-LOS prediction model and predicted ICU duration in days (DaysICU p ) on the training set.
Process: 1. Augment Subset II with ICU
p
predictions from Stage 1 2. Train prediction model on augmented Subset II 3. Generate predicted ICU-LOS (DaysICU
p
) for Subsets III.a and III.b 4. Append DaysICU
p
as a new feature to these subsets
We applied both classification and regression approaches for the DaysICU p prediction. To avoid error propagation, we trained the ICU-LOS model on all patients, including those predicted as non-ICU in Stage 1. Setting DaysICU p to zero for predicted non-ICU cases would carry forward misclassification errors from Stage 1. We evaluated linear, tree-based, and neural network models for all prediction tasks. For the classification approach, we defined thresholds to group patients based on the duration of their ICU stay: class 1: ICU-LOS ≤ 1, class 2: 1 < ICU-LOS ≤ 3 days, class 3: ICU-LOS > 3 days.
Stage 3 – Total LOS prediction
The objective is to predict total hospital LOS using pre-admission data augmented with ICU p and DaysICU p (Figure 1).
Input features: 121 variables (119 original + ICU p + DaysICU p )
Output: LOS prediction model
Process: 1. Augment Subset III.a and III.b with ICU
p
and DaysICU
p
predictions 2. Train LOS prediction model on augmented Subset III.a 3. Evaluate on augmented Subset III.b (held-out test set)
We implemented both regression and classification approaches because each serves a different purpose: regression offers a more granular estimate of LOS, while classification provides operationally meaningful LOS categories that are directly useful for capacity planning and resource management. In our study, LOS is categorized as follows: class 1: LOS ≤ 7 days, class 2: 7 < LOS ≤ 14 days, and class 3: LOS > 14 days. General up-sampling. 31 was applied to minority classes in the training set. Models evaluated include Logistic Regression, AdaBoost, Random Forest, XGBoost, and neural networks with varying architectures for the classification approach; and Ridge Regression, XGBoost, Random Forest, AdaBoost, and neural networks with varying architectures for the regression approach.
This sequential, modular design allows each stage to contribute valuable predictive information and helps to build a more accurate and interpretable model for hospital LOS prediction. All modeling experiments were repeated five times with different random seeds and data shuffling to account for variability arising from random parameter initialization. Performance metrics are reported as averages across runs.
Worked example
Worked example: Sequential LOS prediction for a sample patient.
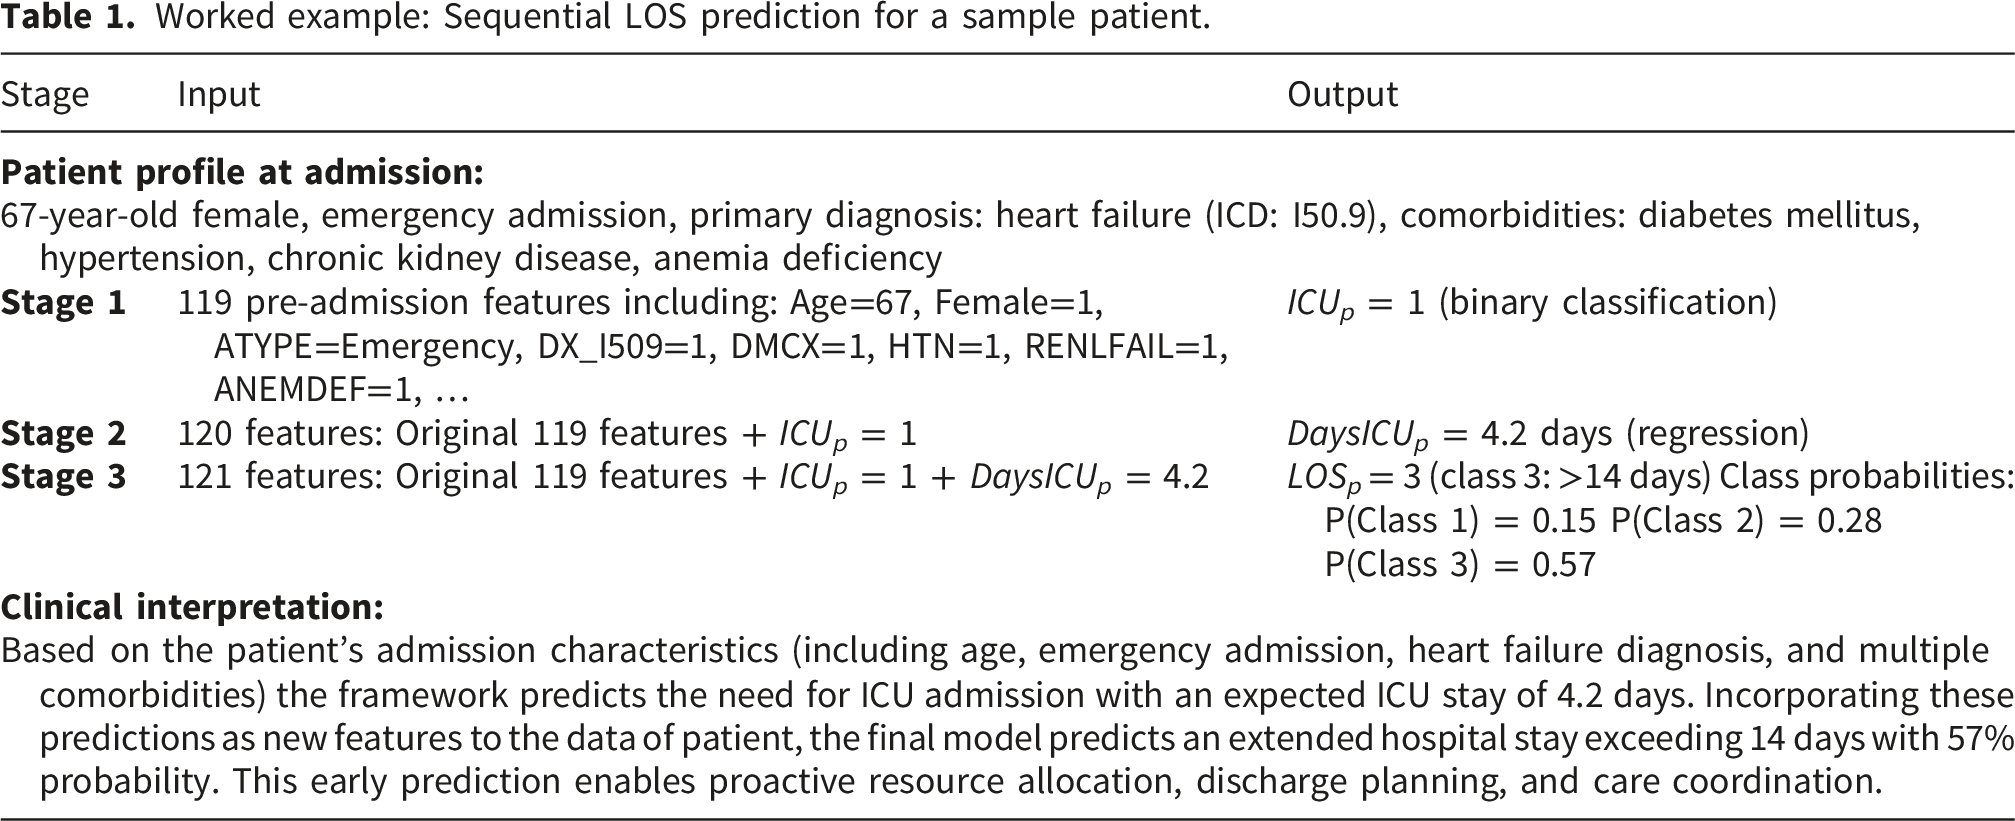
The sequential flow of predictions can be expressed mathematically as:


Case study and results
We used the 2017–2018 Maryland State Inpatient Databases (SID), Healthcare Cost and Utilization Project (HCUP), Agency for Healthcare Research and Quality. 32 The dataset includes patient demographics, socioeconomic data, ICD-10 codes, ICU admissions, ICU-LOS, and total LOS from 52 Maryland community hospitals. Additionally, it considers five groups of variables: demographics, administrative data, admission and comorbidities, and procedures. A detailed list of variables is provided in the supplementary material.
Figure 3 shows the total hospital LOS distribution for all patients, and Figure 4 shows both total hospital LOS and ICU-LOS distributions for ICU patients. Both figures are truncated at 30 days for visual clarity, as cases exceeding this duration represent a small fraction of the dataset and do not meaningfully contribute to the distributional patterns. Across all patients (n=1,104,203), the median age was 58 years, 57% were female, and the average hospital LOS was 4.79 days (SD: 5.57, median: 3), with a right-skewed distribution (skewness: 3.88). ICU admission occurred in 12.55% of patients (n=138,589). Among ICU-admitted patients, the median age was higher at 61 years, 47% were female, and the average hospital LOS increased substantially to 8.06 days (SD: 8.69, median: 5, skewness: 2.52), demonstrating the significant impact of ICU care on overall hospital stay duration. In comparison, non-ICU patients had an average LOS of 4.32 days (SD: 4.78, median: 3). Distribution of total LOS for all patients admitted to hospitals. Distribution of total LOS and ICU-LOS in ICU patients group.

For ICU-LOS specifically, ICU-admitted patients spent an average of 4.31 days in the ICU (SD: 6.15, median: 2, skewness: 3.99), with the remaining 3.76 days on average spent in other hospital units. The right-skewed distribution indicates that while most ICU patients had brief stays, a subset required prolonged intensive care. Based on this distribution and clinical considerations, we defined three ICU-LOS categories: ICU-LOS ≤ 1 day (34% of ICU patients, n=47,256), representing brief observation or post-operative stabilization; 1 < ICU-LOS ≤ 3 days (33%, n=45,764), representing moderate ICU stays requiring active critical care management; and ICU-LOS > 3 days (33%, n=45,569), representing prolonged intensive care associated with increased complications, higher mortality risk, and substantial resource utilization. The relatively uniform distribution across these three categories provides balanced class representation for predictive modeling while maintaining clinical interpretability.
For total hospital LOS, we selected thresholds of 7 and 14 days. The 7-day threshold is widely employed in LOS prediction studies, and stays longer than 7 days are considered to be associated with increased post-discharge adverse outcomes and complications (33–35). The 14-day threshold is also well-established for defining prolonged hospitalization, commonly chosen in literature as it marks the point where patients face substantially increased risks of hospital-acquired complications such as infections, delirium, and functional decline, while simultaneously requiring intensified resource utilization including extended nursing care, specialist consultations, and complex discharge planning.36,37 This resulted in three categories: LOS ≤ 7 days (84% of patients, n=931,228); 7–14 days (11%, n=117,895); and LOS > 14 days (5%, n=55,080).
Figure 5 shows the prevalence and LOS for various admission diagnosis for patients in the ICU and hospital. The lengths of the bars represent the average LOS for each condition and the percentages represent the distribution of diagnoses. The longest ICU and hospital stays are associated with weight loss (WGHTLOSS), pulmonary circulation disorders (PULMCIRC), and paralysis (PARA), with WGHTLOSS linked to the highest LOS overall. The most common ICU diseases are hypertension with complications (HTN-C), electrolyte imbalances (LYTES), and anemia (ANEMDEF), with HTN-C affecting 54.7% of ICU and 48.5% of hospital patients. HTN-C patients average 3.84 ICU days and 5.25 hospital days. This chart provides a clear picture of which admission diagnoses lead to longer hospital or ICU stays and affect more patients, which highlights the need for targeted care and prevention strategies. Comparative analysis of ICU and hospital LOS by comorbidities prevalence. Dark blue bars (left) represent the average ICU length of stay (LOS) for patients with each admission diagnosis; light blue bars (right) show the average hospital LOS. Percentages on the bars indicate the prevalence of each diagnosis in the ICU (left) and hospital (right) populations.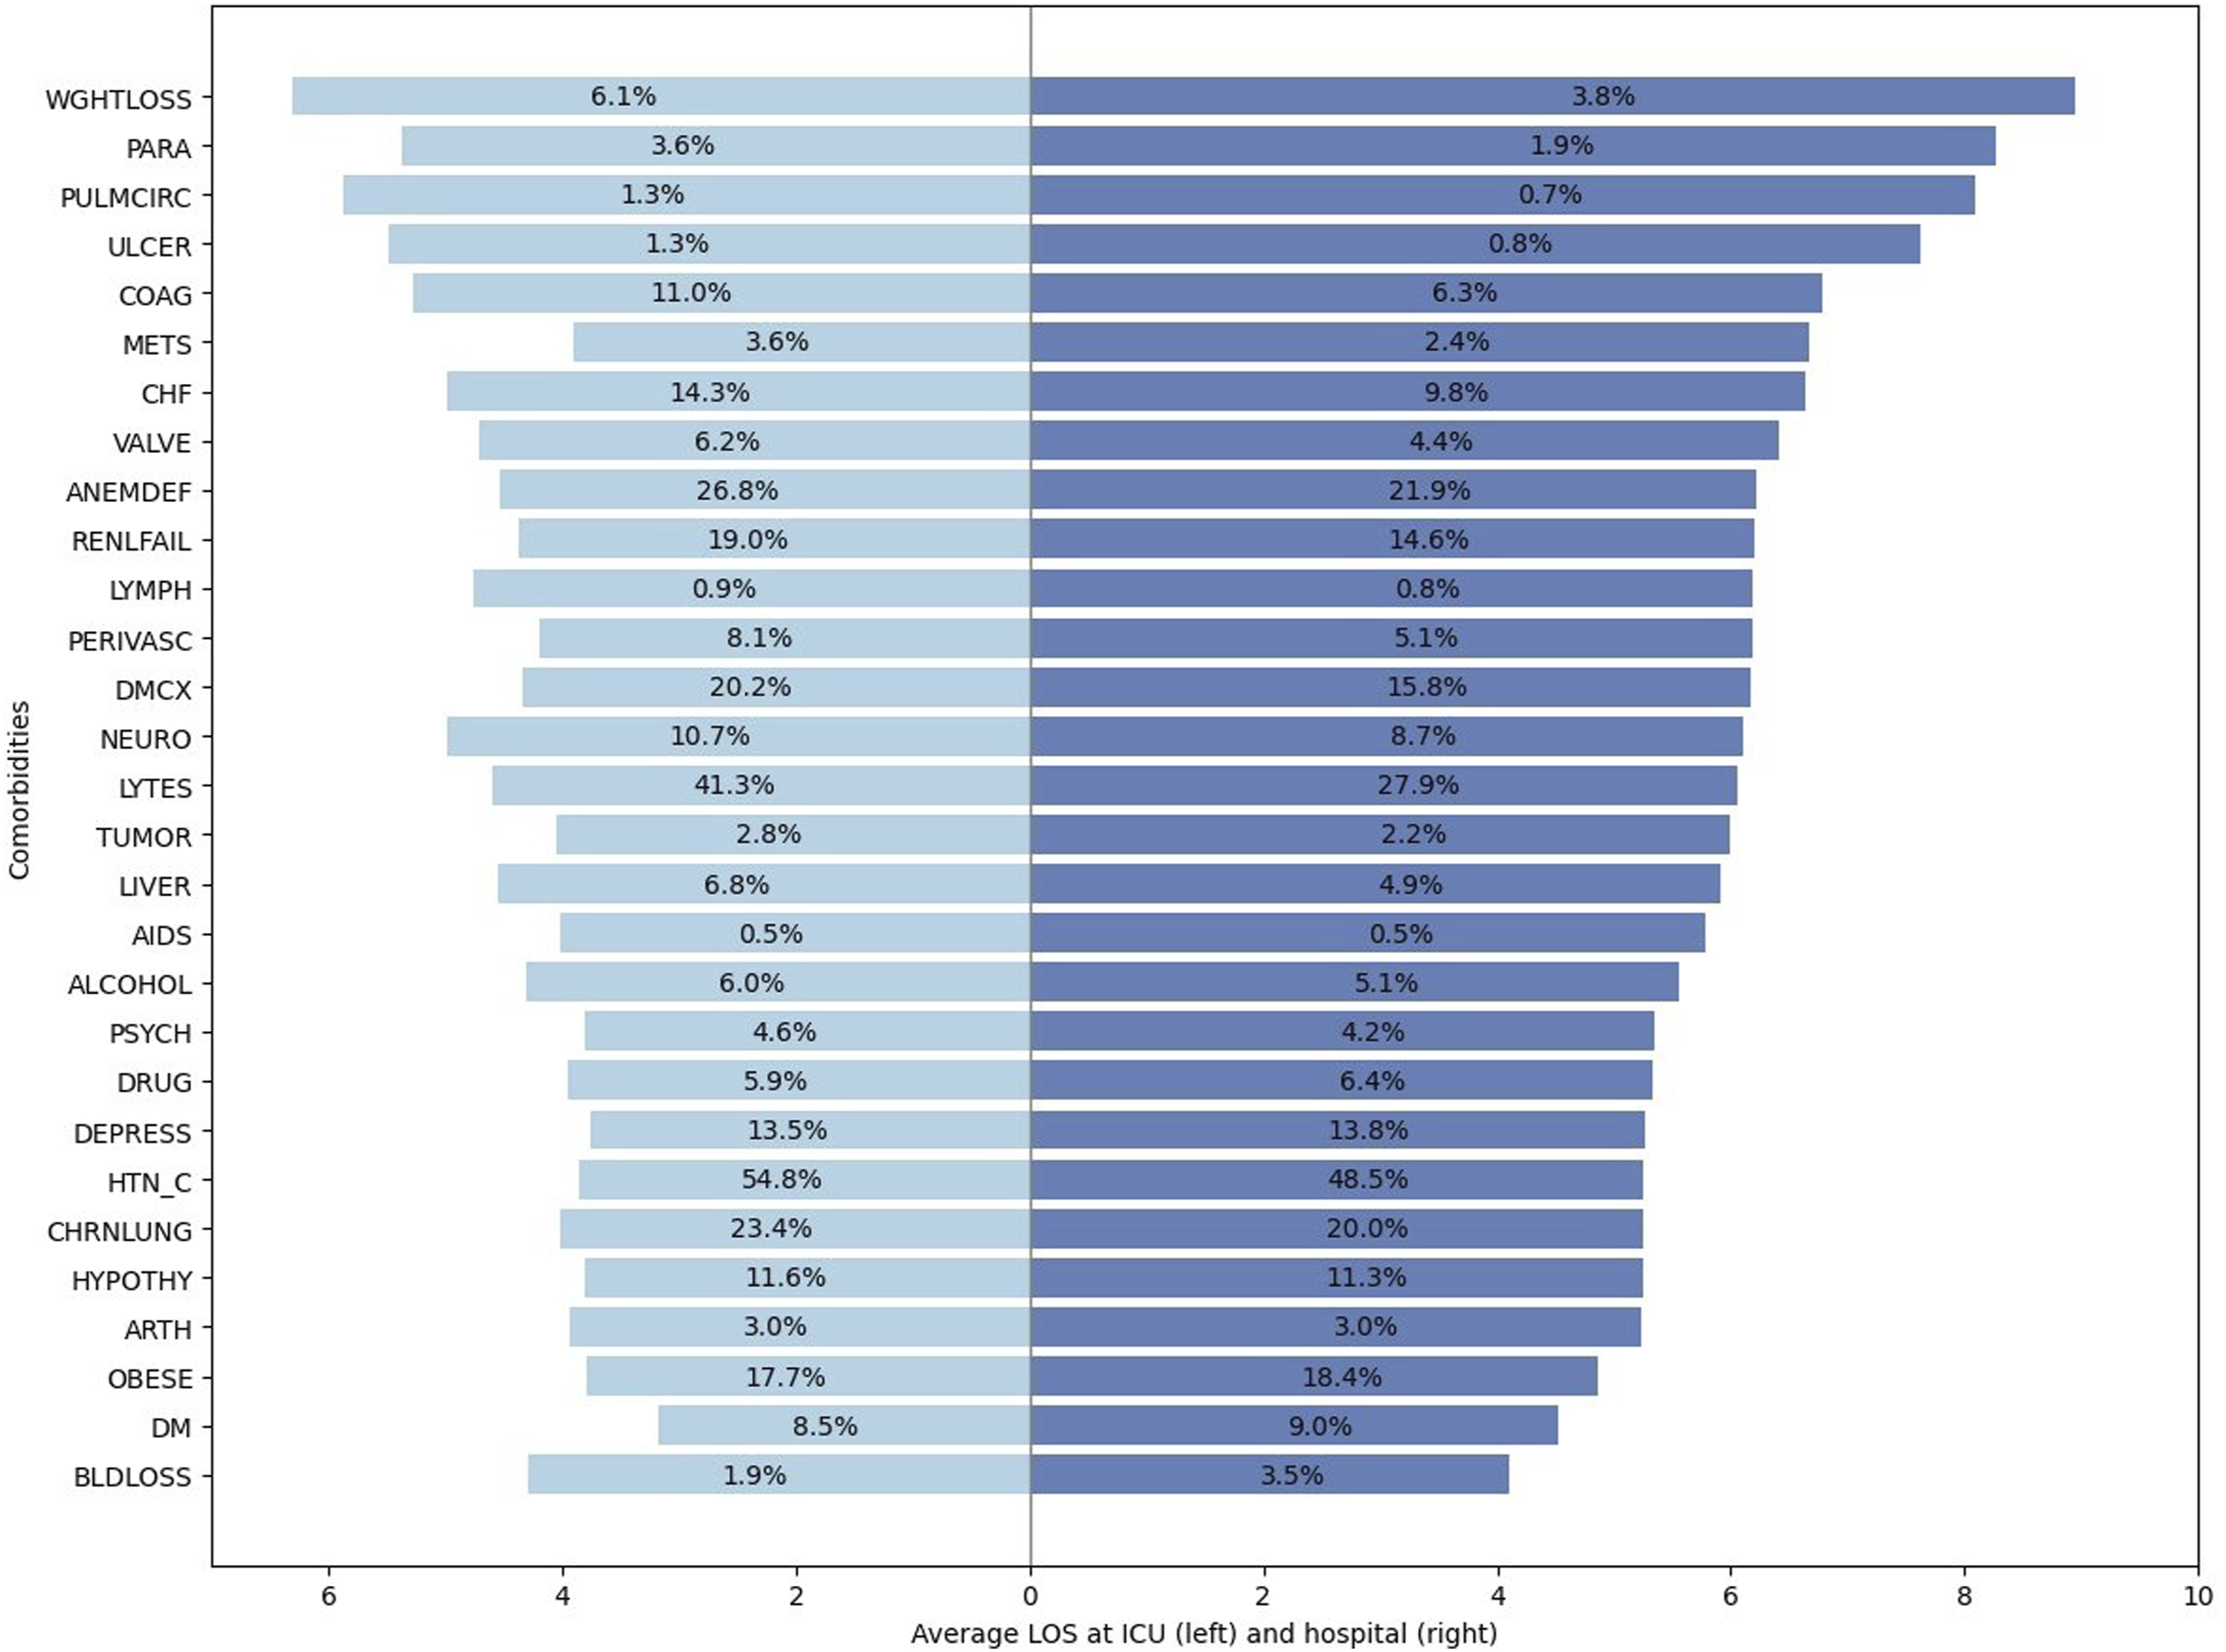
Having identified the diagnoses associated with longer ICU and hospital stays, we next focus on building predictive models for ICU admission and LOS. We evaluated seven classification models for predicting ICU admission: Logistic Regression, AdaBoost, Random Forest, XGBoost, and three neural network architectures of increasing complexity (ICU-1, ICU-2, ICU-3), ranging from 7 to 11 layers to capture different levels of feature interactions. Hyperparameters for all models were tuned using grid search. The full list of hyperparameters evaluated and the detailed neural network configurations are provided in Tables 8 and 9 in the Appendix.
Stage 1 results: ICU admission classification performance (positive class: ICU admitted). Sensitivity measures correct identification of ICU cases, while specificity measures correct identification of non-ICU cases.

aSelected model for downstream pipeline.
Stage 2 results: ICU-LOS regression.

aSelected model for the pipeline.
We also explored classification models across three classes: Class 1 (ICU-LOS ≤ 1 day), Class 2 (1 < ICU-LOS ≤ 3 days), and Class 3 (ICU-LOS > 3) for ICU-LOS prediction. We performed hyperparameter optimization and architecture search for XGBoost, Random Forest, AdaBoost, Logistic Regression, and neural network architectures (details in Appendix Tables 10 and 11) using grid search.
Stage 3 results: Comparative analysis of XGBoost (classification) and XGBoost (regression) models for ICU-LOS prediction (Stage 2). The models used in stages 1 and 3 are fixed. Class 1: LOS ≤ 7 days; class 2: 7–14 days; class 3:

In Stage 3, after adding the ICU p and DaysICU p values, we evaluated LOS prediction with both classification and regression approaches. Hyperparameter configurations tested for all models are provided in the Appendix ( Tables 13 and 14). All models are trained on 30% of data (Subset III.a) and tested on 30% (Subset III.b).
The results show that incorporating the Stage 2 regression output into the Stage 3 model leads to higher performance improvements across most metrics. We achieved slightly higher macro AUC-ROC (0.7638 vs. 0.7628), balanced accuracy (0.5356 vs. 0.5340), overall accuracy (0.6406 vs. 0.6373), and weighted F1-score (0.7015 vs. 0.6999). Calibration analysis (Figure 8) and confusion matrix (Figure 9) are provided in the Appendix.
Stage 3 results: Total LOS classification performance. Class 1: LOS ≤ 7 days (84%); class 2: 7–14 days (11%); class 3:

aSelected model.
Stage 3 results: Total LOS regression results on the test set with log-transformed LOS.

aBest model performance.
Comparison of total LOS classification performance across modeling scenarios using XGBoost (depth=6, lr=0.3). Scenario A excludes ICU and DaysICU information, scenario B incorporates predicted ICU and predicted DaysICU, and scenario C includes real ICU and DaysICU values directly. All scenarios are trained on subset III.a (30%) and tested on subset III.b (30%).

Note. Training Scenario A on combined Subsets I, II, and III.a (70% of data) achieved Macro AUC-ROC of 0.760, overall accuracy of 0.616, and weighted F1-score of 0.670, which remain lower than the performance achieved in Scenario B.
Table 7 compares LOS classification performance across three modeling scenarios to evaluate the contribution of ICU-related information. Scenario A, which excludes ICU and DaysICU features entirely, serves as the baseline with a Macro AUC-ROC of 0.750. Scenario B incorporates the predicted ICU status (ICU p ) and predicted ICU duration (DaysICU p ) from the cascaded pipeline, resulting in an improvement in overall accuracy to 0.64 (95% confidence interval (CI): 0.639–0.642), a 5.1% relative improvement compared to Scenario A, and an increase in macro AUC-ROC to 0.764 (95% CI: 0.763–0.767), corresponding to a relative improvement of 1.9%. Scenario C, which uses actual ICU and DaysICU values, represents the theoretical upper bound with a Macro AUC-ROC of 0.786. Notably, our cascaded approach (Scenario B) captures approximately 39% of the potential improvement between having no ICU information and having perfect ICU information, computed as (0.764 − 0.750)/(0.786 − 0.750). The performance gains are consistent across metrics: overall accuracy improved from 0.620 (Scenario A) to 0.641 (Scenario B), and weighted F1-score increased from 0.667 to 0.702 (95% CI: 0.700–0.703).
In all three scenarios, the LOS model is trained on Subset III.a and tested on Subset III.b. From this perspective, Scenario B benefits from using additional data (Subsets I and II) to create informative intermediate features. This raises an important question: would using all available data, Subsets I, II, and III.a, for direct LOS prediction (Scenario A) outperform the sequential approach (Scenario B), which instead allocates Subsets I and II to generate intermediate features? To answer this, we trained the LOS model on the combined dataset (70% of data) without intermediate predictions and compared it against Scenario B, with both evaluated on Subset III.b. The results show that the larger training set achieved a Macro AUC-ROC of 0.760, overall accuracy of 0.616, and weighted F1-score of 0.670. While this represents an improvement over Scenario A trained on Subset III.a alone (Macro AUC-ROC: 0.750, overall accuracy: 0.620, weighted F1-score: 0.667), it remains below the performance of Scenario B (Macro AUC-ROC: 0.764, overall accuracy: 0.641, weighted F1-score: 0.702). These results demonstrate that while additional training data provides modest gains, the cascaded approach that strategically uses this data to generate informative intermediate features (ICU p and DaysICU p ) achieves superior predictive performance. This validates our framework design that allocating data to create informative features yields greater benefit than simply expanding the training set for direct LOS prediction, even when these new features are imperfect.
To validate the contribution of the predicted ICU-related features, we conducted feature importance analysis using both XGBoost gain scores and SHAP values provided in the Appendix, Table 15. The analysis shows that ICU p and DaysICU p rank among the top 10 most influential features (SHAP ranks 8 and 6, respectively). This confirms that the cascaded pipeline provides meaningful complementary information for LOS prediction.
Model performance at Stage 3 was evaluated across demographic subgroups to assess equity. The model demonstrated consistent performance across racial groups, with Macro AUC-ROC ranging from 0.760 to 0.805. Greater variation was observed across age groups. The model performed best for young adults (18–44 years, AUC 0.808) who had the lowest rate of prolonged stays (2.8%). In contrast, pediatric (0–17 years, AUC 0.708) and elderly patients (80+ years, AUC 0.723) showed lower model performance and higher rates of prolonged LOS (7.1% and 4.7%, respectively). Similarly, the model achieved higher AUC for females (0.787) compared to males (0.732), corresponding to lower prolonged LOS rates in females (4.2% vs 6.1%). Subgroups with more prolonged stays are harder to predict due to greater clinical heterogeneity and the difficulty of predicting rare outcomes in imbalanced distributions. Despite these variations, the model maintained acceptable discrimination (AUC >0.70) across all subgroups.
Discussion
Accurate prediction of ICU outcomes at hospital admission serves multiple critical functions in modern healthcare delivery. As emphasize in the work by Power et al., 38 ICU outcome prediction models are essential for benchmarking institutional performance, supporting quality improvement initiatives, and enabling risk-adjusted comparisons across healthcare facilities with differing case mixes. By generating early, admission-time LOS estimates, our framework further supports hospital-level benchmarking efforts, such as standardized length of stay ratio (SLOSR) efficiency metrics, 39 by enabling fair comparisons between observed and expected resource utilization across institutions. Beyond benchmarking, LOS prediction at ICU admission enables proactive resource allocation, facilitates communication with families regarding expected trajectories, and supports discharge planning to optimize patient flow. 40 Building on prior identification of clinical factors that drive total LOS such as mechanical ventilation and hypomagnesemia that account for longer stays, 41 we further identify diagnosis-specific patterns in total LOS. Conditions such as weight loss and paralysis are associated with longer stays despite lower prevalence, indicating a higher per-patient resource burden. In contrast, common diagnoses such as hypertension with complications and anemia affect a large proportion of patients but are associated with more moderate LOS. These patterns highlight the importance of considering both prevalence and LOS when assessing diagnosis-specific impacts on hospital resource utilization.
Comprehensive review of application of machine learning to predict critical care outcome prediction provided at, 22 demonstrates that ensemble methods like XGBoost and neural networks effectively address challenges including non-linear relationships, class imbalances, and missing data. Consistent with these findings, XGBoost emerged as the best-performing model across all stages of our framework, achieving an F1-score of 0.701, representing a 5.1% relative improvement, and a macro AUC-ROC of 0.76, corresponding to a 1.9% improvement over traditional single-stage prediction models, despite deliberately excluding post-admission physiological data commonly used in prior studies. While models using first-24-hour data or dynamic updating during hospitalization can achieve higher accuracy,22,41 they address a fundamentally different clinical question than admission-time prediction. Our approach prioritizes immediate operational utility over maximal predictive accuracy, recognizing that hospitals require actionable predictions at the moment of admission when critical resource allocation decisions must be made.
While the primary goal of our three-stage sequential framework is to predict total hospital LOS, it also provides advantages for hospital operational planning by decomposing the complex LOS prediction into clinically meaningful intermediate predictions. The first stage’s strong performance (AUC 0.835 for ICU admission prediction) enables immediate bed allocation decisions. For ICU-admitted patients, the second stage provides refined ICU-LOS predictions that inform staffing and discharge coordination. Finally, the third stage integrates these intermediate predictions with admission features to produce total hospital LOS forecasts. This staged approach mirrors actual clinical decision-making pathways and allows different components to be updated or recalibrated independently as clinical practices evolve. If the goal were only to predict ICU duration for ICU-admitted patients, restricting the analysis to that subgroup would be more appropriate. However, our framework generates predictions at admission for all patients with unknown ICU status, to support proactive resource allocation.
Our analysis of comorbidity-specific patterns (Figure 5) reveals substantial variation in expected LOS across diagnostic categories, with cardiovascular conditions and multiple comorbidities associated with longer stays, findings that extend the researchers’ systematic identification of prolonged-stay risk factors at. 41 The framework’s validation across 52 diverse Maryland hospitals demonstrates cross-institutional robustness within a single state healthcare system, though external validation on geographically distinct datasets remains an important priority for future research.
In developing our sequential prediction model, a key decision was whether to use real or predicted values when training later-stage models. For example, we first train a model to predict ICU admission. In the next stage, we use its predictions to train the ICU-LOS model. Our results show that using predicted values, rather than real ones, even during training improves results in subsequent stages. To further refine the models, in stage 2, we predicted ICU-LOS only for patients predicted to require ICU care and assigned a value of zero to others. With this approach, we aimed to address class imbalance by focusing the ICU-LOS model on likely ICU cases. However, it led to reduced accuracy in both ICU-LOS and total LOS predictions. The reason is that misclassified ICU patients had ICU-LOS incorrectly set to zero which negatively impacts subsequent models. We also explored alternative strategy of truncating ICU-LOS to 0–14 days but observed no significant performance improvement.
As shown in Table 7, while our model achieves a Macro AUC-ROC of 0.764, outperforming the 0.69–0.73 range reported by, 14 our approach covers 29 disease groups, offering broader applicability than their single-disease focus. Although 19 achieved higher AUC (85–86%), their models relied on detailed, early-stage clinical data and were hospital-specific. In contrast, our model performs well using only admission-time data and is validated across 52 hospitals, highlighting its generalizability. In regression tasks, our R-squared of 0.16 is in line with reported values in the literature (0.146–0.554), reinforcing the model’s competitive performance and wide utility for hospital-wide LOS prediction. In contrast to many prior ICU and LOS prediction studies that rely on single-center or limited-cohort datasets, our analysis leverages a large, multi-hospital administrative dataset and 1,104,203 admissions, enhancing robustness, heterogeneity, and real-world generalizability.
Conclusion
Accurate prediction of hospital LOS is crucial for improving patient care, optimizing resource use, and reducing healthcare costs. To address this, we developed a structured, multi-stage prediction pipeline that improved total LOS classification performance, increasing the F1 score from 0.667 to 0.701 (a 5.1% improvement) and the macro AUC-ROC from 0.749 to 0.763 (a 1.9% increase). In building this framework, we also introduced effective strategies for data splitting, and preprocessing to manage nonlinearity, class imbalance, and skewness, common challenges in LOS data, offering methodological guidance for similar studies.
Beyond technical contributions, our work provides operational insights. Prolonged ICU stays often result from downstream unit bottlenecks rather than medical need. By disaggregating LOS prediction, our approach helps identify ICU-level demand and supports improved patient flow. Unlike most studies focused on a single diagnosis, our dataset spans 20 admission diagnoses, 29 comorbidities, and draws from 52 hospitals, capturing greater clinical and operational variability. This heterogeneity strengthens the model’s applicability, especially under high-demand conditions. Additionally, we identified diagnoses most associated with prolonged stays, supporting targeted preventive strategies and early interventions.
While our framework shows strong performance, some limitations should be acknowledged. First, the model depends on access to prior patient records within the same hospital system and may require periodic retraining to adapt to changes in treatment protocols and healthcare technologies. Second, laboratory measurements from the initial hours of admission and device-use indicators were not included in this study. While such features have been shown to improve LOS prediction in prior work, our objective was to develop a model based exclusively on admission-time information to support early risk stratification and operational decision-making. Third, our results provides evidence of cross-institutional robustness within a single state healthcare system. However, external validation on geographically distinct datasets with different healthcare systems would be beneficial. Future studies could leverage national datasets (e.g., MIMIC-IV, eICU) or international databases to test generalizability and identify any necessary recalibration. Despite these limitations, our findings demonstrate that a sequential, trajectory-based approach can substantially improve LOS prediction and provide a valuable tool for hospital management.
To support transparency and future research, we have shared our code on GitHub in accordance with TRIPOD-AI guidelines, 42 and the TRIPOD-AI checklist is provided in the supplementary material.
Supplemental material
Supplemental material - A sequential machine learning framework for ICU and hospital length of stay prediction from admission-time data
Supplemental material for A sequential machine learning framework for ICU and hospital length of stay prediction from admission-time data by Maryam Jafaripakzad, Jorge A. Acuna, Keith Dombrowski, José L. Zayas-Castro in DIGITAL HEALTH
Footnotes
Consent to participate
This article does not contain any studies with human participants or animals performed by any of the authors. The case study presented herein utilizes an anonymous dataset, and does not entail the involvement of human or animal subjects. Therefore, patient consent was not required. HCUP Databases Are Limited Data Sets. Under HIPAA, review by an institutional review board (IRB) is not required for use of limited data sets ![]() .
.
Author contributions
All authors listed on the submission made substantial contributions to the conception or design of the work. M.J. was responsible for the development of the prediction models and writing the original draft of the manuscript supported by J. A. In addition, M.J. and J.A. contributed to the analysis and interpretation of the data and results. J. A. and J. Z. contributed to the design of the prediction framework and helped shape the overall research approach. K.D. provided insights into the healthcare system and contributed to aligning the work with real-world clinical impact. All authors edited, wrote, and revised the manuscript critically for important intellectual content. All authors approved the final version of the manuscript and agree to be accountable for all aspects of the work to ensure that any questions related to the accuracy or integrity of any part of the work are appropriately investigated and resolved.
Funding
The authors received no financial support for the research, authorship, and/or publication of this article.
Declaration of conflicting interests
The authors declared no potential conflicts of interest with respect to the research, authorship, and/or publication of this article.
Supplemental material
Supplemental material for this article is available online.
Appendix
Hyperparameter configurations tested for stage 1 (ICU admission prediction). Best configurations (marked with *) were selected.
Model
Hyperparameter
Values tested
Best
Val. AUC
Logistic Regression
C
0.01, 0.1,
1.0
max_iter
1000
-
Random Forest
n_estimators
50, 100,
200
max_depth
10, 15,
20
XGBoost
max_depth
3, 6,
9
eta
0.1,
0.3
num_boost_round
100
100
AdaBoost
n_estimators
50,
100
learning_rate
1.0,
0.5
max_depth
3,
5
Neural network architectures evaluated for ICU admission in stage 1 (binary classification).
Model
Model type
Architecture details
NN ICU-1
7-layer NN
[128, 64, 32, 64, 32, 16, 8], PReLU, Dropout 0.3
NN ICU-2
8-layer NN
[128, 256, 256, 128, 64, 64, 32, 16, 8], PReLU, Dropout 0.3
NN ICU-3
10-layer NN
[256, 512, 512, 256, 256, 128, 64, 32, 32, 16, 8], PReLU, Dropout 0.3
Confusion matrix for ICU admission model–stage 1.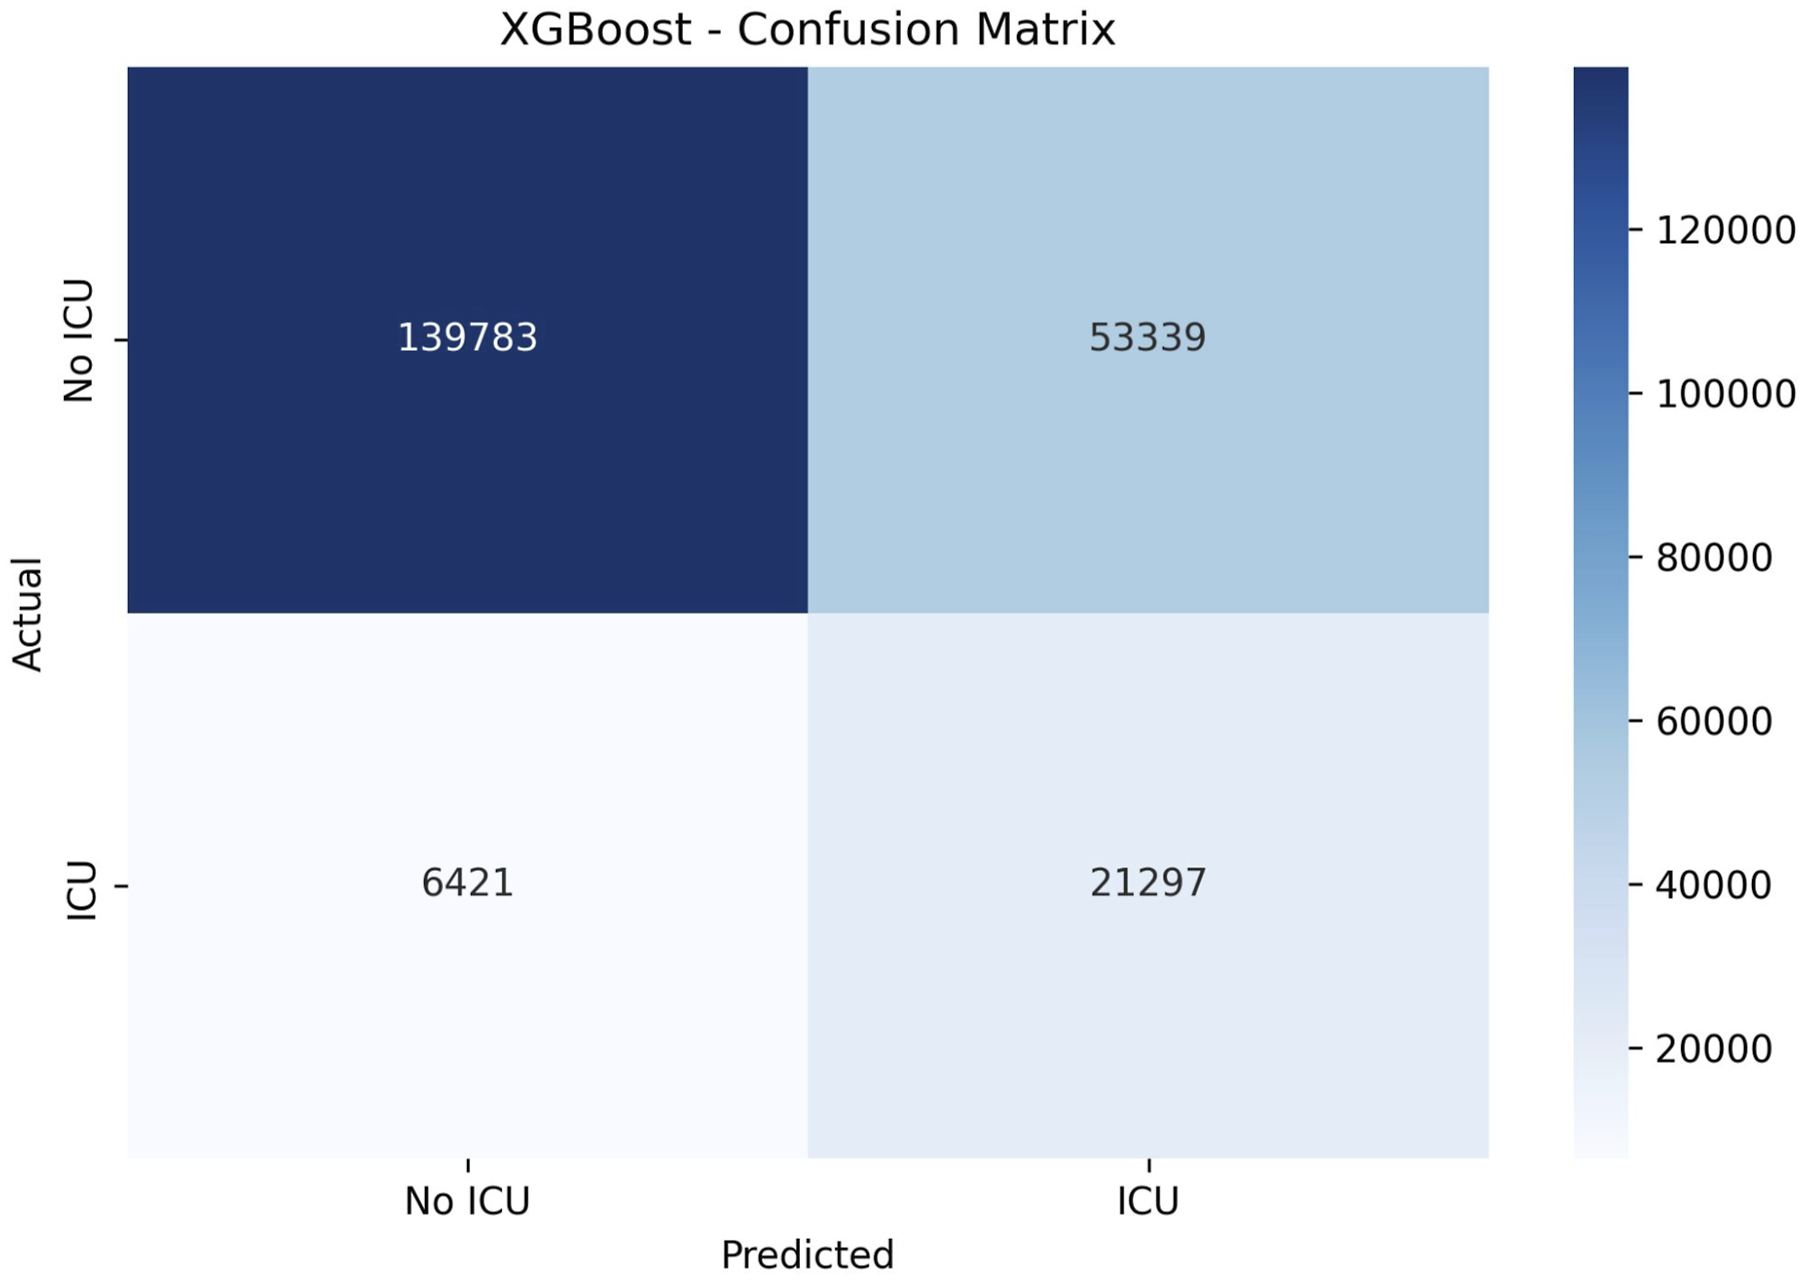
Calibration curve for ICU admission model–stage 1.
Hyperparameter configurations tested for stage 2 (ICU-LOS). Best configurations (marked with *) were selected.
Approach
Model
Hyperparameter
Values tested
Val. metric
Random Forest
n_estimators
100,
max_depth
10,
XGBoost
max_depth
3,
eta
0.1,
num_boost_round
AdaBoost
n_estimators
50,
learning_rate
0.5,
Gradient Boosting
n_estimators
100,
learning_rate
0.05,
max_depth
3,
Logistic Regression
C
Random Forest
n_estimators
100, 200,
max_depth
10, 15,
XGBoost
max_depth
3, 6,
eta
0.1,
num_boost_round
100,
AdaBoost
n_estimators
50, 100,
learning_rate
0.5,
Neural network architectures evaluated for days in ICU (DaysICU) prediction in stage 2: classification and regression.
Task
Model
Architecture details
NN ICU-LOS-C1
5-layer NN
[128, 128, 128, 64, 32], ReLU, Dropout 0.3, Softmax (3 classes)
NN ICU-LOS-C2
5-layer NN
[128, 128, 128, 64, 32], PReLU, Dropout 0.3, Softmax (3 classes)
NN ICU-LOS-C3
5-layer NN
[128, 256, 128, 64, 64], PReLU, Dropout 0.3, Softmax (3 classes)
NN ICU-LOS-R1
7-layer NN
[128, 128, 128, 128, 64, 64, 64], ReLU, Dropout 0.5
NN ICU-LOS-R2
9-layer NN
[128, 128, 256, 256, 128, 128, 64, 64, 64], ReLU, Dropout 0.5
NN ICU-LOS-R3
7-layer NN
[128, 128, 128, 128, 64, 64, 64], PReLU, Dropout 0.5
NN ICU-LOS-R4
5-layer NN
[128, 128, 64, 64, 32], PReLU, Dropout 0.5
ICU-LOS classification performance (stage 2). Results correspond to the best-performing configuration of each model based on macro AUC-ROC.
Logistic reg.
XGBoost
AdaBoost
Random forests
DICU-C1
DICU-C2
DICU-C3
Macro AUC-ROC
0.8109
0.8139
0.8169
0.7866
0.7921
0.7933
Overall Accuracy
0.6718
0.6789
0.6736
0.5769
0.6018
0.6188
Weighted F1-score
0.7565
0.7619
0.7584
0.6854
0.7045
0.7176
Class 1
Sensitivity
0.6874
0.6942
0.6895
0.7057
0.5819
0.6096
0.6287
Specificity
0.5964
0.5984
0.6018
0.6029
0.5499
0.4830
0.4574
Precision
0.9780
0.9783
0.9775
0.9760
0.9841
0.9830
0.9819
F1-Score
0.8074
0.8121
0.8087
0.8191
0.7313
0.7525
0.7666
Class 2
Sensitivity
0.4034
0.4695
0.4804
0.4556
0.5499
0.4830
0.4574
Specificity
0.9780
0.9783
0.9775
0.9760
0.9841
0.9830
0.9819
Precision
0.0850
0.0897
0.0873
0.0889
0.0715
0.0774
0.0800
F1-Score
0.1404
0.1507
0.1478
0.1488
0.1265
0.1335
0.1361
Class 3
Sensitivity
0.5964
0.5500
0.5137
0.5386
0.4929
0.5487
0.5619
Specificity
0.9780
0.9783
0.9775
0.9760
0.9841
0.9830
0.9819
Precision
0.1560
0.1731
0.1714
0.1802
0.1488
0.1321
0.1328
F1-Score
0.2472
0.2633
0.2570
0.2690
0.2286
0.2130
0.2148
Calibration belt for the best-performing ICU-LOS classification model–stage 2.
Confusion matrix for XGBoost ICU-LOS classification model–stage 2.
Confusion matrix for XGBoost total LOS classification model–stage 3.
Actual versus predicted ICU-LOS and residual plot for the XGBoost regression model–stage 2. The plots illustrate the skewed distribution of ICU-LOS and increasing prediction error for longer stays.
Hyperparameters tested for stage 3: total LOS prediction. Best configurations (marked with *) were selected based on MAE (regression) or AUC (classification).
Approach
Model
Hyperparameter
Values tested
Val. metric
Logistic Regression
C
0.01,
max_iter
1000
Random Forest
n_estimators
100,
max_depth
10,
min_samples_split
5
XGBoost
max_depth
3,
eta
0.1,
num_boost_round
AdaBoost
n_estimators
50, 100,
learning_rate
max_depth
3,
Ridge Regression
alpha
0.1, 1.0,
Random Forest
n_estimators
100, 200,
max_depth
10, 15,
min_samples_split
5
XGBoost
max_depth
3,
eta
0.1,
num_boost_round
AdaBoost
n_estimators
50, 100, 200
4.6811–6.5107 (MAE)
learning_rate
0.5, 1.0
Gradient Boosting
n_estimators
100,
learning_rate
0.05, 0.1
max_depth
3,
Neural network architectures evaluated for hospital length of stay (LOS) prediction in stage 3: classification and regression.
Task
Model
Architecture details
NN LOS-C1
9-layer NN
[128, 256, 256, 128, 64, 64, 32, 16, 8], PReLU, Dropout 0.5, Softmax (3 classes)
NN LOS-C2
6-layer NN
[128, 256, 256, 128, 64, 32], PReLU, Dropout 0.5, Softmax (3 classes)
NN LOS-C3
8-layer NN
[128, 128, 256, 256, 128, 128, 64, 64], PReLU, Dropout 0.5, Softmax (3 classes)
NN LOS-R1
3-layer NN
[128, 64, 32], PReLU, Dropout 0.5
NN LOS-R2
7-layer NN
[128, 256, 512, 256, 128, 64, 64], PReLU, Dropout 0.5
NN LOS-R3
9-layer NN
[128, 256, 128, 256, 128, 64, 128, 64, 32], PReLU, Dropout 0.5
Calibration curves for XGBoost LOS classification model in stage 3. The dashed diagonal represents perfect calibration. Brier scores are shown for each class.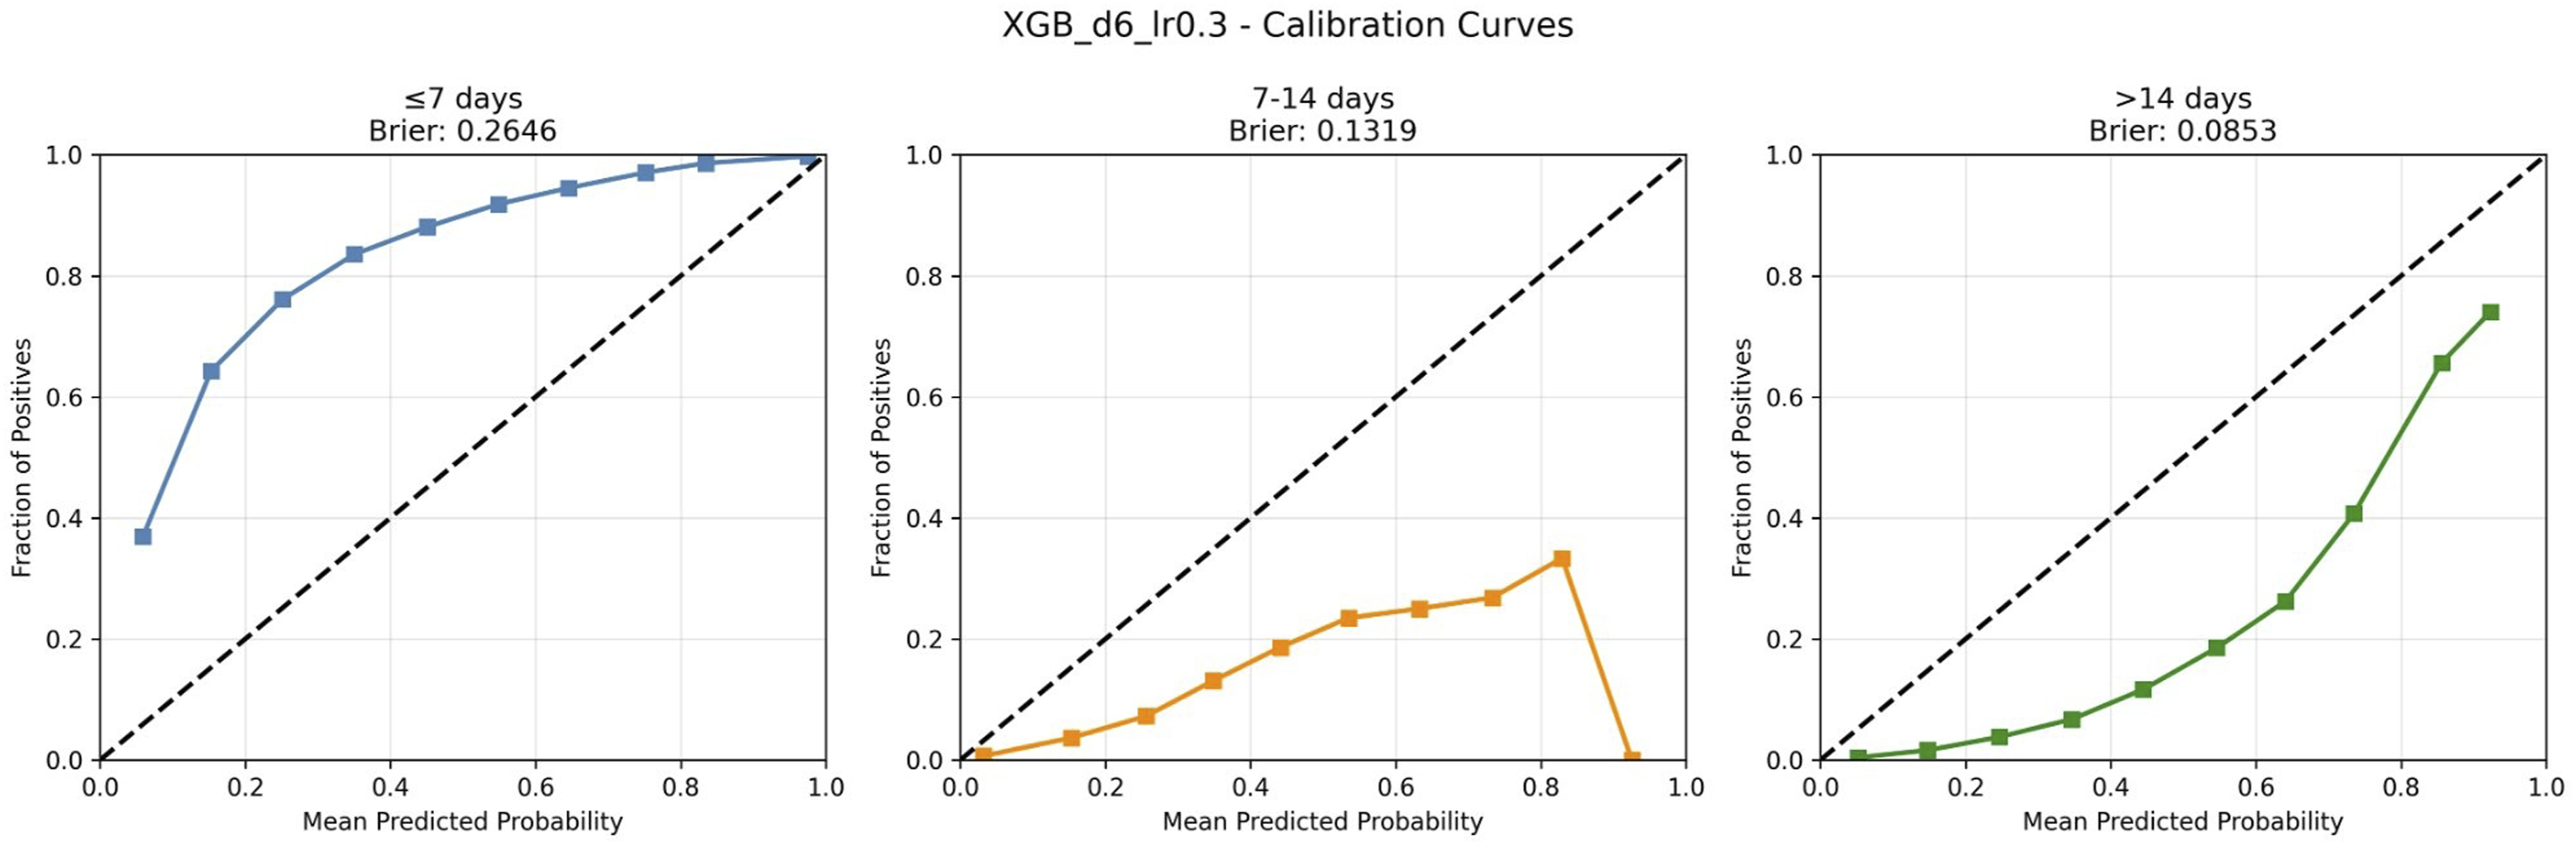
Actual versus predicted total LOS and residual plot for the XGBoost regression model–stage 3.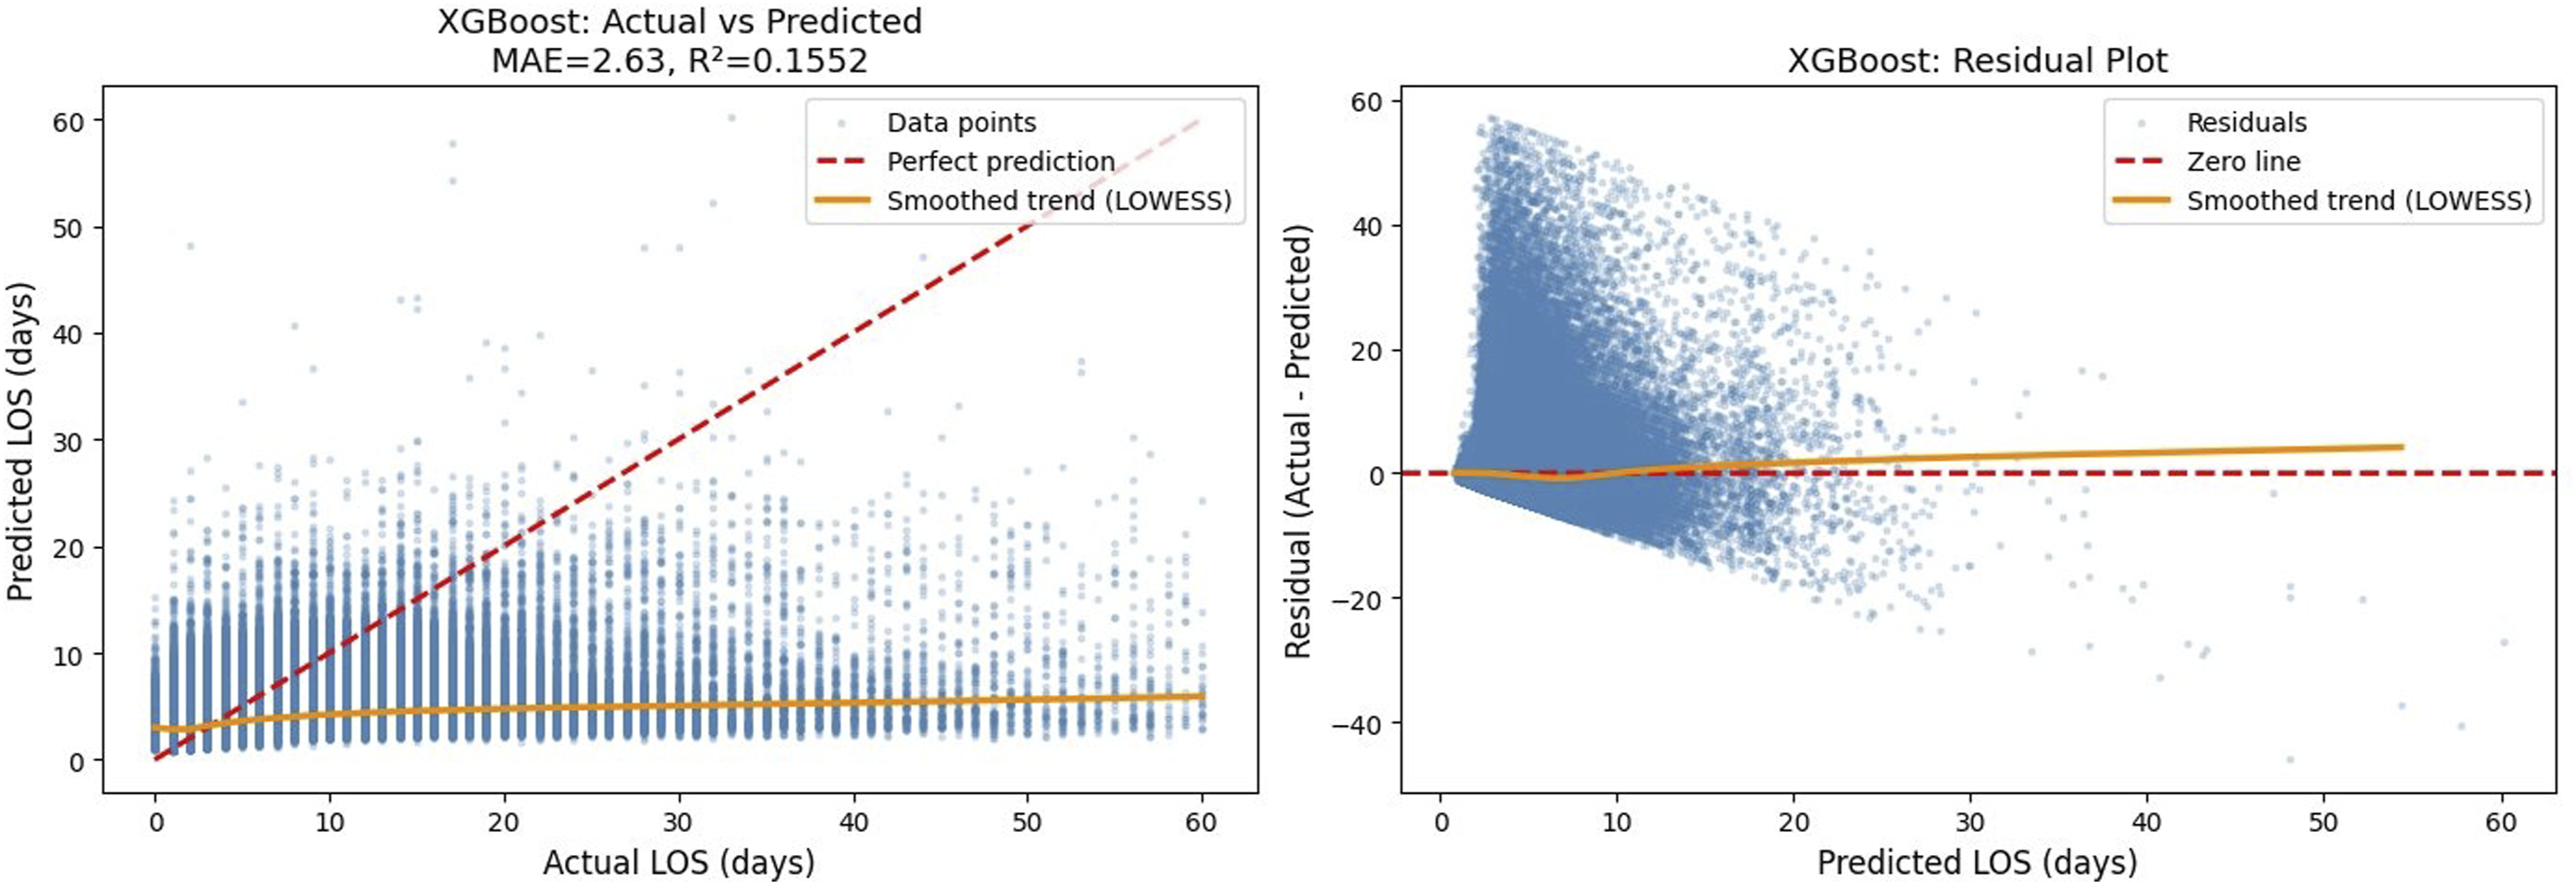
Table 15 presents the top features ranked by XGBoost gain and SHAP importance for the final LOS classification model. XGBoost gain measures the average improvement in loss function when a feature is used for splitting, while SHAP values quantify each feature’s average contribution to individual predictions. The predicted ICU admission status (ICU
p
) ranks 2nd by gain and 8th by SHAP, whereas predicted ICU duration (DaysICU
p
) ranks 21st by gain but 6th by SHAP. This difference reflects that (ICU
p
) provides large information gain when used, while DaysICU
p
contributes more consistently across predictions. Both predicted features rank among the top 10 by SHAP importance, alongside established clinical predictors such as AGE, confirming their meaningful contribution to LOS prediction. Top features by XGBoost gain and SHAP importance in stage 3.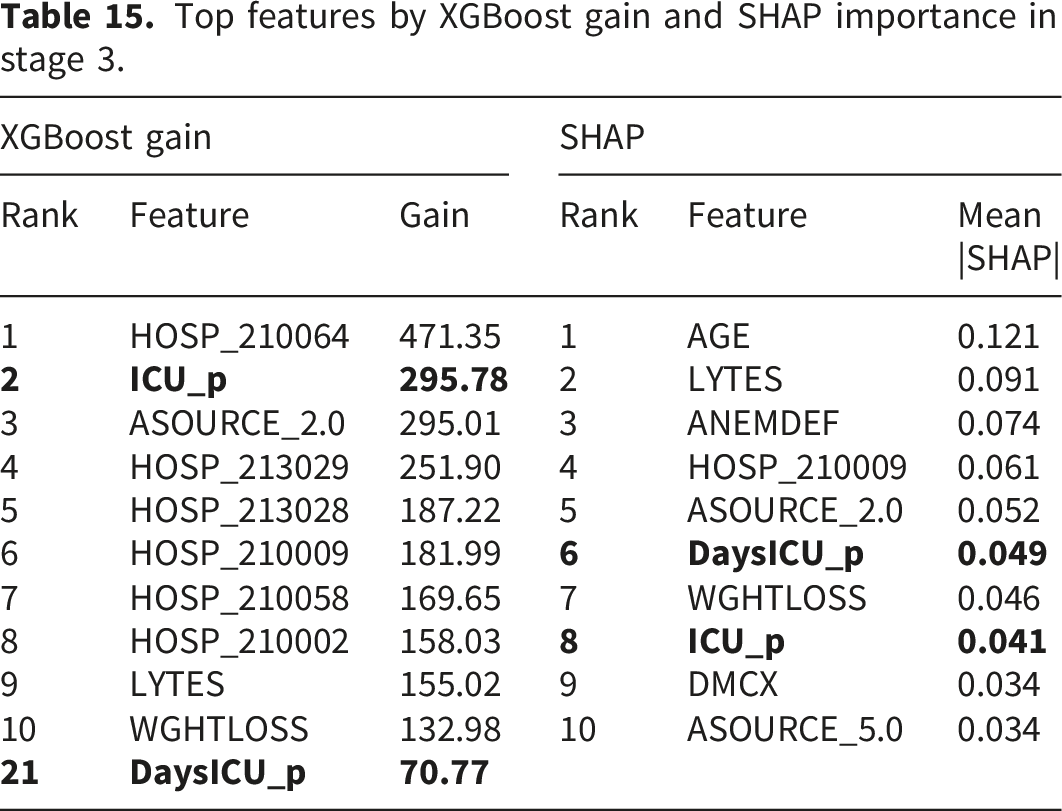
XGBoost gain
SHAP
Rank
Feature
Gain
Rank
Feature
Mean |SHAP|
1
HOSP_210064
471.35
1
AGE
0.121
2
LYTES
0.091
3
ASOURCE_2.0
295.01
3
ANEMDEF
0.074
4
HOSP_213029
251.90
4
HOSP_210009
0.061
5
HOSP_213028
187.22
5
ASOURCE_2.0
0.052
6
HOSP_210009
181.99
7
HOSP_210058
169.65
7
WGHTLOSS
0.046
8
HOSP_210002
158.03
9
LYTES
155.02
9
DMCX
0.034
10
WGHTLOSS
132.98
10
ASOURCE_5.0
0.034
References
Supplementary Material
Please find the following supplemental material available below.
For Open Access articles published under a Creative Commons License, all supplemental material carries the same license as the article it is associated with.
For non-Open Access articles published, all supplemental material carries a non-exclusive license, and permission requests for re-use of supplemental material or any part of supplemental material shall be sent directly to the copyright owner as specified in the copyright notice associated with the article.