
Abstract
The impact of infectious disease on human populations is a function of many factors including environmental conditions, vector dynamics, transmission mechanics, social and cultural behaviors, and public policy. A comprehensive framework for disease management must fully connect the complete disease lifecycle, including emergence from reservoir populations, zoonotic vector transmission, and impact on human societies. The Framework for Infectious Disease Analysis is a software environment and conceptual architecture for data integration, situational awareness, visualization, prediction, and intervention assessment. Framework for Infectious Disease Analysis automatically collects biosurveillance data using natural language processing, integrates structured and unstructured data from multiple sources, applies advanced machine learning, and uses multi-modeling for analyzing disease dynamics and testing interventions in complex, heterogeneous populations. In the illustrative case studies, natural language processing from social media, news feeds, and websites was used for information extraction, biosurveillance, and situation awareness. Classification machine learning algorithms (support vector machines, random forests, and boosting) were used for disease predictions.
Keywords
Introduction
Infectious diseases present a constantly changing threat to public health.1–4 Timely and reliable estimates of infectious disease emergence, including location, timing, and intensity, would prove very useful in proactive disease management.5–7 Infectious disease response programs are often hindered by disconnected datasets and stove-piped analyses. Problem areas include incomplete data, faulty situational awareness, ignorance of causal factors, widespread misunderstanding of infection mechanisms, and lack of insight on effective interventions.8–11 Effective disease-management activities benefit greatly from accurate assessment and prediction of disease outbreaks. Timely assessment facilitates effective coordination and mobilization of medical, human, and pharmaceutical resources. The incorporation of knowledge concerning disease emergence history, endemic strains, environmental conditions, wildlife populations, land use policies, human habitation and culture, local health infrastructure, and so forth can play a key role in identifying areas where diseases are most likely to emerge. Framework for Infectious Disease Analysis (FIDA) is a comprehensive and integrated framework supporting analysis and information sharing across the complete disease lifecycle—pre-emergence conditions, emergence, spread, and eventual disease aftermath. It provides a conceptual framework for the modelers to breakdown the different issues in disease management, address the sub-problems with suitable modeling approaches, identify the dependencies between the models in terms of parameter associations, and maintain the consistency and validity across different models. From the perspective of the analyst, FIDA supports identification of factors affecting emergence, prediction of epi curves, trajectory of disease progression, spread of disease, and the effectiveness of interventions and prophylaxis measures.
Key to our approach is the observation that disease management is a complex process, requiring different analysis support in different stages. Any single modeling approach, such as system dynamics or compartmental modeling, will not be ideal for analyzing different issues in different stages of disease lifecycle. Instead of using a single modeling approach, we are developing a suite of infectious disease models addressing the full spectrum of analysis requirements (Figure 1 and Table 1).
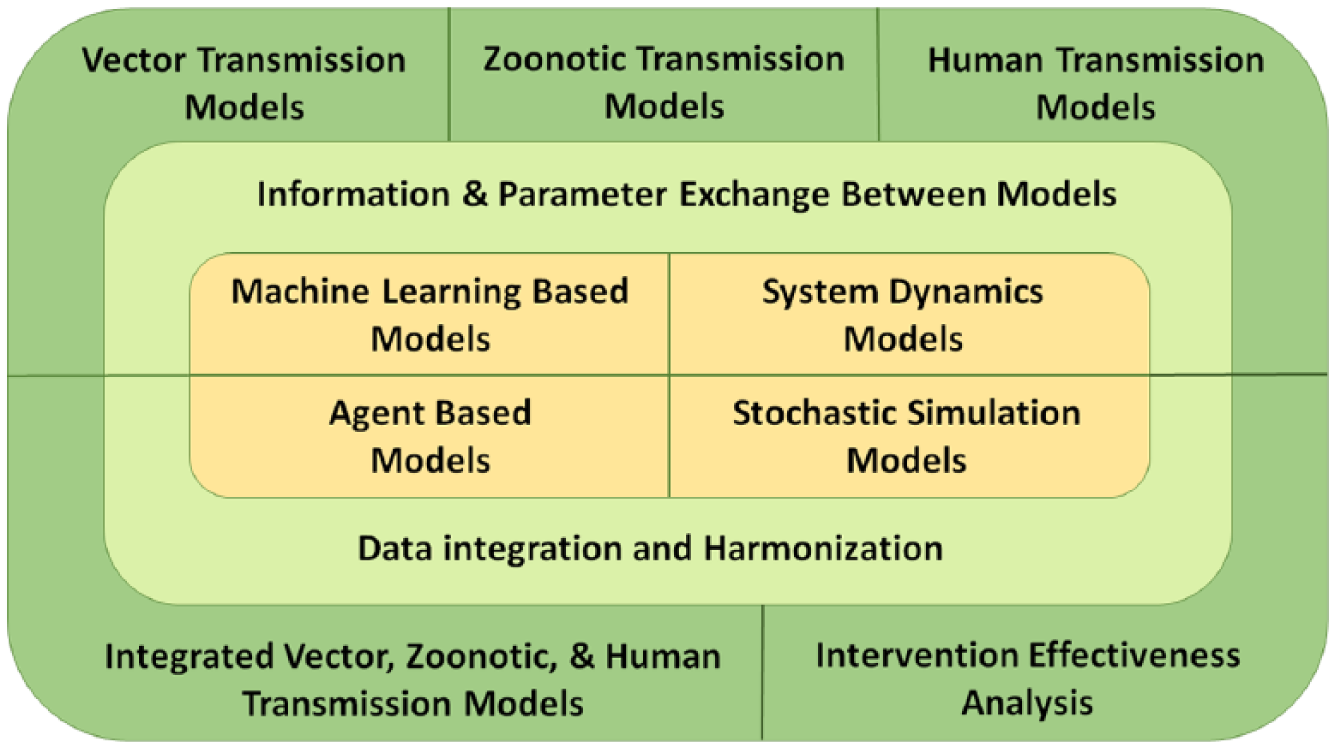
Concept of operation of FIDA.
FIDA modeling techniques.
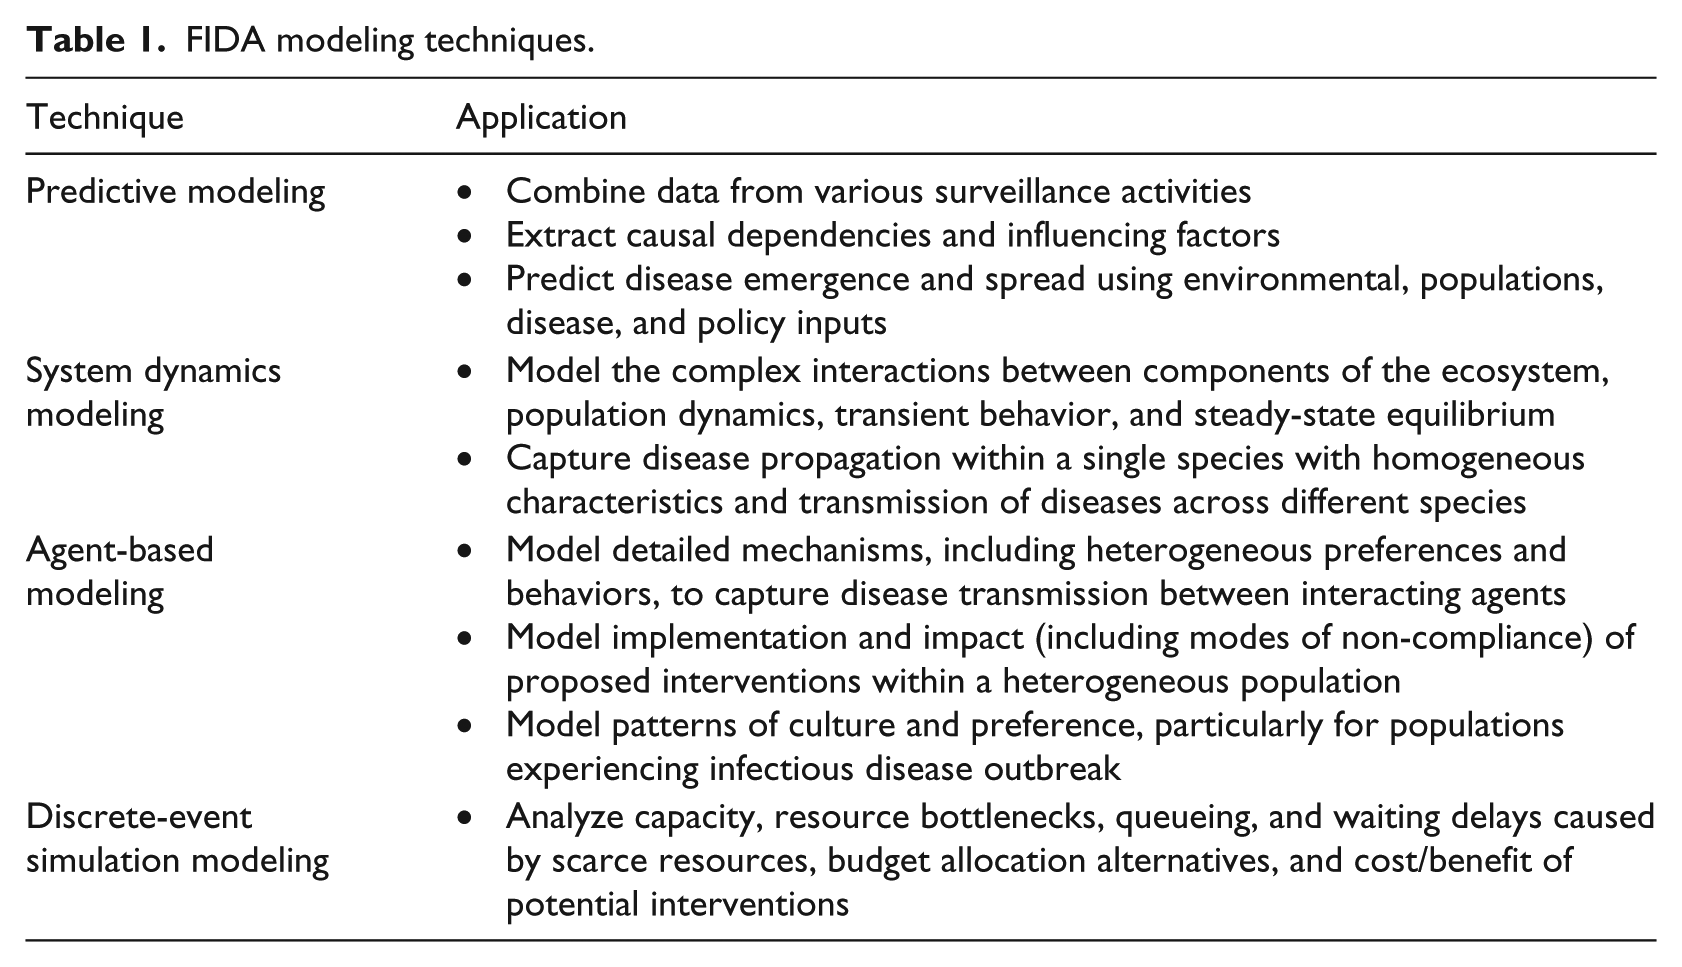
Table 1 summarizes the different modeling approaches adopted in FIDA and their role in the disease modeling and analysis. Researchers have been working on the individual sub-problems in the disease lifecycle. For example, agent-based models were developed for modeling dynamics of communicable diseases (such as influenza) within human population incorporating human-to-human interactions and geographic distributions.12–18 These models parametrize transmission probabilities between different contact groups, number of daily contacts, lengths of latent and infectious periods, and evaluate interventions by adjusting the value of these parameters. System dynamics models are more prevalent in the modeling of vector-borne diseases such as malaria, dengue, and chikungunya. Based on the early works developed to understand malaria transmission by Ross19,20 and Macdonald,21,22 system dynamics models for mosquito-transmitted pathogens model the numbers of susceptible, exposed, and infected mosquitoes and humans. System dynamics models were also developed to model the individual stages of the mosquito lifecycle, including stages of aquatic development and adult behaviors.23–29 Rates of movement to and from compartments is addressed through the use of parameters for development, mortality, births, transmission probabilities, and the interaction with humans. Further enhancements to malaria and West Nile virus models have been made to include reservoir species of birds.30–33 These models incorporate the factors that impact the size of a mosquito population in relation to the environmental conditions by making homogeneous assumptions. This assumption can limit the high-fidelity modeling of the human population due to the heterogeneous nature of humans. Agent-based approaches, such as those taken by the Epidemiological Modeling Software (EMOD) 34 model, address this issue by modeling both the human and mosquito populations as individual agents. Intervention effectiveness analysis to mitigate disease spread is represented in these models by modifying parameters to reduce numbers of mosquitoes, mosquito interaction with humans, and probability of disease transmission.
While the existing models serve a very useful purpose, it is up to the modelers to research and use the relevant parameters in their models. Our hypothesis is that model development can be greatly facilitated by sharing not only data but also model artifacts in terms of parameter estimations. For example, vector population levels and infection rates from zoonotic system dynamics models can be very useful input parameters in human-to-human transmission models. Similarly, the predicted disease intensity and timing from human disease prediction models35,65 can be useful input parameters in the intervention effectiveness analysis models. Currently, such boundary conditions and contextual information are implicitly hidden in the parametric assumptions of individual models and it is up to the modeler to use appropriate values for parameters based on the results obtained by other researchers. By developing a framework for integrated multi-modeling approach, and developing communication and consistency checks between concepts, inputs, and outputs across different models, we plan to facilitate logical consistency and model validity across different models. To our knowledge, this approach is unique and is one of the key contributions of this effort.
FIDA is a work in progress with a visionary scope and a long-horizon implementation plan. FIDA uses a multi-modeling approach to support different analysis requirements present throughout the progression of a disease from a reservoir population, to transmission vectors, to the infection of people, and the spread of the disease throughout a population. The analysis and modeling techniques currently supported in FIDA are shown in Table 1.
Key innovations of FIDA are as follows:
Comprehensive data collection and integration facilitating holistic epidemiological analysis. For example, FIDA allows the analyst to integrate environmental conditions, migratory bird tracking, confined animal feeding operations, and the location of human populations to determine at-risk areas for different influenzas. FIDA automates the data collection and aggregation process by leveraging innovative biosurveillance techniques.
FIDA provides an architecture for epidemiologists to breakup disease management into sub-problems and solve the sub-problems with appropriate modeling approaches. FIDA supports this by facilitating information sharing through parameters across different models. This not only ensures consistent analyses across different disease stages but also enables leveraging of insights gained in each stage of a disease management in subsequent stages. For example, parameters extracted from system-dynamics models are used as inputs to agent-based models. The trajectory of predicted disease epi curves are input to discrete-event simulation models to estimate the effectiveness of prophylaxis responses.
The features of the framework are illustrated with multiple case studies. Natural language processing (NLP) from social media (Twitter), news feeds, and websites was used for information extraction, biosurveillance, and situation awareness. Historical Influenza-Like Illness (ILI) data were collected from Centers for Disease Control Prevention (CDC), 36 environmental data were collected from National Oceanic Atmospheric Administration (NOAA), 37 and ILI-related twitter signal was collected from HealthTweets.org. 38 ILI forecasting was developed using classification machine learning algorithms (support vector machines (SVMs), random forests, and boosting).
To understand the basic structure and interactions between people, animals, and diseases, many conceptual frameworks have been proposed, capturing various aspects of the disease spread and detection process. Multiple frameworks using multivariate techniques have been proposed for deriving transmission parameters, understanding the origins of novel infectious diseases, detecting widespread disease in human and animal populations, and the testing of intervention techniques.39–46 These existing conceptual frameworks have been added to the overall understanding of disease dynamics, but lack the comprehensive system implementation that our solution addresses. The work presented in this article is a seminal contribution to realization of framework to support comprehensive disease lifecycle analysis and management.
Several approaches have been explored in the area of predicting infectious diseases in both humans and animals. From the use of mathematical contact networks and simulation, to forecasting trends according to Internet searches and Twitter posting, detection algorithms have been evaluated by matching historical data through the use of numerical optimization techniques.47–54 While the approaches used in the previous work have been able to capture real-time data and forecast predictions for the spread of disease, our methods differ in the extraction of rich set of features to capture the disease pattern and trends and in using the extracted features in machine learning–based predictions. The features extracted are presented in “Methods and materials” section and model performance in the “Results” section.
NLP has been a critical aspect in the processing and filtering of massive amounts of publicly accessible information available online. Advanced text mining techniques allow for the detection of trends within a geographic area based on a wide array of phrases and structures.55–60 We have used text mining in our application to extract syndromic surveillance data from social-media content. We fused the sign and symptom trends extracted from social media with disease surveillance based on news feeds and medical publications to provide integrated situation awareness. These details are presented in the “Methods and material” section.
Methods and materials
Social media, news feeds, and medical reports–based situation awareness
One of the challenges of extracting health-related information from text is the disparate sources of data, ranging from news articles, medical reports, RSS feeds and the more recent source of data: social-media sites such as Twitter®, Facebook®, and blogs. The widespread adoption of social media provides a means for communication previously unavailable to large segments of the world’s population. Around 230 million tweets are posted daily and the number of Twitter users is estimated to be 100 million. Twitter data are very noisy and contextual, and the language constructs are very different from traditional language patterns. This section presents our approach to processing social-media data and extracting health-related information from social media, news feeds, and medical publications for health situation awareness.
FIDA has software agents that can be configured to monitor information sources such as news feeds and medical publications on a daily basis. Currently, the Biosurveillance tool monitors and downloads data from 15 sources including ProMED Mail, World Health Organization (WHO), BBC Health News, CDC Morbidity and Mortality Weekly Reports, The Lancet Infectious Diseases, and BMC Infectious Diseases. HTML files are downloaded from these sites, and text is then extracted from these HTML files, converted to an XML format, and then processed by an NLP pipeline to extract the relevant information.
Figure 2 shows the process used to extract information from text sources. The first part of the process, shown in the green/top box, uses our in-house NLP pipeline. The steps involved in this initial part of the process are sentence boundary detection, tokenization, part-of-speech tagging, phrase chunking, subject–verb–object (SVO) assignment, clause segmentation, and, finally, named entity recognition. The first four steps internally use OpenNLP (http://incubator.apache.org/opennlp/), while the SVO assignment, clause segmentation, and named entity recognition modules have been developed in-house. The SVO and Clause assignment stage involves splitting the sentence into clauses and finding SVOs in the sentence.
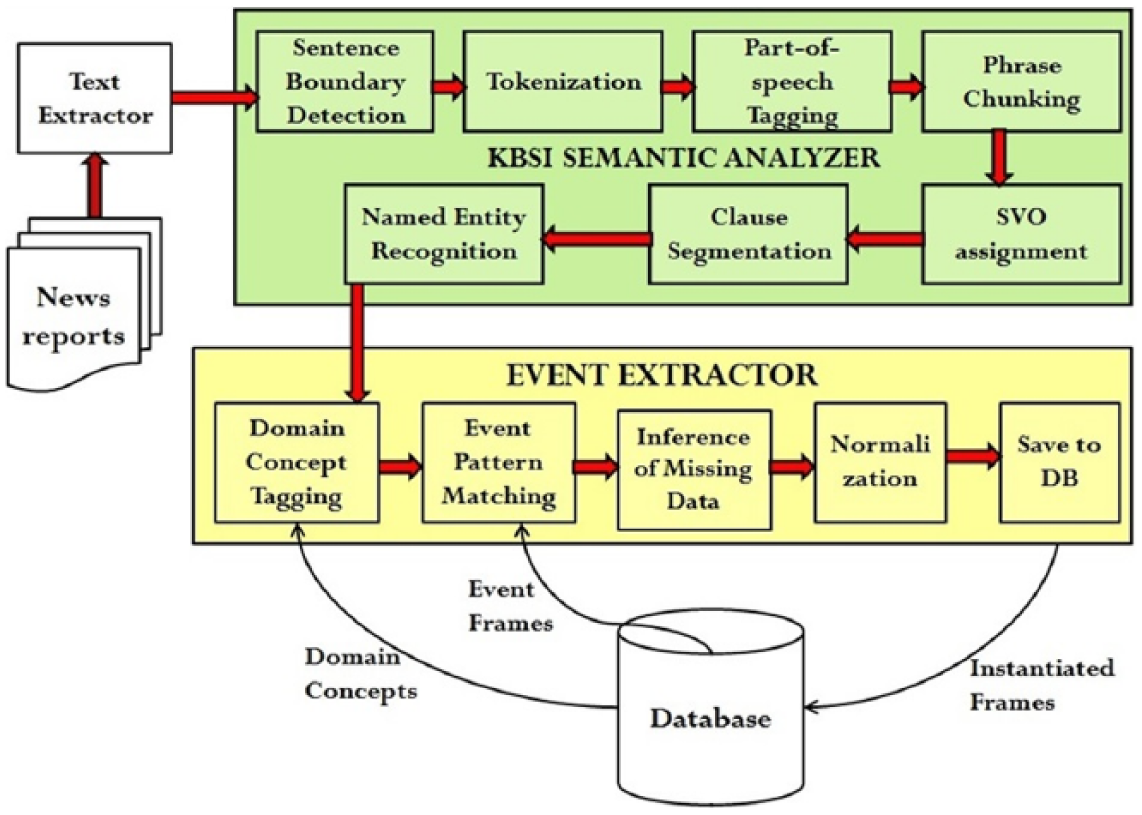
FIDA biosurveillance information extraction pipeline.
The main objective of the initial stages of text processing is to identify and classify the phrases that may be constituents of event patterns. The steps shown in the green/top box are mostly domain-independent. The named entity recognition module recognizes generic named entities such as Persons, Locations, and Organizations. However, the processes shown in the yellow/bottom box in Figure 1 are components that are domain-specific. The four components required are the domain concept tagger, event pattern matcher, inference of missing data, and data normalization. The details of these modules as well as the results obtained with respect to detection of 2009–2010 Haiti cholera outbreak, multiple salmonella in the United States, and 2016 Zika outbreak are presented in Erraguntla and colleagues.61,62
Issues with Twitter data
Dealing with Twitter data is challenging because of the sheer volume of tweets being posted and the Twitter-specific lingo that is extensively used to overcome the 140 character limitation. In addition to the size of the data, the content of the data is complex. The identities of the persons (entities) involved in a community and their location are often hidden or anonymous, sometimes deliberately so. Social media are “reshaping human language” through the use of tags, idioms, symbols, acronyms, and so on. Besides being voluminous, Twitter data are extremely noisy too and contains a lot of duplication through the phenomenon of retweets. The other issue when dealing with social-media data is the difficulty in establishing its trust and reliability. These issues place new burdens on existing natural language-processing techniques. Sifting for nuggets of relevant and actionable knowledge from highly unstructured social-media data and recognizing the fast evolving situations affording limited lag-time for response and mitigation become very challenging.
Dealing with noise
One way to deal with the volume issue of Twitter data is to filter the tweets intelligently. Tweets could be filtered based on a set of key terms or hashtags for each specific theme being tracked. Retweets could be filtered out to avoid duplicates.
Ontologies lend themselves well to unifying different views of the world. A unified disaster-related ontology would include sub-ontologies from the government, states, local cities, weather watch agencies, and so on. It would include concepts such as disasters, hazards, infrastructure, geographical data, and data from weather watch agencies. Ontologies also enforce consistency and uniformity, thereby encouraging knowledge sharing and reuse. Leveraging ontologies as the means to model and record domain-specific terms, patterns, and relationships that could govern the filtering criteria of the Twitter stream could prove to be very useful. Ontological Semantic Resource ontology (OSR) was used for knowledge contextualization since events such as DISASTER-EVENT and POLITICAL-EVENT have already been modeled in OSR. 63
The OSR contains 27,329 lexical items. Each lexical item has one or more senses; lexical items typically have four or five senses. Each sense defines a meaning. For example, the lexical item (called a lexeme) “Attack” would have meanings that correspond to the ontological events ATTACK, CONFRONT, METHOD, and ASSAULT. Each word sense is associated with a concept in the ontology. For example, concepts for the lexical item “attack” are ASSAULT, FIGHT, CONFRONT, and METHOD. The process of selecting a particular meaning for a lexical item is called “disambiguation.” In the disambiguation process for the lexical item “attack,” the FIDA NLP processor attempts to fill in the case-roles for each of the verbal word senses. Thus, for example, in situations where “attack” is used as a verb, the subject and direct-object slots were attempted to be filled with lexemes matching the object types listed in the ontology for that particular word sense. The OSR is used as the baseline ontology for ontology-driven information filtering and semantic disambiguation activities.
The other approach investigated is a customization of the existing KBSI event extraction framework to work with poorly structured text. For example, consider the highly structured pattern shown in the following: Noun Phrase SEGMENT (person | animal) + PP SEGMENT? + Verb Phrase SEGMENT(become sick|fall sick|fall ill|suffer|treat|hospitalize|admit|contract|die|contaminate|Diagnose|infect) + Prepositional Phrase SEGMENT(disease | symptom)
This would work efficiently for well-structured sentences that are available in text obtained from news articles and would match a sentence like “Several people in that area have become sick with possible E. coli symptoms.” To make this pattern work for tweets, it would need to be “relaxed” since many elements in the above pattern would just not be present in the short Twitter text. The following pattern would work better in this case: Verb Phrase SEGMENT (sick| sick|ill|suffer|treat|hospitalize|admit|contract|die|contaminate|Diagnose|infect|kill) + Prepositional Phrase SEGMENT(disease|symptom)
This highly relaxed pattern would match the following tweets, for example, “dying with flu ☹” and “at home sick with food poisoning, damn!”. Language patterns were developed to extract disease related information from twitter data.
Dealing with Twitter-specific lingo
The Twitter-specific lingo is used very extensively in most of the messages to overcome the 140 character limitation. This could cause an NLP pipeline to perform poorly since the text being fed to it would not be well-formed English sentences. To mitigate that issue, the messages could be pre-processed using a Twitter dictionary to replace Twitter abbreviations and jargons with regular English words. 64 For example, “b/c,” which is short for “because,” would get replaced in all the messages.
Dealing with missing location
The other issue when processing Twitter data is the lack of location information in many tweets. Out of a sample of 10,000 tweets, over 20 percent did not have a location. Even among the 80 percent of tweets that did not have an empty location, many had fake locations like “Away from here,” “Awesomeland,” and “Everywhere.” Many tweets had incomplete addresses like “304 east street” or “405 Oklahoma.” Sometimes, the location would be provided as latitude longitude and sometimes only the city or state name would be provided.
There are two ways to deal with tweets that have an empty or invalid location. One is to try to extract the location if mentioned in the tweet itself. The next approach could be to collect location information for those tweets from the user’s default location. While registering for Twitter, many users provide a default location. With the user object available in the tweets, the default location could be collected in all the tweets.
Application of this technology for social media, news feed, and medical reports–based syndromic surveillance and situation awareness is presented in the “Results” section.
Machine learning prognostics–based influenza prediction
Influenza-Like-Illness was selected as the focus application to demonstrate FIDA machine learning–based prognostic (MLP) approach and capabilities. 65 Historical ILI data were provided by CDC through the FluView website. 36 The data consisted of the percentage of patients visiting medical care facilities with ILI in the United States. Data are available from 1997, with the caveat that data prior to 2002 have missing off-season weeks. Data are provided for 10 regions, as defined by the US Department of Health and Human Sciences (HHS) and at the national level. Percentages of lab specimens that tested positive for virus types A and B, and vaccination rates in various HHS regions are also provided. The goal of the ILI prediction effort was to predict the future ILI epi curve based on current and historical data. Specifically, 1-, 2-, 3-, and 4-week look-ahead predictions, season start time prediction (season start is defined when the ILI values are above threshold for three consecutive weeks), and peak ILI value and timing were predicted.
As part of data collection and integration, environmental data from the Global Historical Climatology Network (GHCN) were included in the analysis. This dataset includes recorded data from weather stations across the United States. Data about minimum and maximum temperatures, snowfall, snow depth, precipitation, and pan evaporation (which is a measure of relative humidity and temperature) on a daily level are available in this dataset. As part of data cleaning and transformation, the environmental data were aggregated to HHS regions and the national level, and average minimum and maximum temperatures, average precipitation, average snowfall, and average pan evaporation were calculated. These environmental variables were analyzed for potential influence of ILI levels and trend.
The social-media data were extracted from the HealthTweets research performed by Johns Hopkins Social Media and Research Group. 38 These data are available for the flu years 2012–2014 and give the normalized number of tweets related to influenza each week. Normalization was performed based on the total number of tweets in that location. The signal generated from the tweet data related to ILI was included in the prediction model to explore whether it provides a leading indicator for future flu intensity.
In addition to the directly available ILI data, a number of derived variables were created for inclusion in the prediction model. These variables were created to extract the pattern of ILI, introduce nonlinearity, and account for the time series nature of the data. The derived variables included the percentage of change of ILI in the prior two weeks and in the prior three weeks; cumulative ILI prevalence for the season, prior four weeks and prior eight weeks; the ratio of specimens that were positive for strains A and B; the square and cube of ILI, the square and cube of cumulative ILI, the inverse of ILI (this is relevant for season and peak timing predictions); the number of consecutive ILI increases; and the number of increases above a threshold value. Extraction of features that capture the status and pattern of disease trajectory is an important innovation of the approach presented in this article and resulted in improved predictive model performance.
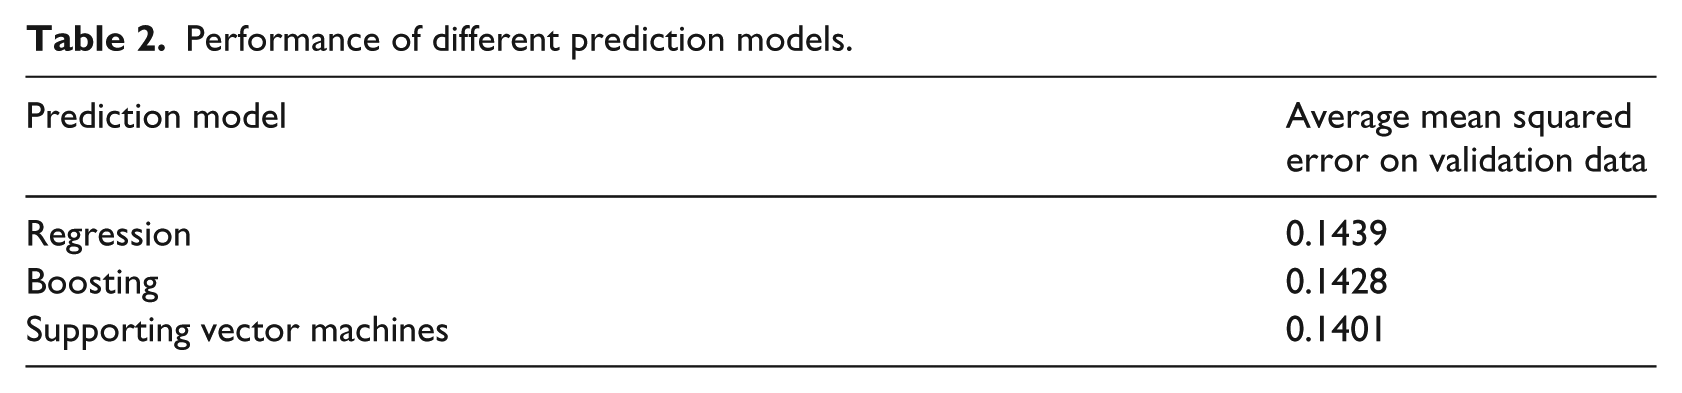
The rich set of historical ILI, environmental, social-media data, and extracted features was used to develop a machine learning–based prediction model. Linear regression (with nonlinear and interaction terms), decision tree–based boosting, and SVM-based machine learning models for prediction were developed. Models were developed on the basis of 10 years of data (2002–2011) and validated on 3 years of data (2012–2014). Model performance was evaluated only on validation data. Variables that had less than significant influence on prediction were excluded from the final model. All of the predictive models performed similarly, with SVM having a slightly better performance (see Table 2). As such, SVM was chosen as the preferred predictive model to focus the model development effort. Predictions developed based on the SVM-based machine learning model are presented in the “Results” section.
Performance of different prediction models.
Results
Case study of syndromic surveillance and situation awareness
Campylobacter outbreak in Pennsylvania in January/February of 2012 was used to test and validate the approach for syndromic surveillance based on social-media data.
Campylobacteriosis is an infectious disease caused by bacteria of the genus Campylobacter. Most people who become ill with campylobacteriosis get diarrhea, cramping, abdominal pain, and fever within two to five days after exposure to the organism. The diarrhea may be bloody and can be accompanied by nausea and vomiting. The illness typically lasts one week.
66
There was an outbreak of Campylobacteriosis in PA, MD, NJ, and WV in 2012 due to contamination of unprocessed milk (Figure 3). This was selected as a test case because it was a major outbreak in the United States that coincided with social-media data collection period in this study. Social-media data were collected and archived from 15 January 2012. As a result, enough data points to cover the Campylobacter outbreak as well as data points before and after the outbreak were available to be used as cross-validation to test the model performance.
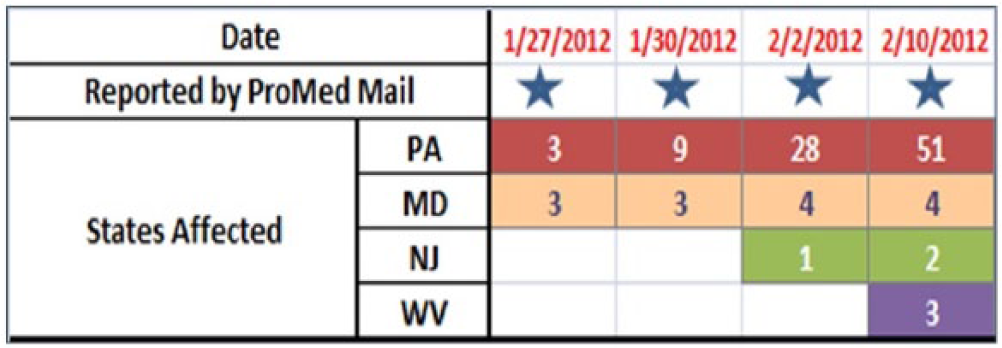
Progression of Campylobacter outbreak in the United States in January and February of 2012.
Signs and symptoms described by CDC, as well as the disease name, were used to search news feeds and tweets. Evidence of Campylobacter in both news feeds and social media was discovered (Figure 4). It is interesting to observe that social-media sources picked up the Campylobacter signals ahead of the published news sources (Figure 4).
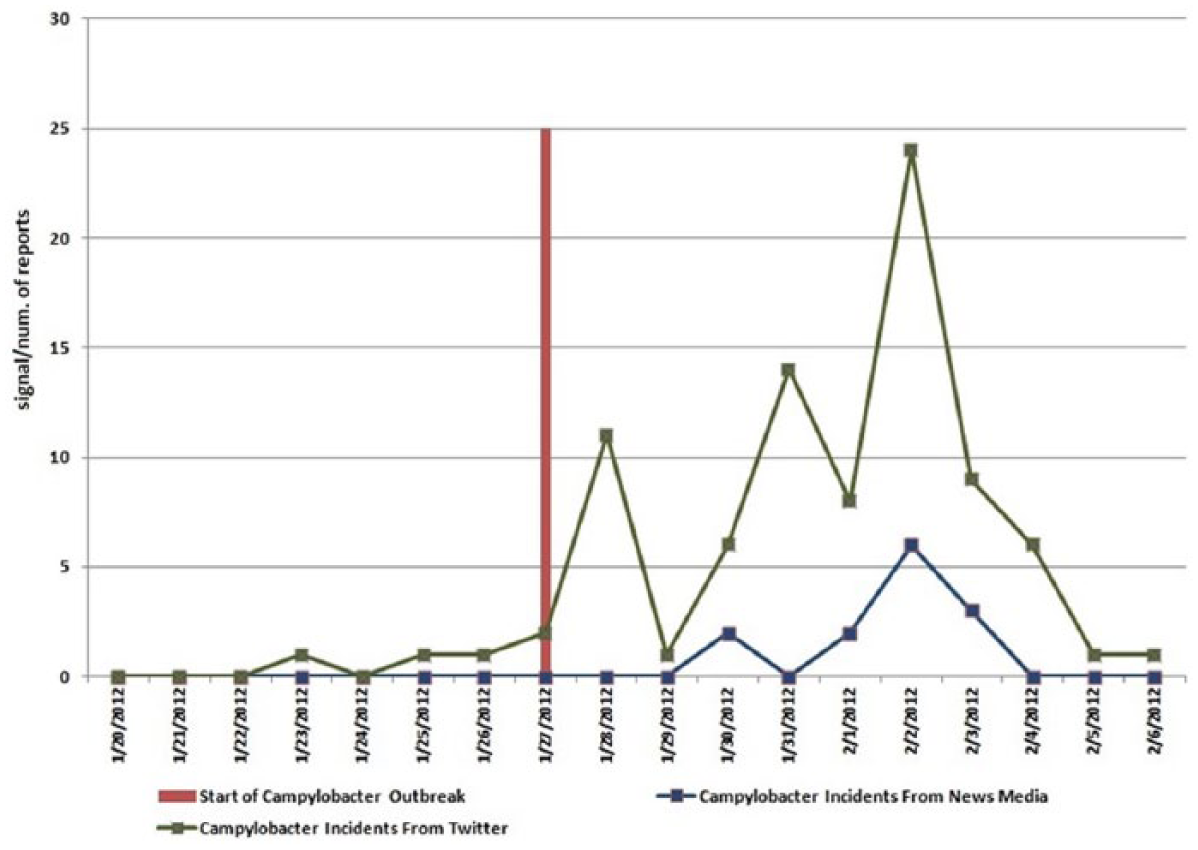
Campylobacter signal in news feeds and social media.
In this approach, “count of tweets” was used as a metric to detect unusual tweets related to highly specific syndromes (associated with Campylobacter). While effective as illustrated in this case study (Figure 4), social-media data are found to be noisy, especially with respect to signs and symptoms. When performing signs- and symptoms-based analysis, the FIDA outbreak detection identified correctly the outbreak of the disease in PA, MD, NJ, and WV. But some states like Nevada and Nebraska, which did not have the Campylobacter outbreak, also exhibited the signal at signs and symptoms level. This could be related to location uncertainty associated with some tweets or inherent noisiness in twitter data. Due to these considerations, social media–based signal is not used as data source for outbreak detection in FIDA, but is used to supplement situational awareness for events detected through more reliable data sources like news feeds, medical publications, and health websites.67,68
An alternate data point to extract from social-media sources is relative ratio (number of tweets associated with focus concepts and syndromes/total number of tweets in that region). This metric has the advantage that the metric is normalized for population count, might be more appropriate to extract relatively significant concepts, and is used by organizations processing social-media signals such as HealthTweets. 38 For example, for extracting tweets associated with ILI that typically affects more number of people, it might be more effective to extract relative ratio rather than the absolute count of tweets. This approach is adopted in the ILI case study (next section), but even in this case study, the predictive accuracy did not improve with inclusion of social-media signal (Figures 4 and 5). Smoothing techniques will be used in future efforts to improve the predictive accuracy, but the results presented in this article illustrate the noise inherent in the social media–based signal. In the case of relative ratio, significant geopolitical events or popular “trending” topics can affect the denominator and introduce noise into the signal.
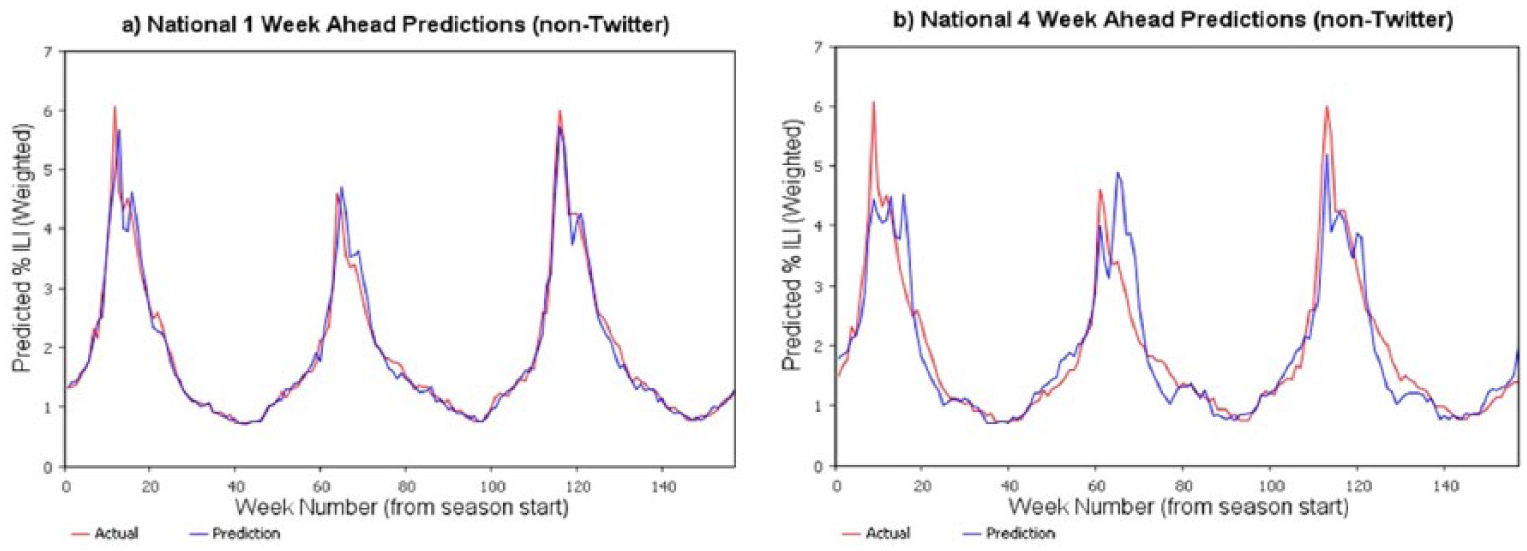
National-level ILI (non-Twitter) predictions for 2012, 2013, and 2014.
In this manner, FIDA collects and organizes structured data (disease incidents, weather, demographics, and health status) as well as health-related information from unstructured data (news feeds, social media, publications, and public health websites) to provide comprehensive, integrated, situation awareness.
Influenza prediction results
Performance of the prediction model for 1- and 4-week look-ahead predictions is shown in Figure 5, where the percentage of ILI values is the percentage of emergency visits related to ILI. As expected, 1-week predictions are more accurate in comparison to longer lead-time predictions; 4-week predictions have relatively higher error rates. The prediction model was able to efficiently capture the cyclical nature of the ILI as well as different patterns of ILI in different years and had an R2 of 90 percent.
Linear regression (with nonlinear variables), boosting, and SVM-based prediction models were also developed for predicting the season start time (the first time in the flu season when the ILI values are above CDC-specified threshold for three consecutive weeks), peak ILI values, and the peak week. Again, SVM gave the best performance. The predictions were developed at the nation level and US Health and Human Services region levels.
Including the social media–based (Twitter) signals to predict ILI for 2014 was less successful. ILI-related tweets as a percentage of tweets in a region were extracted and used in developing prediction models. Model performance did not improve with this data inclusion and the predicted values had more variability (Figure 6). This could be due to inherent noise in the social-media data (people might be discussing ILI-related symptoms in a context other than experiencing them). Smoothing techniques are currently being explored to reduce the variance in the twitter signal and to improve the performance of machine learning–based predictive models.
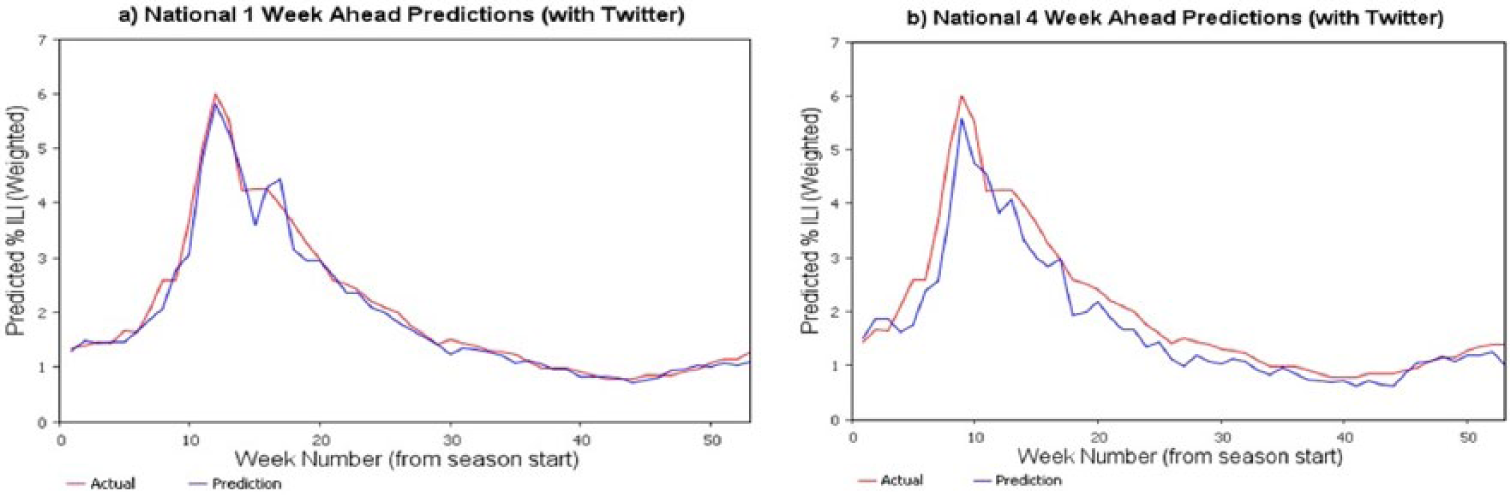
Predicted percent ILI for nation for 2014 with Twitter ILI signals included.
The prediction model without the twitter data indicate good model fit when evaluated based on the confidence intervals (Figure 7) and residuals (Figure 8).
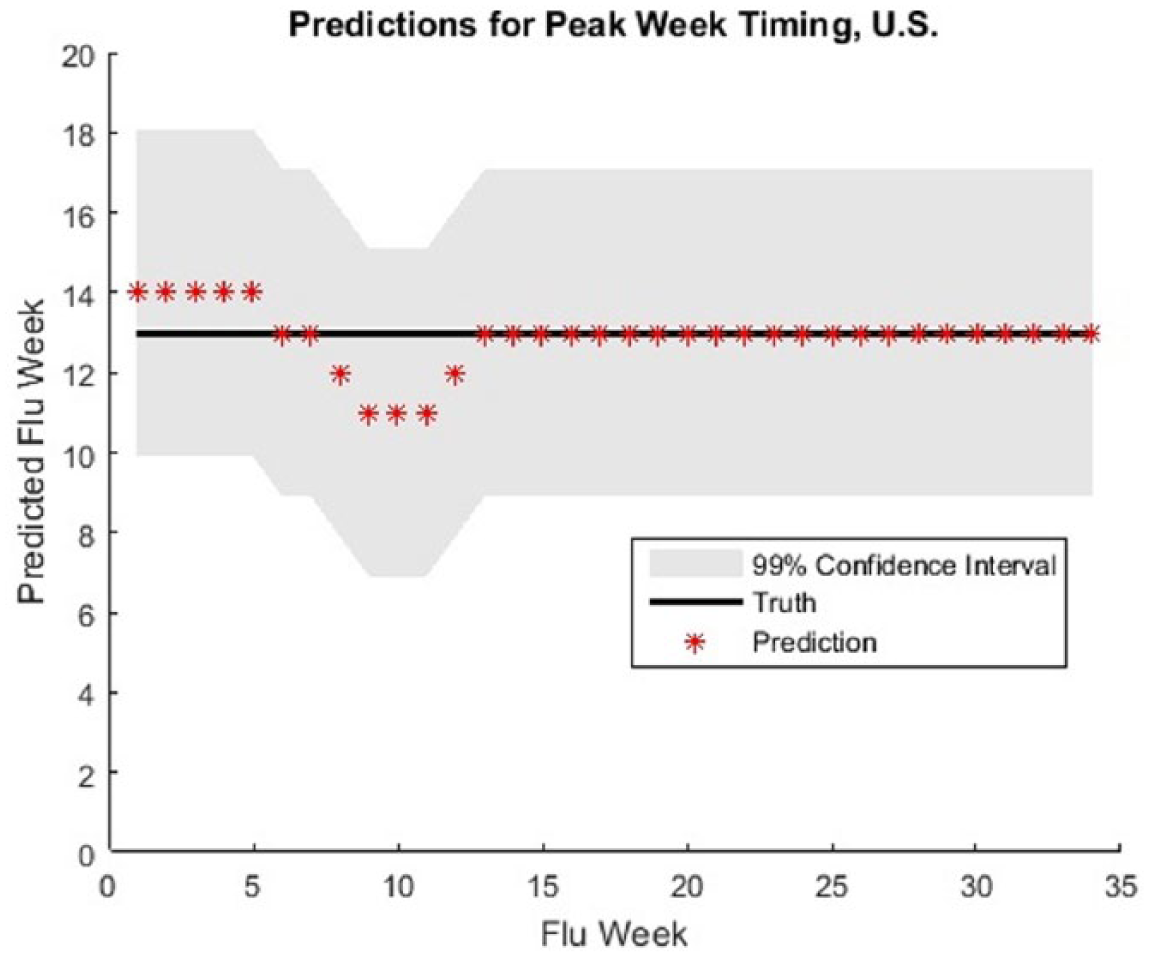
Confidence interval of the predicted peak week versus actual peak week.
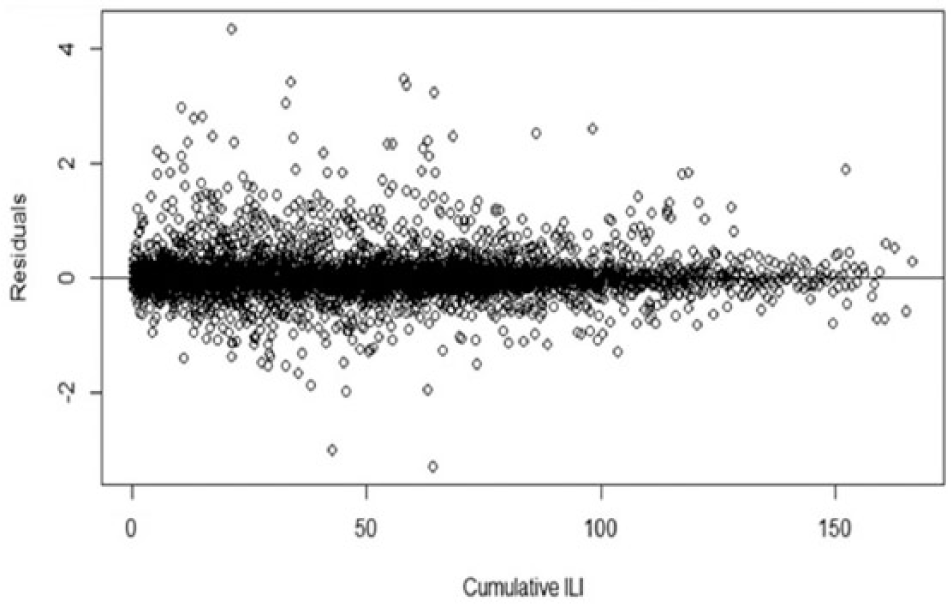
Model residuals for cumulative ILI.
Insights into ILI pattern gained during the predictive model development are as follows:
The variable “HHS region” was significant, indicating that the 10 HHS regions differ in flu spread dynamics. At the national level, prevalence predictions represent a complex combination of the regional flu pattern dynamics.
The variable “week” was significant, indicating that the phase of flu progression impacts flu dynamics. This suggests that flu spread is not memoryless (Markovian), but that future prevalence depends on both current prevalence and recent prevalence history. Indeed, the prior week’s and two weeks’ ILI prevalences were significant as were the weekly rates of change. These effects are likely related to the changing number of susceptible and recovered individuals in the population.
The variable “current ILI prevalence” along with both the square and cube of current ILI prevalence were significant factors in the model, which reflects the high degree of nonlinearity in flu spread dynamics. This indicates the existence of important flu spread mechanisms ignored by first- and second-order models, such as linear regression, parabolic curve fitting, and compartmental models.
The variable “virus ratio” (ratio of positive diagnoses for A and B viruses) was a significant factor indicating that flu spread dynamics depend on virus type. This helps validate FIDA models in that type A viruses are known to cause widespread epidemics and pandemics, whereas type B viruses do not. 69
Weather had an insignificant effect on the ILI prevalence. Maximum temperature had a very small influence, while remaining weather factors had no significant influence. Previous studies have identified humidity as being slightly correlated with ILI intensity. 70 It is suspected that the environmental impact is “averaged out” over the large regional and national geographies. In future research, we will make local health center–level ILI predictions and will re-evaluate the significance of environmental variables on ILI activity.
The resulting prediction model had an R2 value of 90 percent indicating a very good model fit.
Discussion
The vision of FIDA is to support the management of lifecycle of disease—from reservoir, vector, and human populations and in different pandemic phases. This requires comprehensive approach for data collection, integration, disease transmission modeling, and intervention effectiveness analysis. In contrast with other disease models—including FRED, 71 EpiSimdemics, 72 FluTE, 73 AsiaFluCap, 74 and GSAM 75 —which only look at certain aspects of the infectious disease progression, FIDA encompasses all stages of disease management. A key feature of FIDA is recognition that multiple analytical and modeling methods are required in lifecycle of disease management based on the purpose of modeling, availability of data, granularity of the data, modeling expertise and preferences of the analyst, trust in the model results, and interpretability of the model relationships. To support these continuum of analysis requirements, FIDA supports machine learning, system dynamics, agent-based modeling, and discrete-event simulation. Application of machine learning–based predictive analytics for ILI disease is presented in this article. Currently, we are working on developing system dynamics–based models of mosquito population and infection modeling, agent-based model for modeling detailed human interactions and effects of different interventions, and discrete-event modeling of effects of healthcare resources and optimal resource allocation management. An innovative idea we are pursuing is integration of different models through information sharing—for example, parameters like infection rates and transmission rates required for system dynamics and agent-based models will be estimated through machine learning; optimal resource allocation determined through simulation will be used to define the contextual information in agent-based modeling. Use of different modeling techniques to support different analysis requirements and information sharing between the models to provide the necessary inputs as well as to maintain consistency and validity across different models is an unique contribution of FIDA.
In the area of ILI prediction and management, we plan to enhance prediction by including Google Flu Trend data. 76 These data are provided by Google and represent the number of searches made related to ILI. Additionally, we intend to support predictions at local healthcare service provider level, state, and international level ILI predictions. We plan to explore how environmental conditions and vaccination rates influence ILI based on these models. In the area of vector modeling, we are developing mosquito reproduction, growth, and infection models for the study of the Zika disease. With these models, we plan to study the association between mosquito development and its susceptibility to Zika virus based on environmental conditions. Multiple aspects that influence mosquito development such as mating patterns and feeding activity will be modeled. In geographic areas that are home to multiple mosquito species, FIDA can account for both intra-species and inter-species competition for food and resources (primarily in the aquatic stages). Using the prevalence of the virus within the mosquito and human populations, size of the mosquito population, and the sexual behaviors of humans, we can develop intervention models to determine the best strategies for stopping the spread of the Zika virus. We can also identify areas that are at risk for the introduction of Zika and areas that would allow for rapid spread of the virus. Under funding from CDC, we are currently exploring the effects of micro-climatic conditions on the susceptibility of mosquitoes to Zika virus.
Conclusion
Advance knowledge about the location, timing, and intensity of infectious diseases will help public health stakeholders in taking proactive disease containment and management efforts. FIDA provides a predictive modeling infrastructure to support this important public health functionality. FIDA provides comprehensive, end-to-end support for exploratory analysis, temporal analysis, disease spread modeling, prediction, and intervention analysis. It provides an architecture for epidemiologists to breakup disease management into sub-problems and solve the sub-problems with appropriate modeling approaches.
A core prerequisite for effective disease situational awareness and modeling is data. FIDA supports integration of structured data (disease incidents, environmental conditions, demographics, health status, and other disease prevalence) as well as NLP-based biosurveillance on unstructured data.
FIDA leverages automated data collection from multiple sources, different methods of modeling and analysis, modeling of disease transmission in different phases and between different populations, and evaluation of interventions with respect to resources available. The features of the FIDA system (epidemiological data collection, integration, and analysis) provide support to the different disease stages: disease emergence, spread, and decline. FIDA prediction modeling discussed in this article was focused on ILI. We believe that the continued development and advancement of FIDA as outlined in this article, particularly with respect to development of a comprehensive library of multiple disease models and an architecture for integrating them, will allow for better pandemic planning and preparedness at the local, regional, and worldwide levels.
Footnotes
Acknowledgements
The authors would like to acknowledge the guidance and inputs provided by Mr Robert Huffman and Mr Jeffrey Morgan.
Authors’ Note
Madhav Erraguntla is also affiliated with Texas A&M University, USA.
Declaration of conflicting interests
The author(s) declared no potential conflicts of interest with respect to the research, authorship, and/or publication of this article.
Funding
The author(s) disclosed receipt of the following financial support for the research, authorship, and/or publication of this article: Partial source of funding for the effort presented in this article is Defense Health Program (DHP) under Small Business Innovative Research (SBIR) Contract No. W81XWH-15-C-0158 (IPAS). Another partial source of funding is Scowcroft Institute of International Affairs.