
Abstract
The increasing availability of data stored in electronic health records brings substantial opportunities for advancing patient care and population health. This is, however, fundamentally dependant on the completeness and quality of data in these electronic health records. We sought to use electronic health record data to populate a risk prediction model for identifying patients with undiagnosed type 2 diabetes mellitus. We, however, found substantial (up to 90%) amounts of missing data in some healthcare centres. Attempts at imputing for these missing data or using reduced dataset by removing incomplete records resulted in a major deterioration in the performance of the prediction model. This case study illustrates the substantial wasted opportunities resulting from incomplete records by simulation of missing and incomplete records in predictive modelling process. Government and professional bodies need to prioritise efforts to address these data shortcomings in order to ensure that electronic health record data are maximally exploited for patient and population benefit.
Keywords
Introduction
Fundamental to the concept of the learning healthcare system is creating the infrastructure to use the data generated as a by-product of healthcare to promote continuous quality improvements. Collection of structured data is of high importance in derivation of effective chronic disease prediction algorithms such as QDRisk or QRisk2 for predicting the development of type 2 diabetes mellitus (T2DM) and cardiovascular disease, respectively.1,2 A major challenge to achieving this, however, is the recording of high-quality data in electronic health records (EHRs). 3
A recent study by Cresswell et al. 4 identified a range of micro-, meso- and macro-level factors that contribute to better use and repeated reuse of demographic, process and healthcare data to improve the quality and safety of care. The lack of motivation and prioritisation by professionals to enter data was identified as key barriers that need to be overcome. As observed by Kratz, 5 it is expected that more and more technologies and novel approaches will become available to minimise the need for manual data entry. O’Brien et al. 6 proposed the redesign of the documentation process for nurses, where they concluded that one can expect that the value of nursing data will increase in the future and can represent a key differentiator for the economic success of the healthcare institutions by higher effectiveness and lower costs.
This case study aims to raise awareness about a major challenge in exploiting EHR data for patient and population health. It is based on an empirical study using data collected in three healthcare centres (HCs) in Slovenia to observe the impact of missing data on predictive performance in detecting undiagnosed T2DM. To estimate the effect of missing data, we simulated the effects of different amounts of missing values in a complete dataset from two out of three HCs included in the study.
Methods
Study design and population
We conducted a cross-sectional study using anonymised EHR data from three HCs in Slovenia. EHRs from primary healthcare level providers were used to extract the routinely collected data from the Finnish Diabetes Risk Score (FINDRISC) 7 questionnaire (an internationally used risk prediction model) including physiological data in numerical format. Initially, we extracted records for 17,761 regular health check-ups in all participating HCs of which 13,072 records were not associated with any diagnosis and were used in further analysis. Table 1 presents the information on missing data from the three HCs (HC1, HC2 and HC3). Out of the three HCs, HC1 contained the highest fraction of records with at least one missing value (n = 1760, 99.7%). We observe less records with missing values in HC2 (n = 8751, 95.9%) and HC3 (n = 1603, 73.6%) with significantly higher percentages of complete records in comparison to HC1.
Summary information for all variables used in the study including the percentage of records with missing values (in brackets) in three healthcare centres.
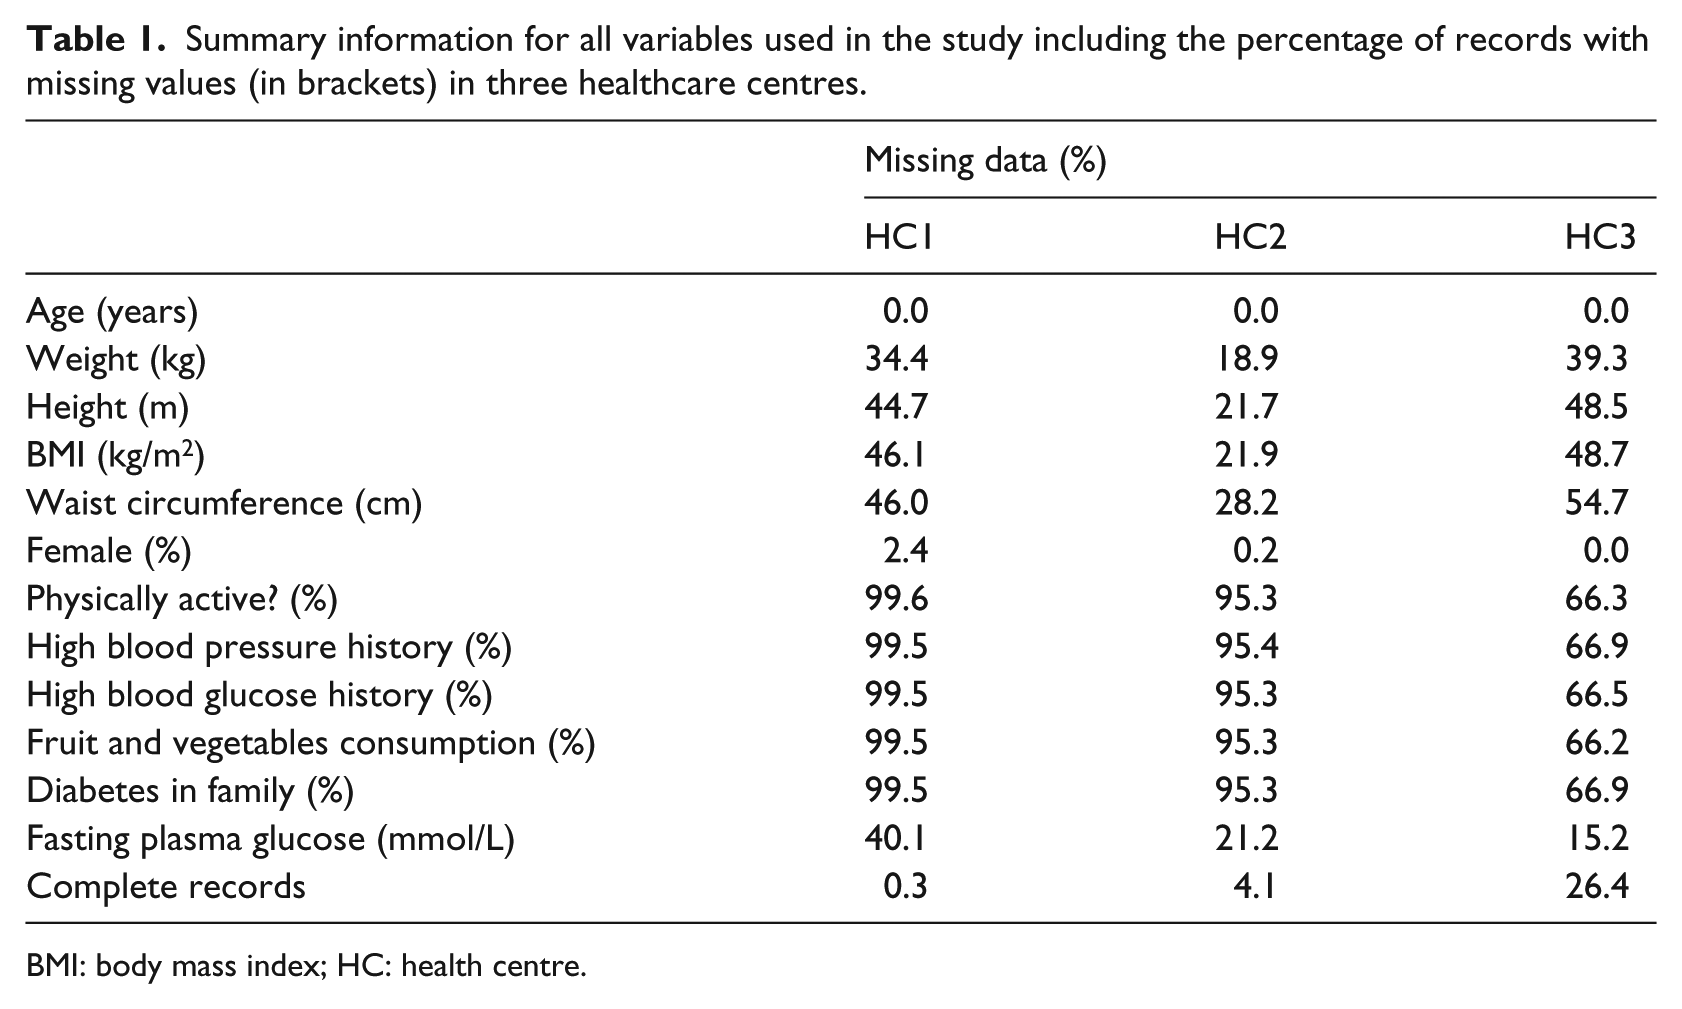
BMI: body mass index; HC: health centre.
Since our aim was to simulate missing and incomplete records while building a predictive model, we kept only complete records containing all FINDRISC variables, present fasting plasma glucose level (FPGL) measurement, and no indication of T2DM diagnosis (n = 952) for further analysis. Due to the extremely high number of records (1760, 99.7%), with missing data, we excluded HC1 from further analysis. Out of 952 participants from the two remaining institutions, 477 (50.1%) were female with mean age of 55.4 (95% confidence interval (CI): 54.3–56.5) and 475 (49.9%) male with an average age of 55.3 (95% CI: 54.3–56.3) years.
Predictor variables
Five numeric (age, height, weight, body mass index (BMI) and waist circumference) and six dichotomous variables (sex and five FINDRISC questions) were used to build a model. The five FINDRISC questions were related to daily physical activity (more than 30 min), history of high blood pressure, history of high blood glucose, fruit and vegetable consumption and diabetes in family. All 11 variables were used as input variables for derivation of a predictive model. Table 2 presents a summary of all predictor values in the two HCs included in the study.
Summary information presenting mean (with corresponding 95% CI) or frequency values for all predictor variables from complete records used in the study.
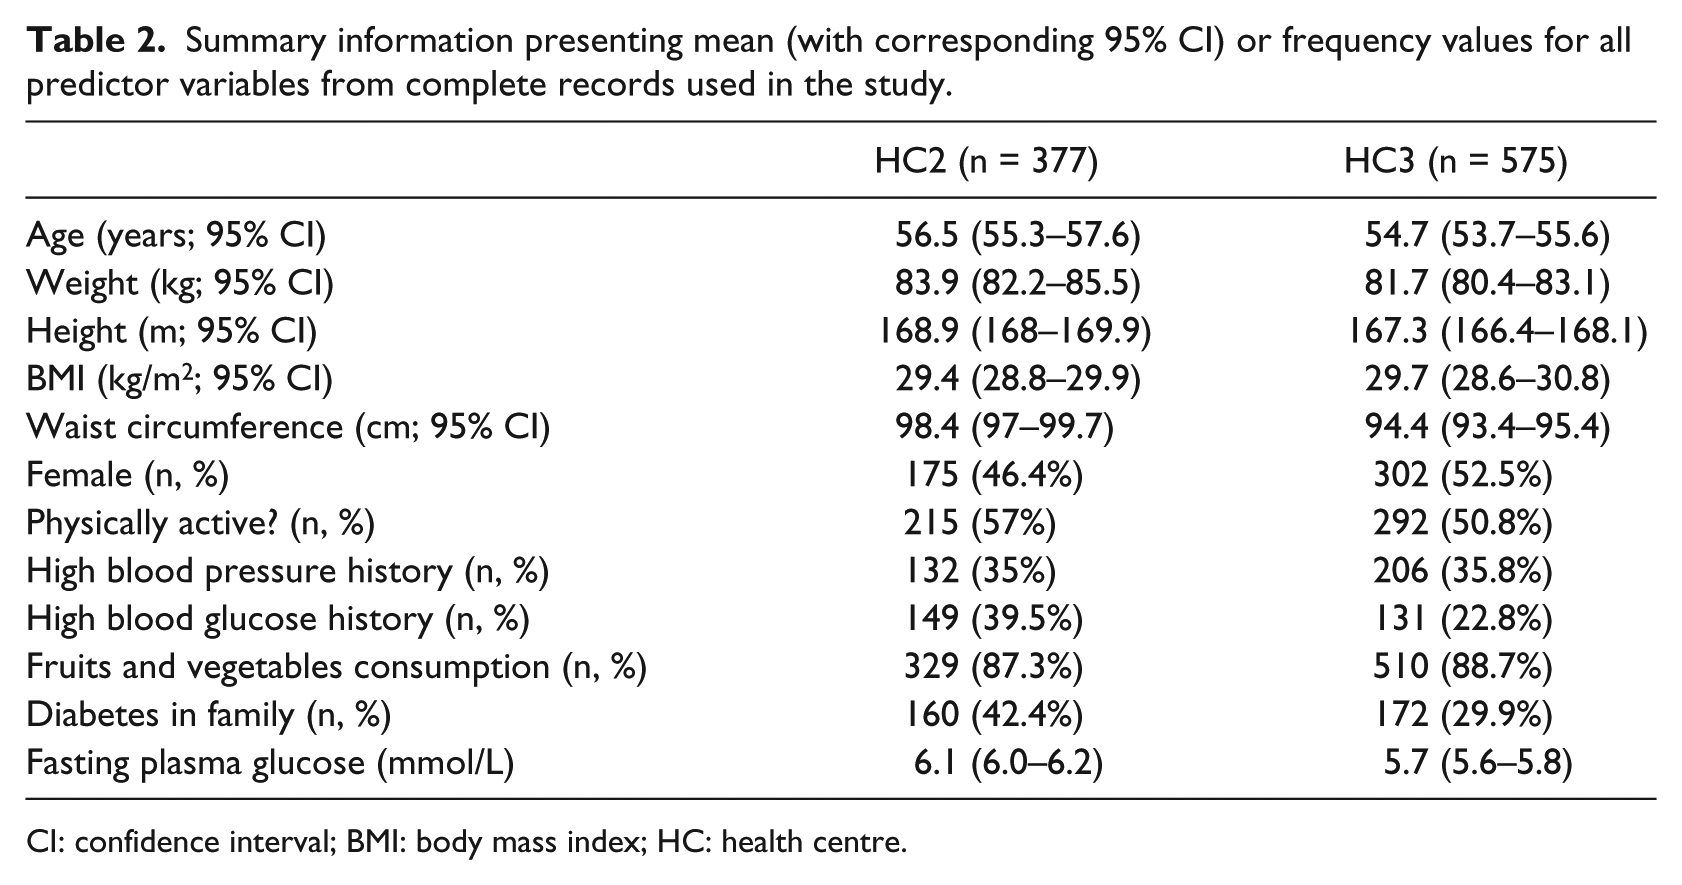
CI: confidence interval; BMI: body mass index; HC: health centre.
Outcome
The outcome in the study was prediction of undiagnosed T2DM based on FPGL. We used an FPGL threshold of 7.0 mmol/L (126 mg/dL) resulting in a very imbalanced classification problem where number of negative samples strongly outweighs the number of positive samples (10.4% positive samples, n = 99).
Statistical analysis
Least absolute selection and shrinkage operator (LASSO) regularisation–based logistic regression as defined and implemented by Tibshirani 8 was used to build the predictive models. The LASSO was chosen to avoid multicollinearity problems, especially in cases where higher proportion of missing data were introduced.
The performance of the models was assessed using the following measures:
General predictive performance was tested using the C-statistic that measures the balance between sensitivity and specificity by calculating the area under the receiver operator curve (AUC). 9
The accuracy of probabilistic predictions was measured using Brier score. 10
Additionally, we calculated the sensitivity, specificity, positive predictive value (PPV) and negative predictive value (NPV) of the models. 11
Repeated five-fold cross-validation was used to calculate the average value of performance measures with corresponding CIs. In five-fold cross-validation evaluation, we divide the initial set of samples into five groups containing approximately equal number (20%) of samples. In each iteration, we selected four different groups of data for derivation of the predictive model and test the model performance on the remaining group of samples. Each five-fold cross-validation was repeated 100 times on randomly reshuffled data.
The initial set of experiments measured the predictive performance of the model built on all data available during the cross-validation process. This step was followed by two alternative experiments that simulated two approaches to missing and incomplete data. The first approach (‘exclude’) simulated a scenario where the predictive model was built only from complete records. The second approach used the well-known missing value imputation method called missForest12,13 to allow inclusion of all records in the model-building phase. The missing value imputation by missForest was conducted using the default settings proposed by the authors of missForest 12 with an exception in number of decision trees built for each variable that was set to 20. In both cases, we injected the missing data by
Randomly selecting different percentage of samples (ranging from 5 to 90 in steps of 5).
Randomly selecting affected variables in samples selected in step 1. Variables were selected randomly using a weighting scheme that took into account the percentage of missing values for specific variable in the initial dataset (Table 1). By increasing the probability of missing value injection in variables with higher percentage of missing data, we achieved a realistic distribution of missing values.
Injecting a missing value for each selected (sample, variable) data point.
Ethics and reporting
The institutional ethics committee approved this study. We have followed the ‘Transparent reporting of a multivariable prediction model for individual prognosis or diagnosis’ (TRIPOD) initiative guidelines. 14
Results
In this section, we present the results of the predictive performance evaluation for all three scenarios discussed above. As it can be observed from Figure 1 and as expected, the exclusion of incomplete records resulted in a significantly stronger decrease in AUC compared to the alternative scenario of replacing missing values using missForest. For each of 100 runs of the experiment, we initially built a LASSO model on full training sets that achieved a mean AUC of 0.850 (95% CI: 0.846–0.854) on test sets of the five-fold cross-validation. The 95% CIs of predictive performance using LASSO on full datasets compared to results of the missForest approach overlapped up to the point with 20 per cent of injected missing values. At 20 per cent of missing data, the missForest approach achieved an AUC of 0.841 (95% CI: 0.837–0.846). With ≥20 per cent of missing values injected, the loss of performance was significant when missForest-based models were used.
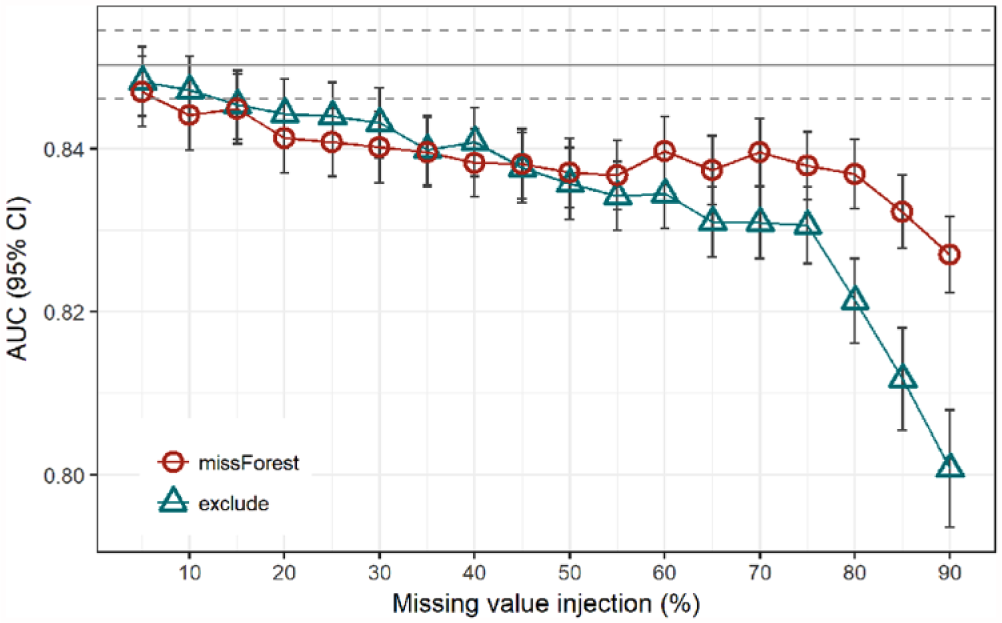
Comparison of AUC for two approaches to classification in the presence of randomly injected missing values compared to a model built on a complete dataset (grey line with 95% CI in dashed lines).
For ‘exclude’ scenario, this value lay at 35 per cent of missing values. There were no significant differences in AUC between the missForest and ‘exclude’ approaches all the way up to 75 per cent of injected missing values where the CIs stop overlapping and ‘exclude’ starts to return significantly inferior results.
The results from the ‘exclude’ scenario, represented by triangles in Figure 1 and observed from the right to the left, can be used to estimate the relation between the sample size and performance of the classification model. This way the rightmost point represents a result where only 10 per cent (n = 76) of the available data were used to build a model that achieved an average AUC of 0.801 (95% CI: 0.794–0.808). The second rightmost point represents a model performance when the number of available samples doubled (n = 152) resulting in an average AUC of 0.812 (95% CI: 0.805–0.818). Following the increase in performance from the right to the left (Figure 1), we can estimate the potential of improving the prediction performance by adding the records beyond 100 per cent of all available records. At the same time, we can observe the CIs that are becoming narrower with the rising number of samples.
Observing the alternative performance metrics, Figure 2 shows no significant differences between the tested scenarios, except in cases with extremely high number of missing values. Figure 2 also shows the PPV metric with relatively low values for both approaches, a result commonly seen in imbalanced classification problems. PPV fell significantly below the performance of the basic model when the number of missing values passed 40 per cent. The true effectiveness of the missing value imputation versus exclusion can be observed in the last plot of Figure 2, where we can observe the fraction of persons selected for screening by the predictive model. The missForest-based model is not only better in AUC but also selects a lower number of persons for further examinations at the same time, especially with the highest fraction of missing values.
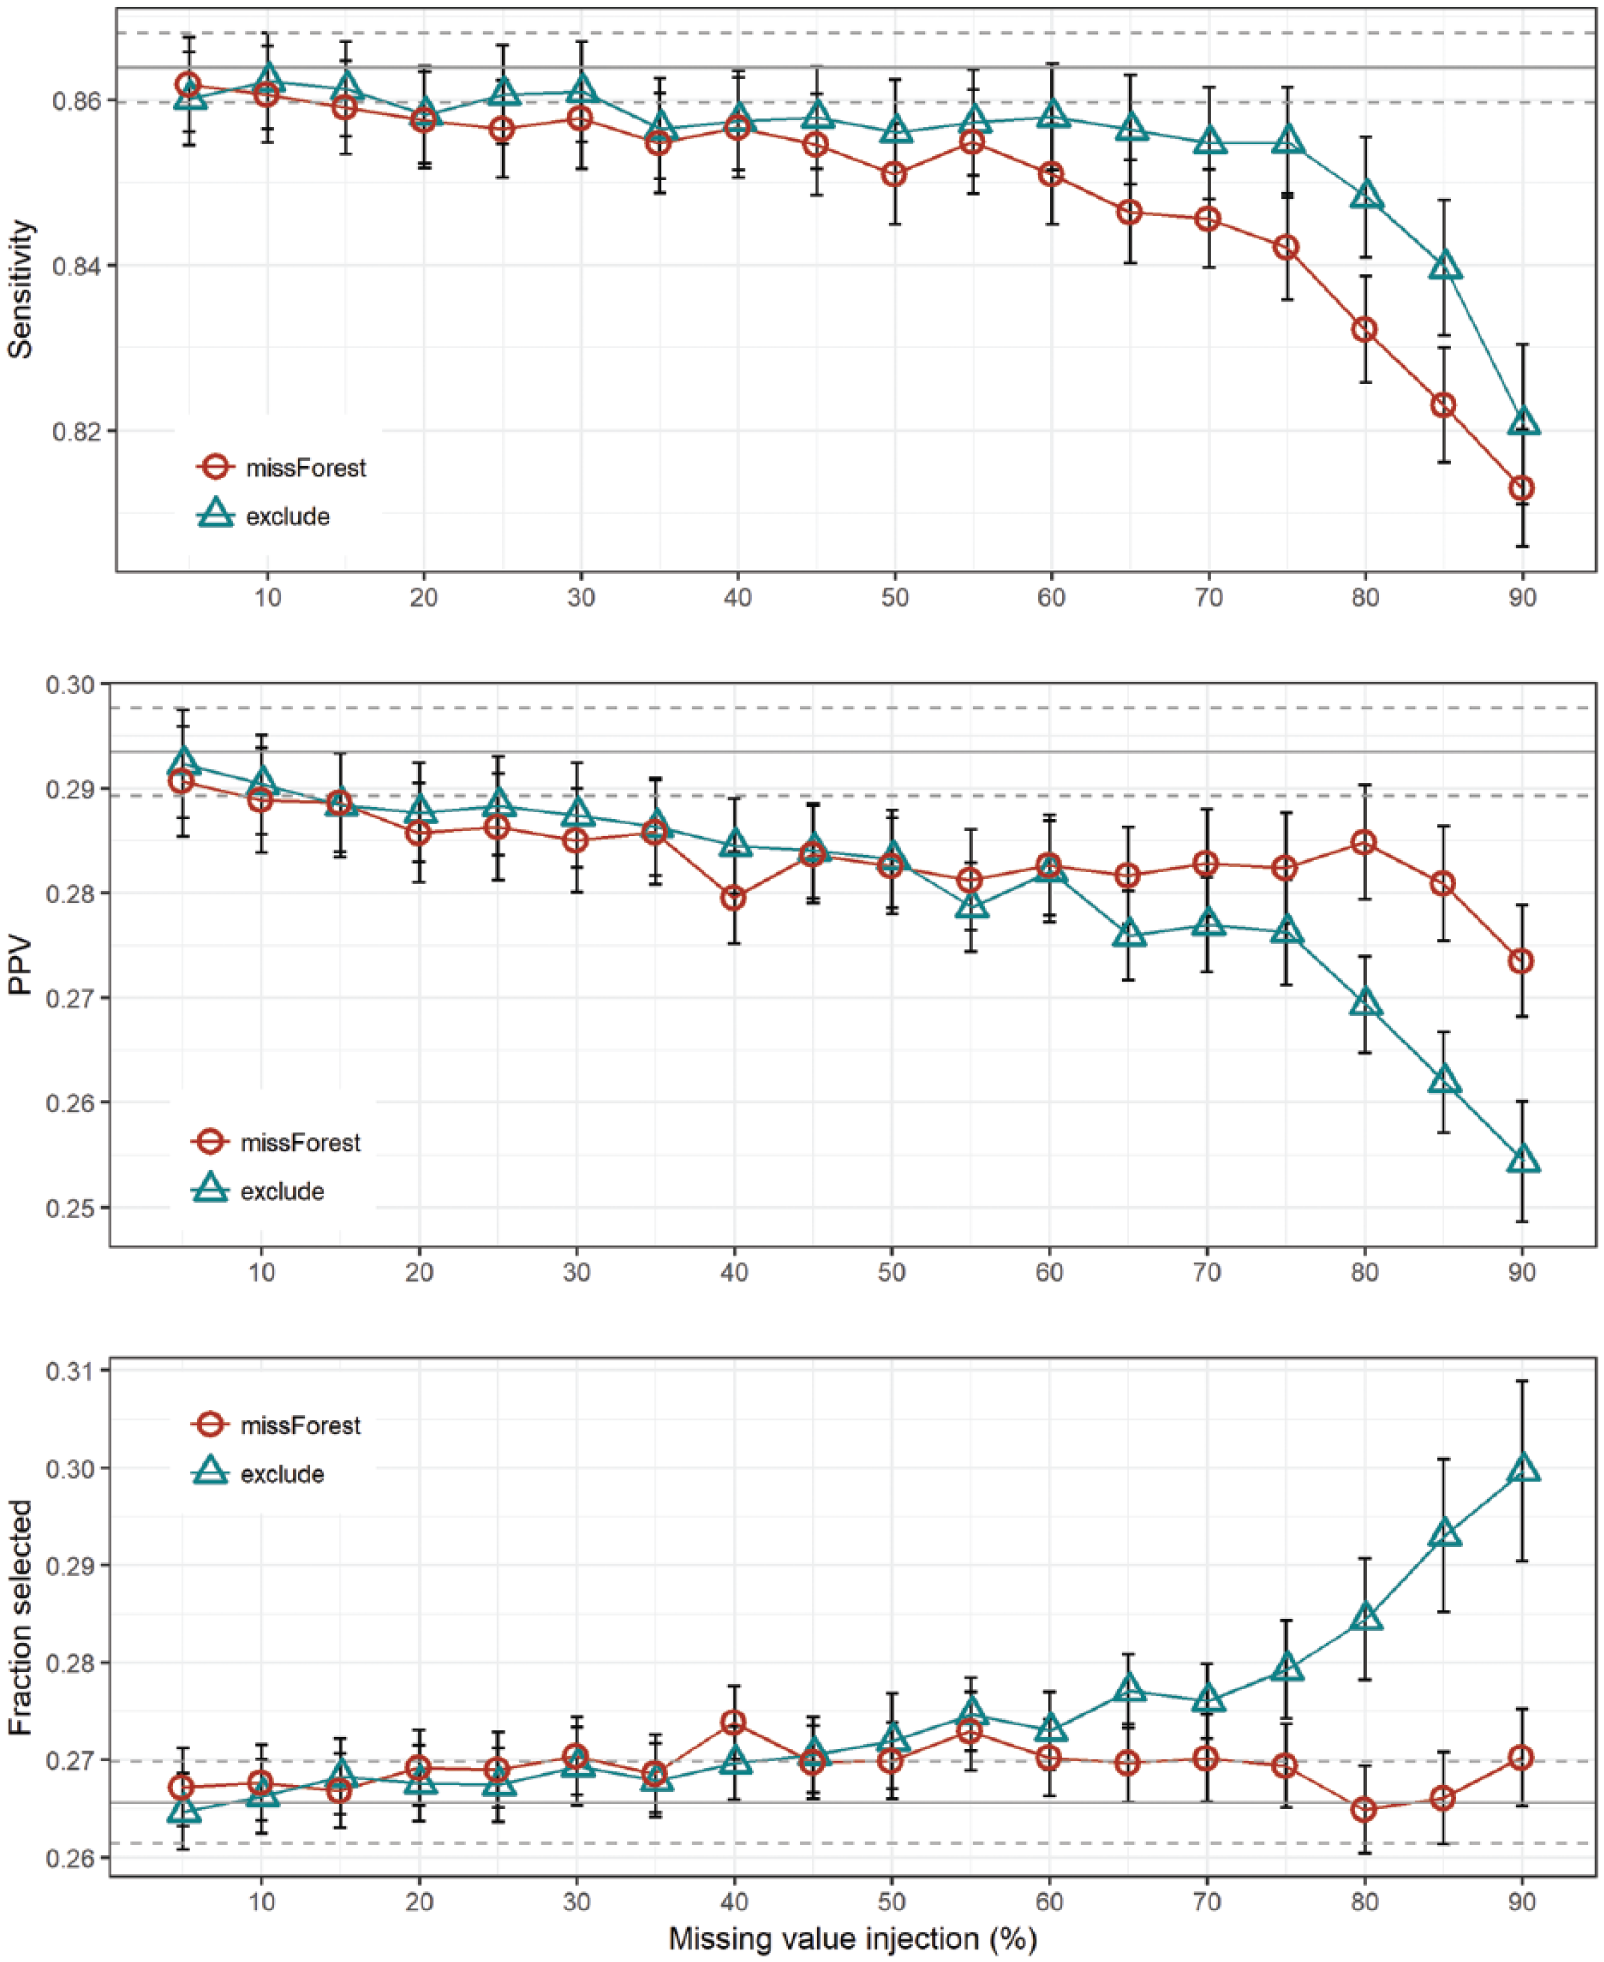
Sensitivity, positive predictive value (PPV) and fraction of selected samples by the predictive model for different levels of missing values.
Discussion
In this study, we demonstrate the effects of incomplete and missing primary healthcare data in developing a predictive model for undiagnosed T2DM. We observed a significant drop in predictive performance for the data imputation approach with only 20 per cent of missing data. In data obtained from three HCs in Slovenia, we observed high fractions of incomplete data ranging from 73.6 per cent up to 99.8 per cent observed in one of the HCs.
Compared to results achieved in a similar study 15 using a more common FINDRISC questionnaire to predict the presence of undiagnosed T2DM, a model built on full dataset in this study performed very well. However, there was a significant difference in approach to data collection in both studies. There are some very different challenges a researcher will have to confront when the data are collected using a paper-and-pencil questionnaire in comparison to analysis of routinely collected data from EHRs. In this study, we focused on missing data that frequently originates from lack of motivation to enter the data. 4 The fraction of missing data observed in this study was high, especially for variables where reporting to the National Institute of Public Health was not mandatory.
High variance of results that was observed in some results (Figure 1) can be attributed to different factors, where class imbalance represents an important factor. With only 9.1 per cent of positive samples, where we could confirm the undiagnosed T2DM, our problem could be classified as highly imbalanced problem. However, in most similar studies, one can meet even lower fractions of positive class, especially in cases where the sample is limited to younger population groups.16,17
Our observations from three HCs in Slovenia suggest that there are extremely large proportions of incomplete records stored in medical information systems on the primary healthcare level. To demonstrate the impact of incomplete records on the final predictive performance of the models build on such data, we conducted an experimental study. By randomly injecting missing variable values, we were able to show a significant drop in performance when 35 per cent of records were either missing or were incomplete. The impact of missing values on predictive performance can be reduced using a missing value replacement using methods such as missForest, but their contribution seems to significantly affect the predictive performance only in cases with an extremely high percentage of missing values. This is also true in cases where the fraction of persons selected for further examinations is observed. By selecting more cases than missForest model, the usage of ‘exclude’ model leads to higher costs for the healthcare system. When observing the performance of the classifier built in exclusion scenario, one can observe a positive trend when the percentage of missing values decreases, meaning access to more records would further improve the performance of the classifier.
However, even data imputation techniques can result in misleading conclusions, especially in case of so-called missing at random (MAR) scenarios. 18 However, researchers also report misleading results in case of using simple approaches for dataset modification such as discarding observations or ad-hoc replacement of missing values. 19 To some extent, we can solve this kind of problems using classification models that can implicitly handle missing values (e.g. decision trees 20 ).
Conclusion
Recent studies emphasise the importance of motivation for entering the data to improve the learning health systems of the future. To raise awareness on this issue, the health data science community needs to organise a number of events that highlight both the clinical and research importance and value on striving towards more complete datasets. One such use case was demonstrated in this study. Using simulation of missing values, we were able to detect the significant drop of performance even in cases where only one-third of records were missing or incomplete.
Footnotes
Acknowledgements
We are grateful to Teo Bizjak and Jozica Leskovsek from Nova vizija d.d. for providing the technical and administrative support to access the EHR data used in this study.
Funding
The author(s) received no financial support for the research, authorship, and/or publication of this article.