
Abstract
Quality pain management implies a thorough pain assessment with structured communication between patients and healthcare providers. Pain distribution is an important dimension of cancer pain. Assessment of pain distribution is commonly performed on a pain body map. This study explores how a computerized pain body map may function as a communication tool and visualize pain in patients with advanced cancer. In previous studies, we have developed a tablet-based computerized pain body map for use in cancer patients. The aim of this study was to adapt the computerized pain body map program to patients with neuropathic cancer-related pain, and to develop a separate interface for healthcare providers. We also wanted to investigate the perceived usefulness of this system among patients and healthcare providers. Both patients and healthcare providers perceived that the visualization of pain in the computerized pain body map system had potential to be a positive contribution to clinical pain management, and to improve collaboration between healthcare providers.
Introduction
Efficient pain management requires good communication and access to all relevant information. Even though pain is a universal human experience, pain is subjective, and there is no common language presenting a precise and universal description of the problem. Also, individuals have varying ability to express their pain. Assessment tools have been developed to address this challenge 1 and structure information related to the severity of the problem, the impact, and the effect of the pain management. 2
Pain is a highly prevalent problem in patients with cancer, and increasingly so with advanced, incurable disease.3–5 Even though potent drugs and evidence-based guidelines are available, there are well-known barriers to cancer pain management. 6 These barriers include lack of knowledge about cancer pain, and beliefs or concerns related to pain treatment and the use of opioids, both among patients and physicians. Inadequate assessment is another important barrier to good pain relief, and finally inadequacy of opioid prescription, leading to under-treatment of pain.
Cancer pain may be caused directly by the tumor, or result from cancer treatment.2,5,7,8 Pain in patients with advanced cancer is broadly classified into “common” nociceptive pain that arises from tissue damage and is due to activation of pain receptors, 9 and neuropathic pain, which is caused by a lesion of the somatosensory nervous system giving an “abnormal” activation of pain pathways. 9 In clinical studies, cancer-related pain of predominantly neuropathic origin is reported with a high prevalence, indicating the importance of recognizing and assessing this type of pain in clinical practice.8,10
Collecting information from patients for pain management is performed in an iterative way. Decisions are based on available historical data, information on the current problem, and available treatment options. Consequently, the communication between patients and healthcare providers (HCPs) must adapt to the severity of the patients’ disease, taking the possible impact of treatment side-effects and progression of the disease into account. Pain distribution and changes in pain patterns may be related to specific pain syndromes in need of urgent care, or may represent progression of disease in need of early detection. Neuropathic pain distribution has often a more distinct anatomical pattern dependent on cause and location.7,8 These factors make visualization of pain an important part of the assessment.
For most patients with pain, management of their symptoms will require involvement from several HCPs such as physicians, nurses, physiotherapists, or occupational therapists. Currently, handover of patients between HCPs is supported by written or oral communication. However, evidence shows that pain is poorly documented in the patient’s health record11–13 causing reduced transparency within the treatment team and reduced interdisciplinary influence on decision-making.
Visualization of the pain on a pain body map is a way to improve the assessment by reducing the complexity for patients, as they describe the pain distribution by drawing the painful areas on a body image.14–16 This method has been shown to be reliable for patients with different chronic pain conditions as well as cognitive impairment.15–17 A body map is also shown to be an easy and reliable tool for HCPs interpreting the pain drawings.18,19 Currently, paper and pencil pain body maps must be compared manually or as scanned documents to detect and compare changes over time.
In recent years, several computerized pain body maps (CPBMs) have been introduced.14,20–22 These tools have mostly been developed for chronic pain conditions such as low back pain, post stroke pain, or chronic pain in general.14,22 However, publications documenting these tools provide limited evidence on patient involvement during their development.
Our group has aimed to develop a CPBM for the frailest and sickest patients with advanced cancer. In previous studies, we have investigated how these patients interacted with the tool, 23 and how cognitive and physical impairment affected the interaction.23,24 From these studies, we identified a set of requirements for the Graphical User Interface (GUI), size and weight of the computer, and quality of the touch screen. The result was a new CPBM with acceptable usability for even very frail patients with advanced cancer. 24 This gave us reason to believe that the CPBM could be a useful tool in the management of cancer pain by providing accurate and easily shared pain information to aid the decision-making.
The primary aim for this project was to further develop the CPBM to fit the needs of patients with neuropathic cancer-related pain. This included adapting the software, and investigating the patients’ views on the CPBM as a communication tool for a clinical purpose. The second aim was to collect feedback from HCPs on the features and functionalities of the CPBM, as well as the perceived implications of the system for clinical practice.
Methods
Two studies are presented.
Study 1: Pilot testing of the tablet-based CPBM in patients with cancer-related neuropathic pain.
Study 2: Focus group interviews with Norwegian and Scottish HCPs to explore their perceptions of and views on the system (the CPBM for patients and a corresponding webpage for HCPs).
Participants
Study 1
Patients referred to the Oncology Outpatient Clinic at Edinburgh Cancer Centre for management of neuropathic cancer-related pain were recruited to the study. Inclusion criteria were age above 18 years, advanced cancer, neuropathic pain due to cancer or anticancer treatment, and ability and willingness to provide written informed consent. Neuropathic pain was defined as having a LANSS (Leeds Assessment of Neuropathic Symptoms and Signs) score ≥12 25 and neuropathic pain components confirmed by a clinical examination.25,26
Demographic and disease-specific information was taken from the medical record. The patients were asked about their level of education and current use of computers and touch-screen devices.
Study 2
Physician specialists working in palliative care services in five different geographical areas (three in Norway and two in Scotland) were contacted by email and invited to participate in a focus group evaluating a digital pain assessment tool. The physicians were encouraged to pass the invitation on to 2–3 colleagues working in palliative care (full time or part time). A group of general practitioners (GPs) responsible for palliative care admissions in a community healthcare center in a rural area was also invited.
Digital tools
A paper mock-up (Figure 1), a CPBM application for iPad, and a webpage displaying the patient data from the iPad registrations (Figures 2 and 3) were developed and used during the study.
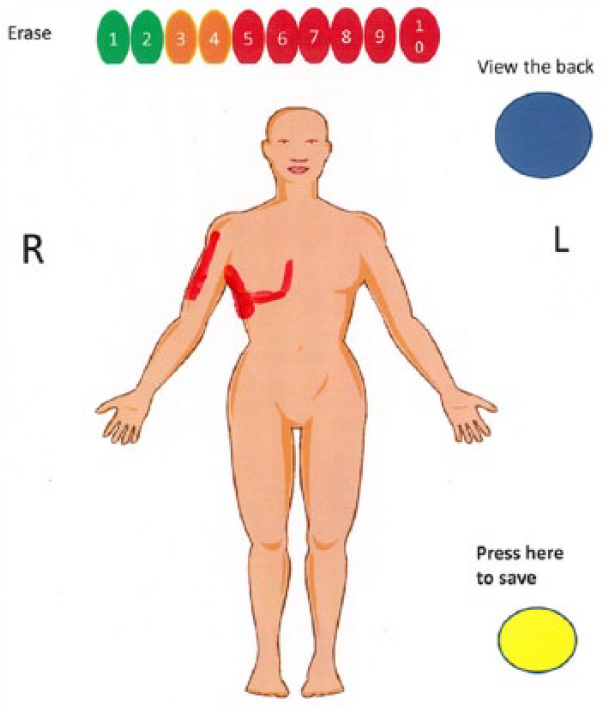
Paper mock-up of a CPBM.
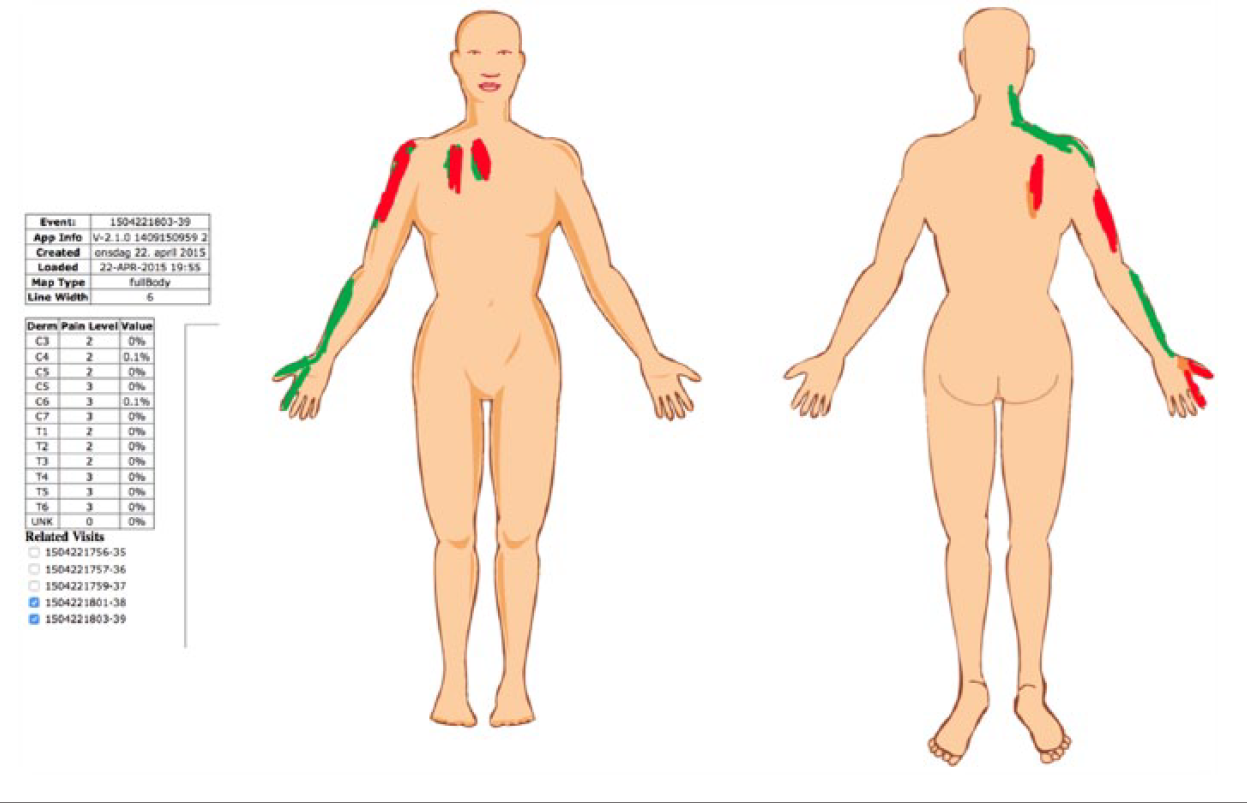
Layered presentation of two CPBMs from the same patient on the clinical interface.
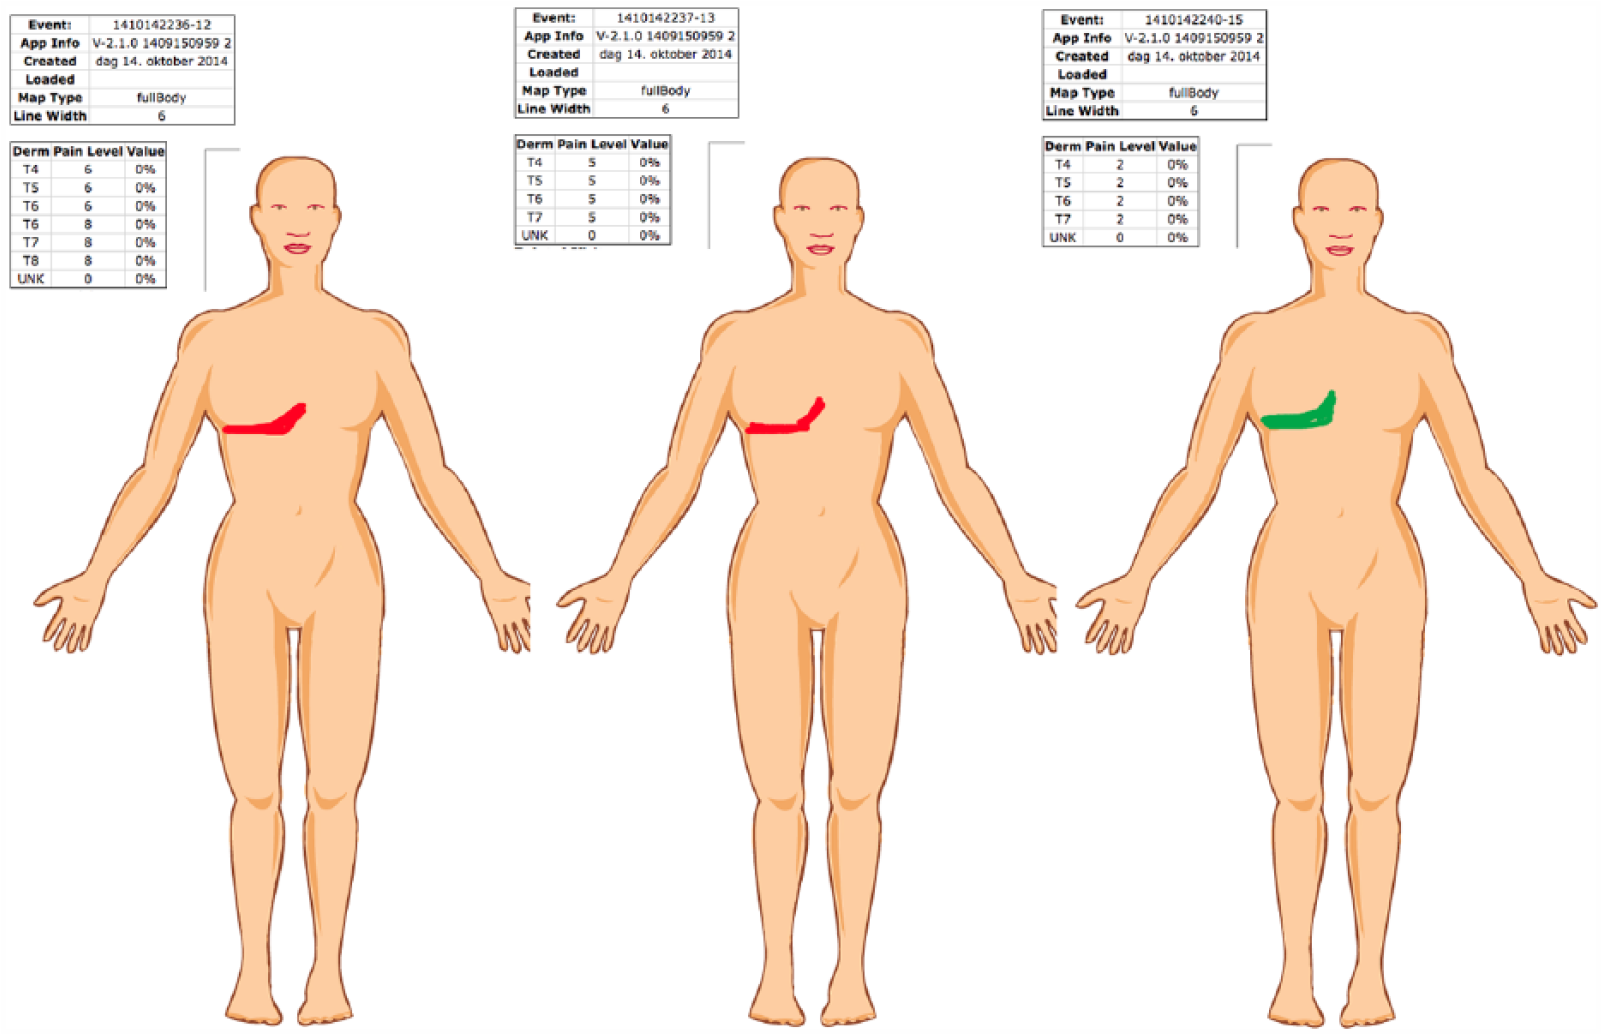
Side-by-side presentation of three front CPBMs from the same patient on the clinical interface.
The laminated mock-up included two pages: (1) a menu for selection of enlarged body parts and (2) the corresponding images for marking the pain. The iPad CPBM presented the same features as the paper mock-up.
Data from the iPad application were transferred to a server. The pain drawing data were processed and presented for HCPs via a web interface. The patient drawings could be displayed either as a layered presentation showing the composite changes in pain over time (Figure 2), or as a side-by-side presentation of the individual body maps (Figure 3). The system presented the changes in pain (location and intensity) in a table, or listed on the screen above the CPBM. The system also provided the option to annotate the patient drawings. The processed patient data included changes in pain intensity (difference between current and highest previous pain score), extension of the marked area in percent of available surface, and the exact location of the marked area. This was defined by the neuroanatomical location as described by the segmental innervation of spinal and cranial nerves (dermatomes).
Questionnaires on technology acceptance and usability
The questionnaires were used to standardize the test situation and guide the collection of information.27,28 The System Usability Scale (SUS) is a questionnaire examining how well an application is adapted to the user in terms of effectiveness, efficiency, and satisfaction. 29 Patients rate their agreement to the statements from 1 (strongly disagree) to 5 (strongly agree).
The second questionnaire used in this study was an adapted version of the Technology Acceptance Model (TAM), assessing perceived ease of use and perceived usefulness of an application. 30 In study 1, patients evaluated the CPBM, and in study 2, HCPs evaluated the whole system (CPBM and webpage). Answers were scored on a 1–5 numerical rating scale (NRS). In study 1, a question about sharing pain data with family and friends was added to the TAM questionnaire. In study 2, the following questions were added: “Do you believe that using this system (iPad and corresponding webpage) can improve the communication between you and other health care providers?” and “How would you compare this tool to traditional paper-based pain body maps?” Several of the respondents also chose to give written comments to questionnaire items. These comments were included in the qualitative analysis.
Procedure
Study 1
The purpose of the study was to tailor the CPBM to patients with cancer-related neuropathic pain. The procedure followed a user-centered method for software development. 31 The patients were given a demonstration of the tool and instructions for using a stylus. They were further asked to consider the subjective pain they were experiencing and visualize it by marking the location and distribution on the CPBM. They were also instructed to quantify the intensity by selecting a number on a scale between 1 -10. Selection of pain intensity was necessary to “activate” the screen, by touching a number on the 1-10 NRS, displayed as a triage system, inspired by the Edinburgh Pain Assessment Tool (EPAT) 32 (1-2 green, 3-4 amber, and 5-10 red). The patients were given a detailed instruction to mark the painful areas in a way that would make the HCP understand where they had pain and the extension of their pain. During the task the patients were observed by the researcher. After the usability test, the patients were given the two questionnaires, and finally subjected to a post-test interview about their interaction with the tool and their evaluation of the CPBM.
The patients’ markings on the CPBM were also used to guide the development of a web-application to process the data from the iPad.
Study 2
The physicians were presented with the CPBM and the corresponding webpage.
The study consisted of three steps: (1) presentation and demonstration of the system, with the option to try it hands-on; (2) TAM questionnaire; and (3) a focus-group interview.
Scenarios
Study 1
Testing by patients was performed in connection with a visit to the palliative and supportive care specialist at the Oncology Outpatient Clinic for better pain management.
Study 2
The HCPs were presented with a hypothetical (but realistic) scenario describing a breast-cancer patient with severe pain who had visited different HCPs responsible for her pain management at different points in time. The patient was admitted to hospital due to new, intractable pain in her back and persistent pain in the region of primary surgery. She visualized her pain by marking the location, distribution, and intensity on the CPBM. The patient and the HCP used her pain drawing during the conversation about her pain. Then, the HCP performed a clinical examination and viewed the historical data (Figures 2 and 3) before making a decision about further examination and management.
After discharge from hospital, pain management was the responsibility of the GP. The pain management was performed in collaboration between pain specialists at the hospital and the GP by sharing the same visual pain data marked by the patient. This was accessible to them both from a webpage. During the presentation, the scenario was illustrated by data from the CPBM system.
Focus-group interviews
The focus-group interviews 33 followed a semi-structured interview guide developed by the authors, and aimed to elicit the perceived usefulness of the CPBM for facilitating pain communication and supporting clinical decision-making. The participants were asked to discuss the aspects of the patient scenario and the CPBM system based on their own professional experience.
Data processing and analysis
During the usability test, areas needing improvement were identified based on observations of 4–5 patients. In addition, comments, suggestions, and questions from the patients were reported and integrated into the evaluation of the program.
Answers to the SUS and TAM questionnaires were analyzed using descriptive statistics by SPSS 21 (SPSS software; IBM). The focus-group data were analyzed and categorized into focal themes by two of the researchers (E.A.A.J. and K.H.). The categories were refined in an iterative process focusing on consistency in thematic coding and interpretation.33,34
Research ethics
The patient study (study 1) was approved by the South East Scotland Research Ethics Committee 01, Scotland, UK. Each patient provided written informed consent before participation.
Results
Study 1: patient study
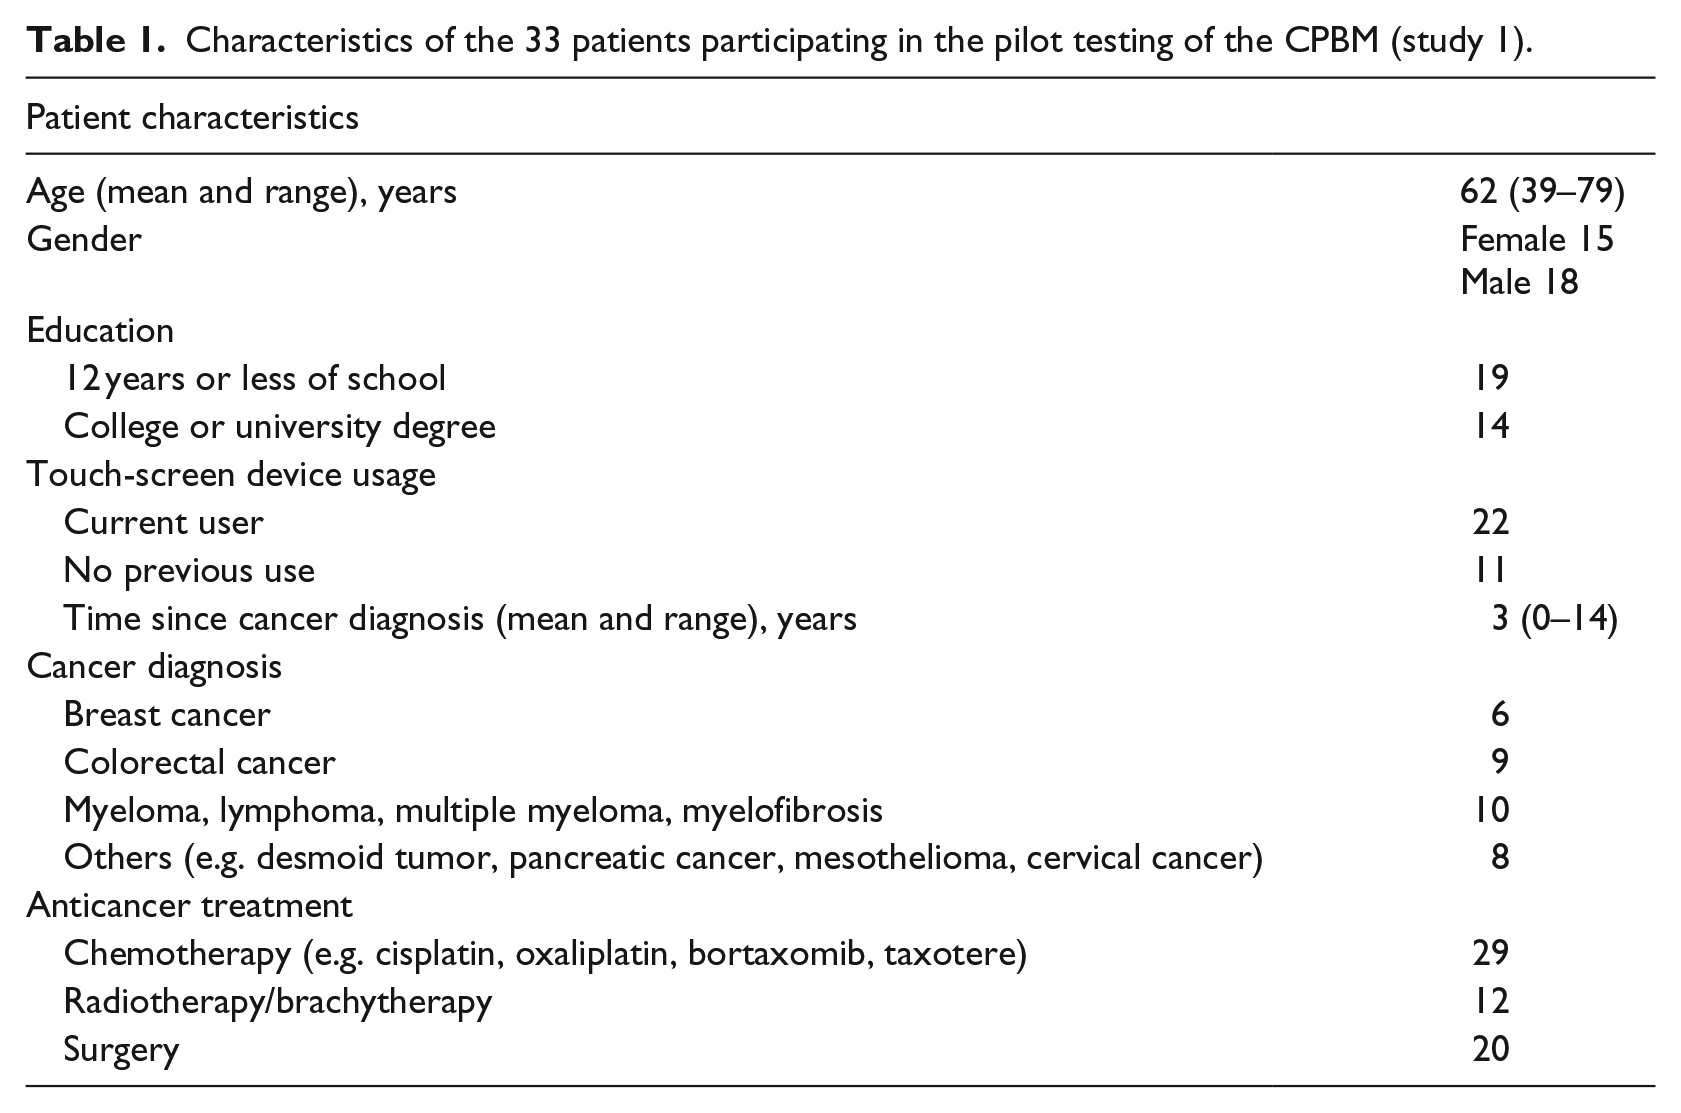
We recruited 33 patients with verified neuropathic pain related to cancer or anticancer treatment. Patient characteristics are listed in Table 1. All patients were outpatients and had a Karnofsky performance status (KPS) in the range 50–90. 35
Characteristics of the 33 patients participating in the pilot testing of the CPBM (study 1).
Observation
Two-thirds of the patients were familiar with tablet devices and applications, and recognized and commented on this during the presentation. Eleven of the participants had never held or interacted with a tablet prior to the testing. Observation of the patients gave no indication that interaction with and interest in the tool were influenced by previous experience using touch-screen devices.
Four patients were presented with the mock-up (Figure 1). All four found the navigation easy and that the mock-up gave sufficient area to mark their pain on. The same features were transferred to the iPad for further testing.
All patients understood and were able to follow the instructions for use. We gave them a stylus for marking on the screen, but observed some trying to use a finger instead. This did not work well, since the finger covered the area the patient intended to mark. Consequently, the finger was perceived to increase complexity and inaccuracy when marking the painful areas. This was particularly important when marking small areas like fingers and toes for neuropathic pain (Figure 4).
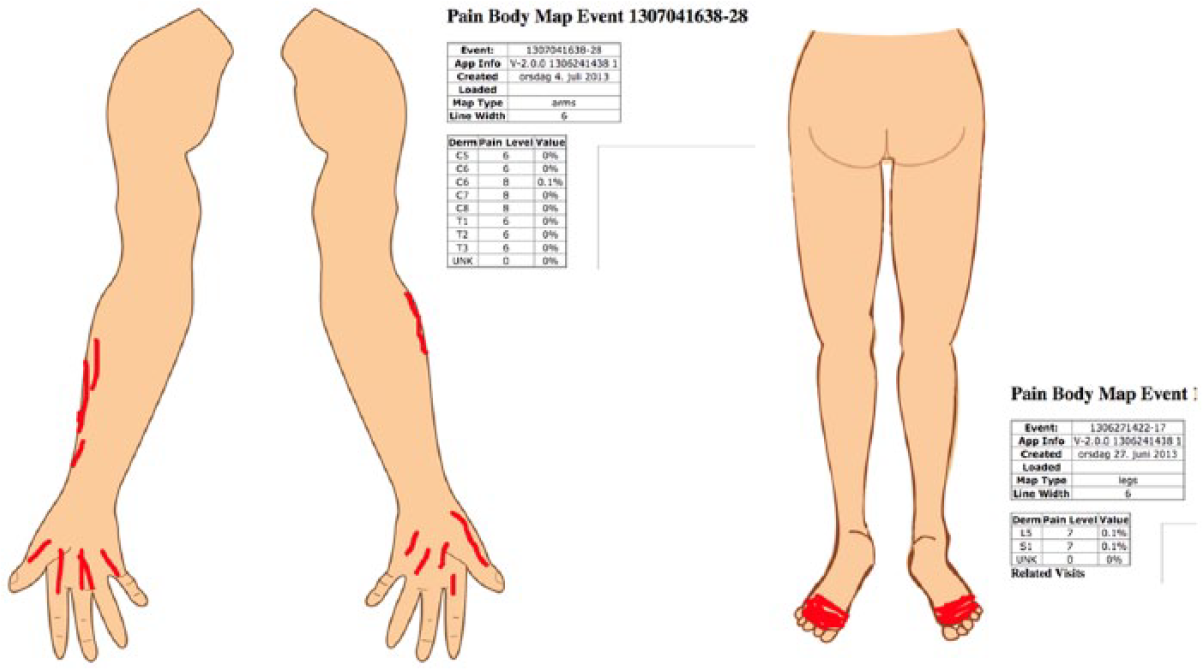
Marking of neuropathic pain distribution on hands and feet.
We presented a menu of images of enlarged body parts for patients to choose from. The anterior and posterior whole-body projections covered most of the screen, including side views of the head. The patients found all projections easy to use except from an image of two arms unattached to the upper body. For a couple of the patients, this image presented problems related to locating the intended side (left or right). No additional projections for marking pain were requested by the patients.
Patients were, in general, positive to the CPBM tool, and commented on how they would like to use it for private purposes.
Questionnaire results
The SUS and TAM questionnaires indicated that the patients found the CPBM easy to use. The majority of the patients thought that using CPBM would make it easier to communicate their pain and give them a higher sense of control in the pain communication with their HCPs (Tables 2 and 3).
Results from the System Usability Scale (SUS) questionnaire from 33 patients pilot testing the CPBM (1, strongly disagree; 5, strongly agree).
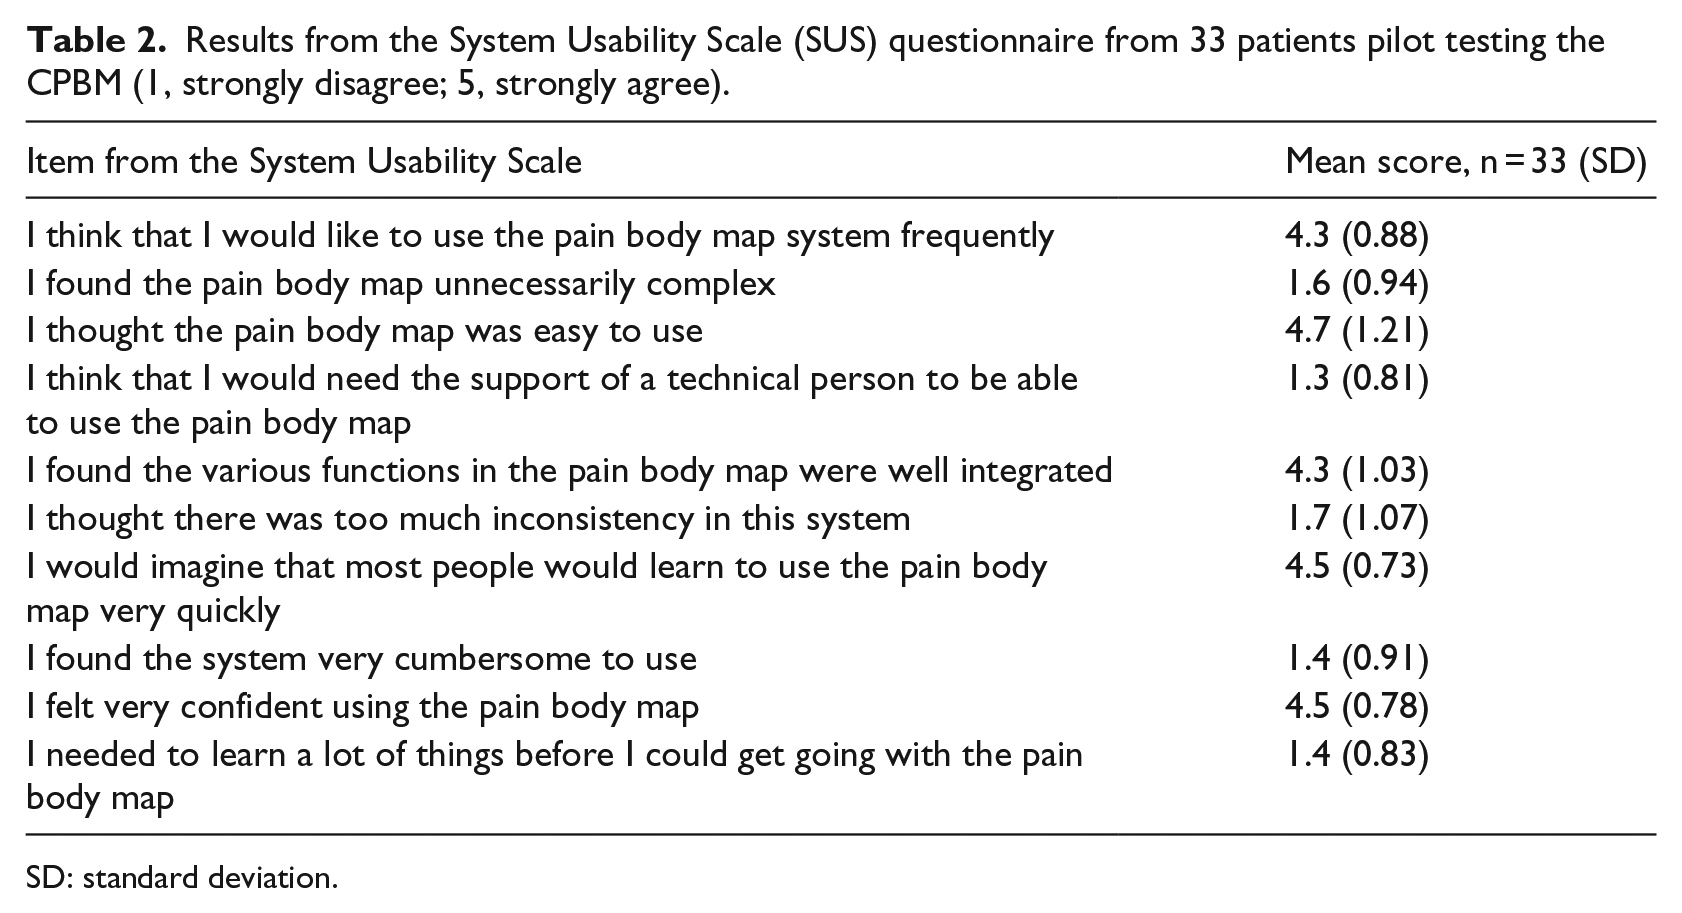
SD: standard deviation.
Results from the Technology Acceptance Model (TAM) questionnaire from 33 patients user-centered testing the CPBM (1, strongly disagree; 5, strongly agree).
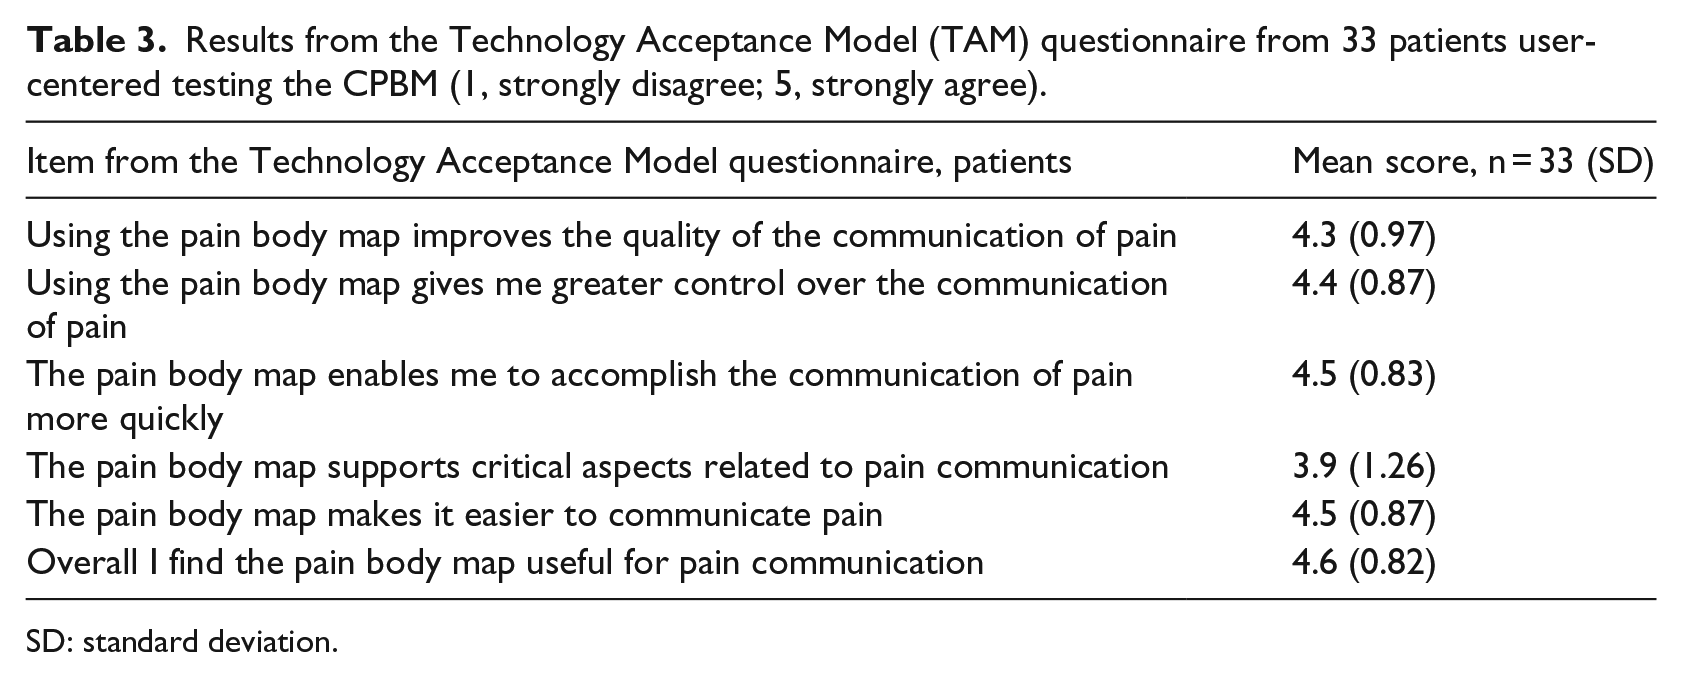
SD: standard deviation.
Post-test interviews
Evaluation of content
Most patients liked the triage of three colors. They commented that it made selecting pain intensity easier. One patient did not want the triage presented as a traffic light system, because fine changes in intensity over time would not be displayed by a change in color.
Context of use
The majority of the participants approved of the system and thought it would be very helpful in a conversation with their treating physician or pain specialist. Self-monitoring of pain was also considered helpful, observing changes on a day-to-day or through the day basis. One patient suggested that longitudinal self-monitoring as opposed to one single measure would be more useful in the conversation with the physician. Several patients liked the idea of using the CPBM for communication with family and friends. The patients evaluated the tool from their personal perspectives. The sharing of information was based on their own personal needs, and not on serving the needs of a HCP.
Two patients did not see any point in using the tool and would rather communicate with the pain specialist without the support of a pain drawing. One of the two said he would communicate better and more quickly without having to use the tool.
Suggestions for improvement
The suggestions for improvement were mainly related to integration of a feature showing when the markings were made (temporal domain). The patients also wanted to annotate pain in relation to activity, for example, pain when walking or standing.
Study 2—HCP study
A total of 19 HCPs were included in the study. All HCPs were experienced physicians practising palliative care as a palliative medicine specialist, oncologist, pain specialist, or GP, in Norway (N = 15) or Scotland (N = 4).
TAM questionnaire
The HCPs perceived that using the CPBM system would improve the pain communication between patients and HCPs. They also perceived the system to be a helpful tool when communicating with a colleague about a patient in pain. The results from the TAM questionnaire are displayed in Table 4.
Results from the Technology Acceptance Model (TAM) questionnaire from 19 healthcare professionals (HCPs) evaluating the CPBM system (1, strongly disagree; 5, strongly agree).
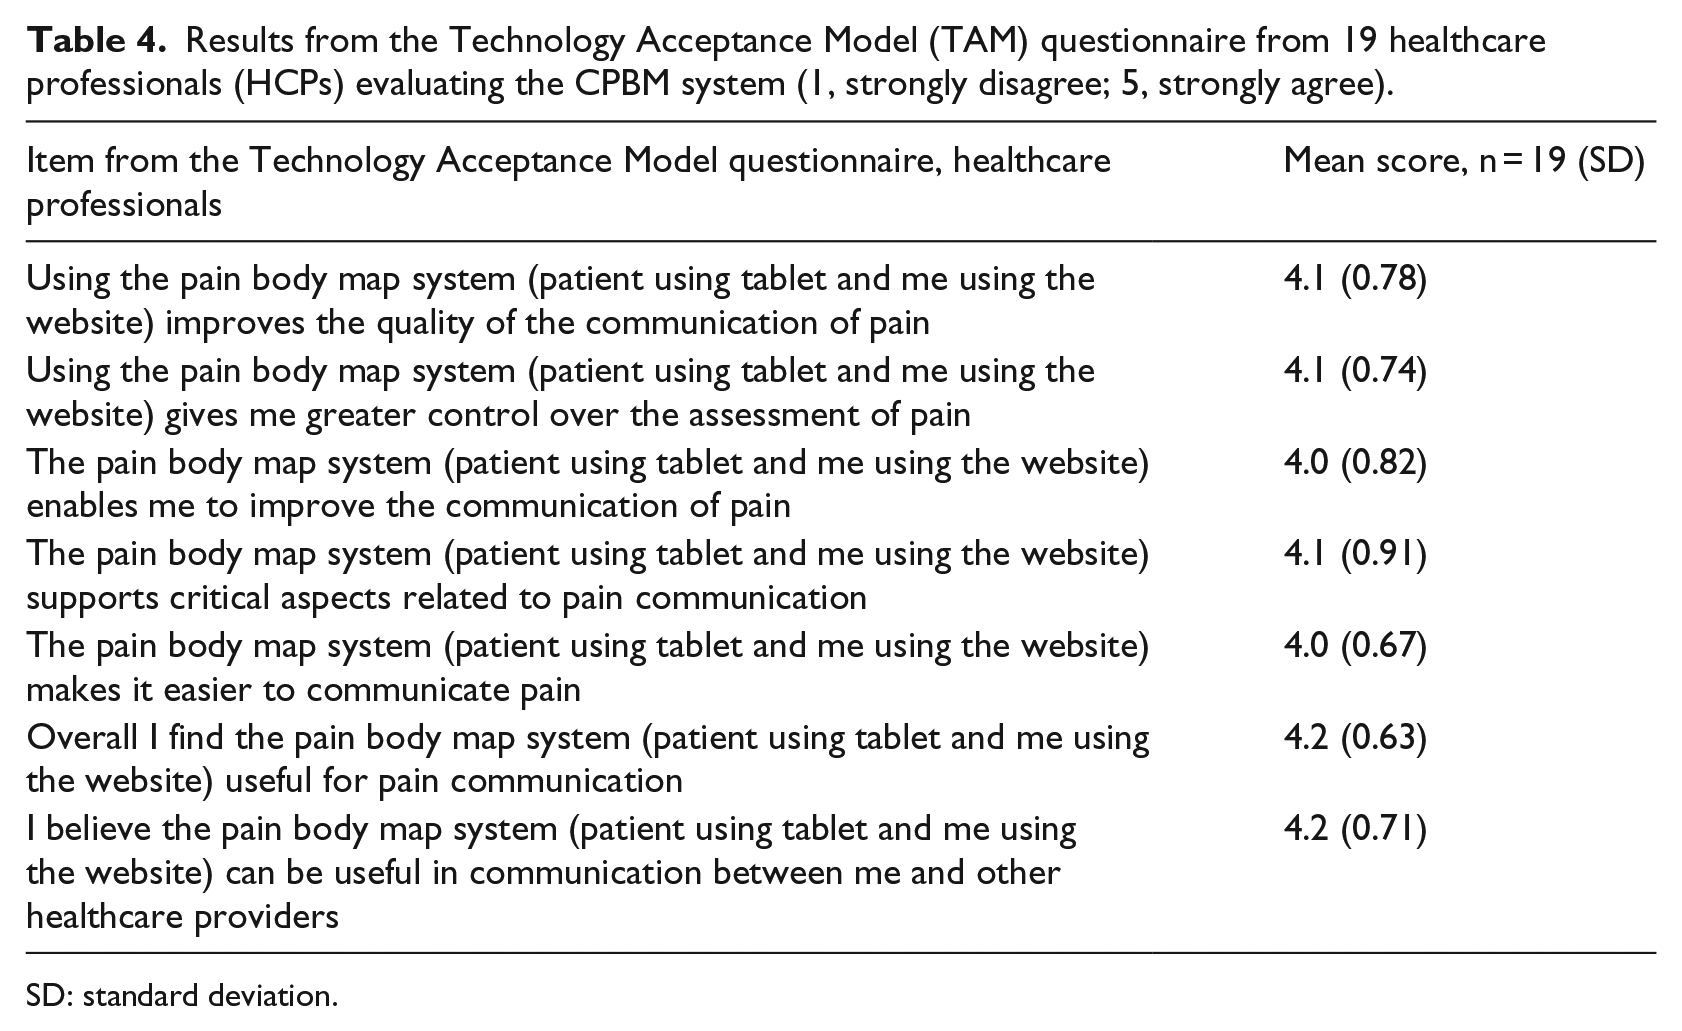
SD: standard deviation.
Focus-group interviews
Five focus-group interviews were conducted. The HCPs’ overall impression of the system was a good support for pain assessment by improvement of the pain communication with the patient as well as support for communication between colleagues.
The HCPs’ responses in the group interviews were analyzed and categorized by three focal themes: technical aspects, clinical aspects, and organizational aspects pertaining to the use of the CPBM. The HCPs’ main perceived strengths and concerns related to the CPBM system are listed in Table 5.
Focal themes from five focus-group interviews with healthcare professionals (n = 19) evaluating the CPBM.
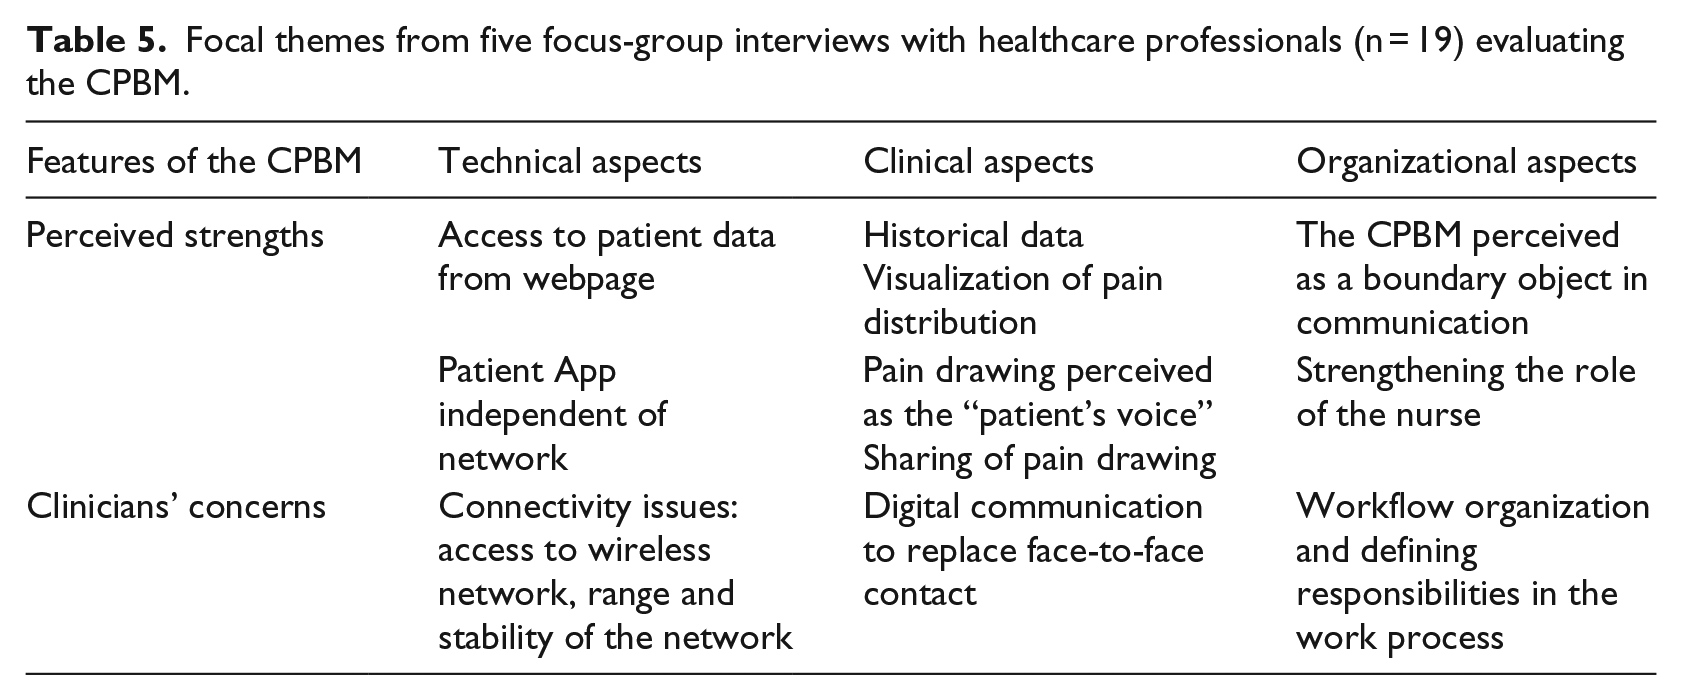
Technical aspects
A system providing access to patient data independent of administrative healthcare level, discipline, and location was considered a great benefit. HCPs working in hospitals had experience of areas with no or limited wireless network coverage.
Participants in the Norwegian focus groups expressed concerns related to the lack of integration of the clinician’s webpage into the electronic health record (EHR). These HCPs assumed that to log on to an additional webpage outside the EHR would be too cumbersome in clinical practice.
Compromising patient security and privacy was mentioned in several groups when discussing current guidelines, norms, and regulations for implementation of digital tools in healthcare settings. The HCPs showed a high level of awareness of issues pertaining to information security and interoperability of digital tools.
The simplicity of the tool was considered a great benefit among many of the HCPs: the pain body map can also engage the patients a bit more because I think patients struggle sometimes with some of the questions we ask them.
Clinical aspects
The HCP interface of the CPBM was perceived to display historical pain data from the patient in a good way: Currently pain management tends to be supported by a paper pain assessment tool, During the conversation with the patient we don’t have a presentation of the history as displayed here.
This type of information was considered important in palliative care where changes in pain intensity or location could indicate treatment response and/or disease progression. The HCPs also considered the pain distribution on the CPBM to be more accurate than the drawings they were used to. The concepts of sharing visual information and vizualization of pain as displayed were commented on: could possibly change the way we communicate about pain today.
One theme for the focus groups was whether the visual pattern on the patient’s pain drawing could give additional information with regard to pain etiology. One participant outlined a case in which a written referral from a GP described a patient with back pain, which later proved to be a case of spinal cord compression. The description of the patient’s pain from the referral letter did not trigger a rapid response from the HCP, but if the patient would draw his or her pain and you would see it on the screen, you’d be like: “I’ve seen that picture before”
and the HCP commented that it would have been more likely that the severity of the situation would have been understood.
The different colors visualized on the screen were seen as a strength: one of the strengths of the tool is in terms of cross-disciplinary discussion. The visualization of the pain can’t be ignored.
One comment was about using the CPBM in reports: It becomes easier to write a report since all the information is in a drawing.
Ideally, the HCP should describe each of the patient’s pain sites in the health record. This means the HCP would have to describe the exact anatomical location, extension, and possible radiation of the pain, in addition to the severity. All this information is possible to capture from the pain drawing and thus easier to document in the patient record.
Some of the participants compared the system to how some HCPs practise pain assessment today, with the HCP asking the patient where it hurts, and filling in the painful areas on a paper PBM on the patient’s behalf. In the interview, the researchers emphasized that the patients must fill in the CPBM themselves, giving no room for the HCP to influence the patient data before viewing it on the screen. However, some of the HCPs uttered concerns that easy access to information from digital devices could replace the face-to-face contact between patients and physicians: the iPad should not be a substitute for a doctor’s appointment.
Organizational aspects
From an organizational point of view, the HCPs considered the webpage to be a “shared space” that could be used to reach a common understanding when discussing a patient’s pain problem between hospital physicians, the GP, the physiotherapist, and/or community nurses. This was considered a great benefit, and more reliable than the traditional oral or written exchange of information.
This way of organizing information was considered an opportunity for transparency and more effective pain management, as well as simplifying sharing of information. The CPBM was also perceived to support a handover situation, either between colleagues working in the same organization, or between colleagues working at different levels of healthcare delivery.
The patient voice perspective was also commented on, especially when nurses ask doctors to provide better pain management on behalf of a patient in pain. The CPBM was considered a valuable tool and even described as a “powerful” tool, enabling the nurse to highlight the “patient’s voice” and consequently give added credibility to the nurses’ concerns on behalf of the patients: Using the CPBM would both change the way we work and might also change the way we communicate and the content of the communication.
Some of the HCPs expressed concern about using technology such as the CPBM in clinical care, and argued that in order to implement the tool, a work process would need to be defined in terms of responsibilities along the chain of healthcare delivery: use of the same tool and providing sufficient training require a lot of effort.
However, if patients would understand the context and the questions asked during the pain assessment, they might be more involved in the pain conversation, the HCPs opined. Eventually, this could also support shared decision-making in pain management.
Suggestions for improvement
The HCPs had some of the same suggestions for improvement as the patients: to include a temporal dimension, pain in relation to activity, and medication. The option for annotation was already included in the webpage and could be used for these purposes. The HCPs also suggested additional ways to display longitudinal data to provide a quick visual interpretation, for example, a graph for pain intensity.
Many of the physicians suggested inclusion of pain qualities. Some thought that information about pain quality should be entered by the patients, while others thought this was something that patients and HCPs should discuss during the consultation and jointly annotate on the webpage.
Discussion
In this project, we have redesigned the CPBM to fit the needs of patients with neuropathic cancer-related pain. Patients in this study confirmed that the tool provided a good interface for a visual presentation of the neuropathic pain they experienced. Patients as well as HCPs thought the tool would be useful in a pain communication setting. Additionally, the HCPs found the display of historical data as well as the visual prompt useful for decision-making and communication.
The HCPs in this study were interested in the tool and how it might influence and be useful in their clinical work. Although pain in this patient population is highly prevalent, commercially available digital tools usually lack scientific evidence and are therefore not eligible for clinical practice. 36 However, scientifically tested pain tool applications are mostly not commercially available and therefore not a part of clinical practice. 36
Aspects of assessments
The goal of a pain assessment is to map a subjective experience to create a common understanding of the problem before dealing with it. A mandatory prerequisite is the evaluation of the validity of the data. Observations in this study confirmed that patients with cancer-related neuropathic pain were able to recognize the area on the CPBM to mark their pain and could use the CPBM to provide useful information for HCPs. Visual representation of pain is an easier and more efficient way of communicating than a written text. 14 In this study, we explicitly asked patients to provide as accurate information as possible about pain location, extent, radiation, and intensity. The accuracy of the information was confirmed by the patient. The diagnosis of neuropathic pain was verified by a physician, but the accuracy of the information on the CPBM was not confirmed by a clinical examination. However, the information retrieved from examining the pain pattern and reviewing historical data on the webpage adds to the clinical information without depending on the patient’s memory.
The green–amber–red triage system was perceived useful for selecting pain intensity by the patients, as well as for visualization of severity by the HCPs. A recent study on a pain intensity triage similar to the one in the CPBM, also associated with an algorithm for pain management, showed promising results in prompting clinical action. 37 Prompting action was also one of the perceived qualities from the HCPs in our study. Additionally, previous studies have suggested that frail and cognitively impaired patients, for example, patients with dementia, prefer fewer response options than the commonly used NRS 0–10. 38 Thus, both the numbered groups and the visual color code may help patients categorizing numbers on an intensity scale.
Clinical decision-making
The prevalence of cancer-related neuropathic pain varies between studies.5,10,39 However, due to increased survival rate of cancer patients, and the profile of side-effects of cancer treatments, the prevalence of neuropathic cancer pain is likely to increase. Thus, a timely recognition of the problem is needed.
In this study, HCPs considered pain drawings as one way to highlight neuropathic pain patterns. A neuropathic pain pattern is proposed as a compulsory diagnostic criterion for neuropathic cancer pain, in addition to a history of a relevant lesion affecting the somatosensory system. 40 Even though pain information was regarded as very useful and important for decision-making among the HCPs in our study, evidence indicates that pain is poorly reported in the health record.11,12,41
Patient involvement
Both patients and HCPs perceived that using the CPBM system for pain communication facilitated sharing of pain information in an accurate and accessible manner.
In a previous study, we demonstrated how usability problems in an earlier version of the CPBM could hamper patient involvement in the pain assessment. 24 The current version is developed with and for users with special needs, in a similar way as previously documented. 42 Thus, tailoring the ICT tool to the patient user must be considered another key prerequisite to increase user involvement in communication and shared decision-making. This aspect was specifically commented on by the HCPs in our study. They perceived the pain drawing to represent the patient’s experience and interpretation of their situation. When discussing the patient’s pain problem with colleagues, the pain drawing was a way to include the patient’s voice, also facilitating a response in line with the patient’s wishes.
Coordination of services
The CPBM system is a simple tool connecting patients and HCPs. Its features are very similar to the paper PBM, but, as our study shows, it is perceived to be substantially different in terms of usage. The system was perceived to have potential for organizational impact which could change and improve clinical practice, allowing for more transparent decision-making and easier information-sharing across services. This shows how a small-scale system may influence healthcare delivery 43 as well as display the same qualities and challenges as a large-scale EHR system.44,45
The patients in this study have a chronic condition, and live their lives outside the hospital. Complex pain management often requires specialist support. An information and communication tool that can connect the patient with the team of healthcare providers and facilitate assessment and follow-up may contribute to more efficient pain management. These aspects are central to patient-centered care.46,47
Currently, there are few ICT systems focusing on the quality of the treatment. The comparison of longitudinal data from the same patient in different settings and situations could provide some of the needed information on treatment response or progression of disease.46,47 The concept of sharing longitudinal information about pain across levels of services represented a new way of working for the HCPs involved in this study, both in Norway and Scotland. The HCPs considered that access to the same information could make the handover situation safer, and make it easier to give professional support to other HCPs.
Limitations
The testing of HCP software in this study was performed in a selected group of stakeholders. The actual stakeholders for pain management in patients with palliative care needs are a much wider group. Contributions from nurses, more GPs, physiotherapists, and even occupational therapists would have strengthened our data. The patient population included in this study did not include patients with cognitive impairment.
Patient participation in this study took place in relation to a scheduled appointment with a pain specialist. In clinical research, there is always a risk that patients’ decisions to participate may be influenced by fear of any consequences if they decline. To make sure that the patients participated voluntarily, we emphasized that non-participation would have no consequence for their treatment. Furthermore, we emphasized that participation in the study would not influence their pain management, since the pain specialists in any case would do their own assessment before or after our testing. The information from the CPBM was thus an add-on in this situation.
The patients were aware of the test personnel’s involvement with the tool, and were asked to give honest feedback that in turn would enable us to improve the software. We clearly had the impression that the patients acknowledged that their input could influence the final product. The fact that they anonymously responded very positively on the SUS and TAM questionnaires supports the impression that the patients were satisfied with the tool and that their engagement and involvement represented true interest. However, we have no solid evidence to confirm that this actually was the case.
The tool was tested and evaluated by HCPs in a hypothetical setting. This means that their feedback was related to the idea of the tool and not the hands-on testing and consequently represents their impressions and not solid empirical results based upon use in real-life situations.
Further work
The safety and efficiency of the CPBM system in clinical practice need to be examined in a study designed for this purpose. In this context, the proposed definition of safety is related to reliability with regard to recognition of patients with severe pain. The proposed definition for efficiency is related to the recognition of patients with mild pain. HCPs and patients in this study have also made valuable suggestions for improvement which need to be considered.
This study also provided us with an interesting observation. HCPs in Norway and Scotland responded differently to using Internet-based tools in clinical practice. In Norway, the general idea was that the CPBM concept needed to be integrated into the EHR in order to be perceived as a viable option, whereas this was not mentioned among the respondents from Scotland. The different perceptions might be based on how Norwegian HCPs are conditioned using the current EHR system, but this should be explored in further studies.
Rapid recognition of pain patterns that allow HCPs to identify syndromes that need immediate medical attention, for example, spinal cord compression, is also an important part of clinical decision-making. This requires more evidence on the visual presentation of pain, which needs to be explored in further studies.
Finally, there is a large gap in knowledge regarding how to improve the clinical decision-making process. There are currently many analogue and digital tools available to support this process, but evidence shows that improvement of the decision-making process has to be seen in a much wider context, including, for example, behavioral and educational issues. 48
Conclusion
Our study confirmed the usability of the CPBM in patients with cancer-related neuropathic pain. Both patients and HCPs considered the CPBM system to be useful in a pain communication setting. The webpage presenting the data to HCPs was seen to provide easy and rapid recognition of pain intensity and location, as well as changes in both. The HCPs especially reported satisfaction with the historical pain information, which they perceived not to be readily available in the current patient record. The CPBM concept was perceived to support clinical decision-making, increase patient involvement, and have the potential to improve coordination of services. In conclusion, this means that the CPBM system was perceived to facilitate and improve coordinated pain management.
Footnotes
Acknowledgements
The authors thank patients from the Palliative and Supportive Care Clinic at Western General Hospital and physicians in Scotland and Norway for participating in the study; Debra Gordon for assisting in recruitment of patients; Kim Sladdin and Al Clarke, and all of Professor Marie Fallon’s research group for support, feedback, and assistance when needed; Marianne Jensen Hjermstad for useful feedback on the manuscript; and Martin Gilje Jaatun and Harriet Harris for proof reading and support through the project. Last, but not least, thanks to Russel Moser and Julie Geyer Moser of TellTale Solutions for their substantial contributions in tailoring the program to patients and developing the website for HCPs.
Author contribution
E.A.A.J., A.K.-P., K.H., and D.F.H. contributed to the writing of the manuscript. E.A.A.J., M.F., and A.K.-P. were responsible for study 1; E.A.A.J., K.H., and D.F.H. for study 2. All authors approved the final manuscript.
Availability of data and materials
The datasets supporting the conclusions of this article are included within the article.
Declaration of conflicting interests
The author(s) declared no potential conflicts of interest with respect to the research, authorship, and/or publication of this article.
Funding
The author(s) disclosed receipt of the following financial support for the research, authorship, and/or publication of this article: This paper is part of the first author’s PhD project which was funded by the Liaison Committee for Education, Research and Innovation in Central Norway.