
Abstract
Background
Pain continues to be a difficult and pervasive problem for patients with cancer, and those who care for them. Remote health monitoring systems (RHMS), such as the
Methods
Participants used the BESI-C system for 2-weeks which collected data via EMAs deployed on wearable devices (smartwatches) worn by both patients with cancer and their primary family caregiver. We developed three unique EMA schemas that allowed patients and caregivers to describe patient pain events and perceived impact on quality of life from their own perspective. EMA data were analyzed to provide a descriptive summary of pain events and explore different types of data visualizations.
Results
Data were collected from five (n = 5) patient-caregiver dyads (total 10 individual participants, 5 patients, 5 caregivers). A total of 283 user-initiated pain event EMAs were recorded (198 by patients; 85 by caregivers) over all 5 deployments with an average severity score of 5.4/10 for patients and 4.6/10 for caregivers’ assessments of patient pain. Average self-reported overall distress and pain interference levels (1 = least distress; 4 = most distress) were higher for caregivers (
Conclusion
Collecting data via EMAs is a viable RHMS strategy to capture longitudinal cancer pain event data from patients and caregivers that can inform personalized pain management and distress-alleviating interventions.
Keywords
Introduction
Pain continues to be a difficult and pervasive problem for patients with cancer, and for those who care for them. Estimates vary, but between 30 and 90% of patients with cancer will experience pain during their illness, and almost 40% will experience under- or untreated cancer pain, with those with advanced stage disease especially at risk1–5. Cancer-related pain can have multiple etiologies, such as the tumor pressing on bones, nerves, or tissues, or side effects from therapy (e.g., chemotherapy, surgery, radiation), and can manifest in distressing physical and emotional symptoms. Not surprisingly, patients with cancer and poorly managed pain experience lower quality of life, with significantly higher rates of anxiety and depression. 6 Poorly managed cancer pain is often particularly distressing in the home setting, where family caregivers may assume a large role in symptom management, but generally have little, if any, training in how to manage pain7–14. Breakthrough pain events—those that abruptly increase from baseline—can be especially distressing and difficult to manage.3,15,16 Geography can further compound the problem, with patients and caregivers living in rural areas experiencing additional challenges in accessing cancer care and pain management services.17,18
Remote Health Monitoring Systems (RHMS) are increasingly being developed and deployed to monitor and manage symptoms within diverse patient populations. RHMS utilize a broad range of technologies (such as wearable devices, telehealth platforms, smart phones, and environmental and biosensors) that can passively (without user engagement) or actively (with user engagement) gather health-related data that can help guide patient care. 19 Another key feature of robust RHMS is their ability to facilitate a bilateral remote connection between patients and healthcare providers by allowing patients to provide key information to providers who can then use these data to improve patient care. Importantly for this study, RHMS can generate data that provide a more holistic understanding of the patient and family experience of cancer pain within the home context (where most patients experience difficult symptoms) and extend the reach of healthcare in rural areas. This enhanced understanding of cancer pain can, in turn, inform more personalized and effective pain management and distress-alleviating interventions (for both patients and family caregivers), which could reduce unwanted emergency room visits or dis-enrollments from hospice programs due to uncontrolled pain. Additionally, sharing data collected by RHMS with patients and family caregivers can also potentially improve self-efficacy in managing symptoms, which in itself can be a key factor in decreasing pain and emotional distress.20,21
The essential need to support family caregivers in the home is receiving increasing attention in the literature and serves as a primary motivation for this research. For example, in a recent survey of 600 hospice agencies regarding research priorities relevant to hospice, improving the provision of in-home hospice services—which includes support for family caregivers and finding ways to ensure optimal pain management—were found to be among the top priorities. 22 Relatedly, an analysis of recommendations from leading national U.S. family caregiving reports found that caregiver assessment and support—and more specifically caregiver education and training—was a key priority. 23
This paper presents findings from pain events recorded by patients with advanced cancer and their primary family caregivers while pilot testing the
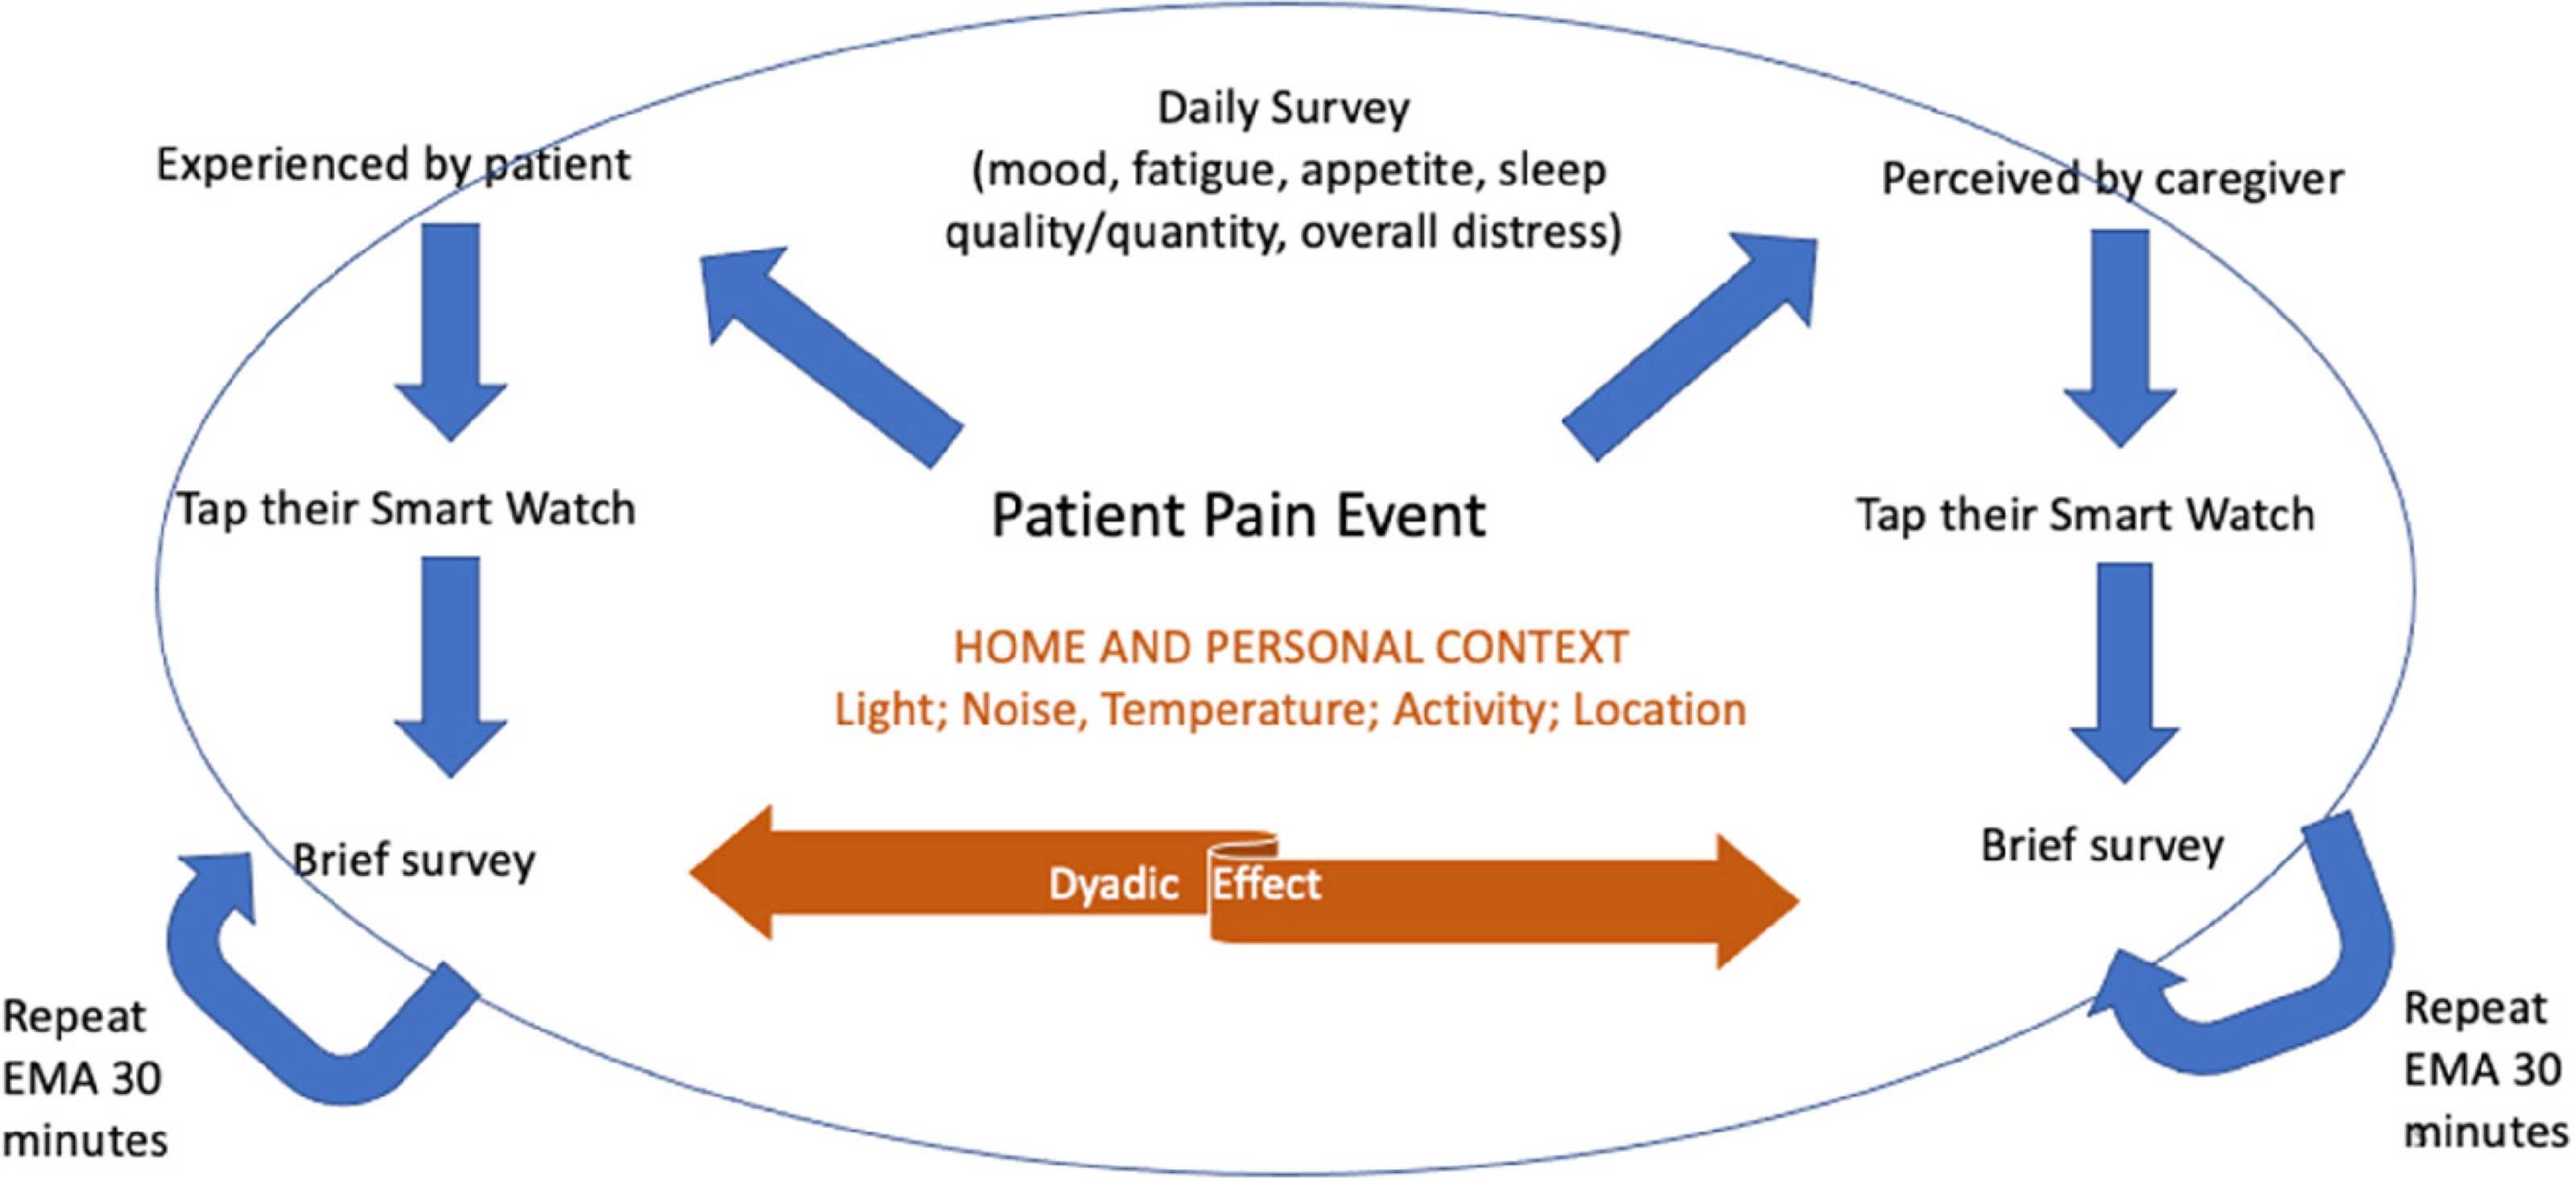
Overview of the BESI-C remote health monitoring data collection system.
Summary of BESI-C variables and sensing modalities*. This paper focuses on the EMA data.

*First printed in JMIR Research Protocols. Reprinted with permission and in accordance with the terms of the Creative Commons Attribution License (https://creativecommons.org/licenses/by/4.0/), which permits unrestricted use, distribution, and reproduction in any medium, provided the original work, first published in JMIR Research Protocols, is properly cited. 25 https://www.researchprotocols.org/2019/12/e16178/
In this paper, we describe cancer-related pain events reported by patient and caregiver participants through BESI-C's three unique EMA schemas and explore ways to share collected data through visualizations. A goal of this paper is to provide examples of the type and range of data able to be collected and analyzed by RHMS, such as BESI-C, and to offer ideas about how to visually display such data, which can be challenging.28,29 We focus this paper on EMAs and data visualizations as they are recognized approaches that can leverage precision health to enhance health equity. 30
Methods
Developing the ecological momentary assessment (EMA) schemas
EMAs are brief surveys deployed on mobile devices designed to capture relevant data in naturalistic settings in real-time 31 and can be an important data source for RHMS. EMAs are particularly helpful in capturing information related to highly dynamic events and behaviors (such as, with BESI-C, pain events and medication use) and allow participants to self-report other critical contextual data, such as their emotional state or activity level, while these events are occurring. 30
For BESI-C, we created three unique EMA schemas: (1) on-demand, user-initiated EMAs to record pain events (i.e., ‘initial pain EMAs’); (2) automatically generated pain EMAs deployed 30-min after a participant indicated the patient took an opioid for a pain event (i.e., ‘follow-up pain EMAs’); (3) automatically generated EMAs each evening (i.e., ‘daily survey EMAs’) to assess other factors that can influence pain, such as sleep quality, mood and activity level. 32 These EMA schemas were built into our custom BESI-C WearOS mobile application which was deployed on smartwatches (Fossil Sport Gen 4) worn by both patients and family caregivers.
Development of the EMA schemas was informed by: close collaboration and consultation with clinical partners; input and feedback from patients and caregivers; the cancer pain literature; and also by our objective to make the smart watch user interface (UI) as low-burden, efficient and intuitive as possible. For example, while there are many well-known and validated tools to assess cancer pain, such as the Brief Pain Inventory, 33 many of these instruments are multi-item and not feasible to deploy on a wearable device using the brief EMA format. As our primary goal was to capture in-the-moment episodes of breakthrough pain,3,15,16 while minimizing participant burden, we prioritized simple, single item measures, which are commonly used when collecting patient-reported outcome data34,35 and can be equally as effective as multi-item subscales.36,37 We also were particularly interested in understanding the impact of opioid medications on patient pain and reasons why patients may not take opioids, even if they reported being in pain. Table 2 displays the EMA schema used for our first five pilot deployments reported on in this paper.
Ecological momentary assessment (EMA) questions and response options deployed on the smartwatch worn by patients and caregivers to record pain events.

*Based upon the Numeric Rating Scale,38,39 a common way to assess pain intensity based on a 0 (no pain) to 10 (worst pain imaginable) scale; we omitted ‘0’ as an option with this question as we confirmed in question 1 that pain was present. ^Question was added after deployment 1. ^^This question was omitted during deployments 2 and 3 on the patient's watch due to a technical issue.
Data collection and analysis procedures
Approval was granted by the UVA Health Science IRB (#21017) and all participants signed informed consent prior to data collection. Data collection occurred between April 2019–December 2019 and procedures have been described in detail elsewhere. 26 Briefly, we recruited dyads of patients with advanced cancer and their primary family caregivers from the outpatient palliative care clinic of an academic cancer center in the Southeastern U.S. All patients had a history of difficult cancer pain, were prescribed short-acting opioids, and lived with a primary family (informal, unpaid; family defined broadly) caregiver who also agreed to participate. Participants used the BESI-C system in their home for approximately 2 weeks and were asked to record cancer-related pain events on their respective smartwatch (e.g., patient asked to record a pain event if they were experiencing pain; caregivers asked to record a pain event if they perceived the patient was experiencing pain). Patients were instructed to consider pain events for this study as any increase in pain that they felt was related to their cancer cancer (e.g., if pain was from a stubbed toe they did not need to record that event). Family caregivers were instructed to record a pain event when they felt, from their perspective, the patient was experiencing cancer-related pain. While this study primarily captured physiological cancer-related pain events (e.g., those that manifested with nociceptive or neuropathic symptoms 40 ), we intentionally did not provide patients and caregivers with overly prescriptive instructions as to how they should consider ‘cancer related pain’ as we wanted participants to have the flexibility to interpret and report their unique experience with pain. It is important to note that within our EMA schemas we strove to capture both physiological and biopsychosocial dimensions of cancer pain by asking questions related to, for example, pain ‘intensity/severity’ as well as ‘distress’, which we counseled participants to interpret however they felt most appropriate. Study team personnel emphasized to participants that their own unique perspective was valued and that there were no ‘right’ or ‘wrong’ interpretations of pain events.
For each deployment, we collected a total of over 20GB heterogenous data (Table 1) that was cleaned and analyzed using Python programming language. 41 The primary, overall goal of analyses for this pilot study was to summarize descriptive elements of the deployment (e.g., how many pain events were recorded by patients and caregivers and at what severity level) and conduct preliminary analysis to explore patterns between actively and passively collected data (e.g., how environmental data may influence pain and distress ratings) and possible signals predictive of pain events using correlation analysis and machine learning techniques. This paper focuses on our EMA data, specifically: (1) the descriptive analysis and concordance of reported pain events between patients and caregivers; and (2) examples of related data visualizations that could be shared with clinicians, patients, and caregivers. Future publications will discuss correlation of pain events with environmental and physiological contextual data.
De-identified EMA data were securely off-loaded from local devices, cleaned, and analyzed to provide a descriptive summary of pain events and explore different types of data visualizations that could be shared with clinicians, patients, and caregivers. To prepare EMA data for analysis, across all deployments for patients and caregivers, we excluded: (1) ‘practice’ EMAs generated during dyad education prior to active deployment data collection (n = 96); (2) ‘false’ EMAs where participants reported ‘not in pain’ but due to a technical error a follow-up EMA was mistakenly generated (n = 18); and (3) ‘incomplete’ EMAs, where an EMA was started, but was not finished or submitted within the 15-min allowed completion window (n = 13). Additionally, we handled duplicate (n = 16) or edited/amended (n = 6) EMAs (i.e., two EMAs submitted within a 1-min window of each other with identical or similar answers) by keeping the most recently submitted EMA for analysis. In total, we excluded 53 (n = 53) intra-deployment EMAs from analysis. After EMA data were cleaned and descriptively summarized, data visualizations were created using Excel, as well as Python programming language, which allows for customizability of the visualizations’ appearance and style by adjusting coding parameters.
Results
Data were collected from five (n = 5) patient-caregiver dyads (total 10 individual participants, 5 patients, 5 caregivers); demographic and sample details have been reported elsewhere. 26 Briefly, the majority of participants were between 55 and 74 years of age (8/10, 80%), female (6/10, 60%), living in a rural setting (8/10, 80%), and White (6/10; 60%). Three out of 5 (60%) patients were diagnosed with head and neck cancer; the others included colorectal (1/5, 20%) and lung (1/5, 20%) cancers.
Below, we provide a descriptive summary of EMA results as well as example data visualizations that explore ways to depict the contextual experience of advanced cancer pain in the home setting using data collected via BESI-C.
Overview of self-reported pain events
Initial pain events
A total of 283 user-initiated initial pain events (198 patient; 85 caregiver) were recorded on participant smartwatches over all 5 deployments with an average severity score of 5.4/10 for patients and 4.6/10 for caregivers (Tables 3 and 4). For patients, 72% (n = 142) of initial pain events were rated with a severity score of 5/10 or higher on the Numeric Pain Rating Scale 38 ; for caregivers, 58% (n = 49) of initial pain events were rated with a severity score of 5/10 or higher. For patients, the most frequent response to ‘how distressed are you?’ was ‘a little’ (n = 88, 44.44%), followed by ‘not at all’ (n = 47, 23.7%); 19 patient responses (9.6%) indicated ‘very distressed.’ For caregivers, responses to ‘how distressed are you?’ were fairly evenly distributed between ‘not at all’ (n = 26, 30.59%), ‘a little’ (n = 27, 31.76%), ‘fairly’ (n = 26, 30.59%); six caregiver responses indicated ‘very distressed’ (n = 6, 7.06%).
Total number of completed EMAs, any response, per deployment by patient and caregiver.

^Pain re-assessment EMAs automatically generated 30-min after an initial pain EMA only if participant indicated the patient took an opioid pain medication. PT : patient; CG : caregiver. Note: this table includes all EMA responses (‘yes’, ‘no’ and ‘unsure’)
Summary of ecological momentary assessment (EMA) responses for initial pain events.

*Mean severity score calculated by summing each deployment's average pain severity, then averaging the summation.
**Column percentages calculated from total number of pain events; ^Question added after deployment 1.
When asked to rate their partner's perceived distress level, almost 50% of patient responses (n = 96, 48.48%) reported their caregiver to be ‘not at all’ distressed; only five patient responses indicated their caregiver to be ‘very distressed’ (n = 5, 2.53%). In comparison, caregivers most frequently indicated the patient was ‘a little distressed’ (33 responses, 38.82%) or ‘fairly distressed’ (n = 26, 30.59%); 9 (n = 9, 10.59%) of caregiver responses reported the patient to be ‘very distressed.’ No caregivers (n = 0; 0%) indicated they were unsure about a patient's distress level, whereas 26 patient responses (n = 26, 13.13%) indicated they were unsure about their caregiver's distress level.
Over 70% of patient responses (n = 141; 71.21%) and caregiver responses (n = 61; 71.76%) indicated that the patient took an opioid for a pain event. Over 8% of the caregiver responses (n = 7; 8.24%) indicated that they were unsure if the patient took an opioid. For both patients and caregivers, the most frequent reason given for not taking an opioid, even though in pain, was ‘not time yet,’ (patients, n = 23, 40.35%; caregivers, n = 8, 47.06%). 19% (n = 11; 19.30%) of patient responses indicated they did not take an opioid because ‘pain was not bad enough.’ No patient or caregiver responses indicated an opioid was not taken due to being out of pills; only 1 (n = 1; 1.75%) patient response reported not taking an opioid due to ‘worried taking too many.’
Follow-up pain events
Follow-up EMAs were generated 30-min after an initial pain event if a participant reported an opioid was taken for the pain. For example, if a patient marked a pain event at 11 am and indicated they took an opioid for the pain, at 11:30 am they would receive a follow-up, pain re-assessment EMA. The first question of the follow-up EMA asked if the patient was still in pain. If a participant responded ‘yes,’ the EMA questions continued. If no, they were exited from the EMA survey and this was considered a pain score of ‘0’ for analysis purposes.
Out of the total 104 follow-up EMAs recorded over all five deployments, half (n = 52; 50.0%) indicated the patient was still experiencing pain, with an average severity score of 4.67/10 for patients and 3.71/10 for caregivers. For patients, almost 50% of follow-up EMAs (n = 20; 47.62%) were rated with a severity score of 5/10 or higher; for caregivers, 80% (n = 8) of follow-up pain events were rated with a severity score of 5/10 or higher.
For patients, the most frequent response to ‘how distressed are you?’ with the follow-up EMA was ‘a little distressed’ (n = 19; 45.24%), followed by ‘fairly distressed’ (n = 12; 28.57%) and ‘not at all distressed’ (n = 9; 21.43%); 2 patient responses (n = 2, 4.67%) indicated ‘very distressed.’ For caregivers, the most frequent response to ‘how distressed are you?’ was ‘not at all’ (n = 8; 44.44%), followed by ‘a little’ or ‘fairly’ both receiving four responses (n = 4; 22.22%); 2 caregiver responses indicated ‘very distressed’ (n = 2; 11.11%).
When asked to rate their perceived partner's distress level, 35.7% of patient responses (n = 15) reported their caregiver to be ‘not at all’ distressed and 23.81% (n = 10) ‘a little distressed’; interesting, 30.95% (n = 13) of patient follow-up EMA responses indicated they were unsure about their caregiver's distress level and 0% (n = 0) reported their caregiver to be ‘very distressed.’ For the follow-up EMAs, caregivers most frequently indicated the patient was ‘not at all distressed’ (7 responses, 38.89%), with three responses of ‘very distressed’ (n = 3; 16.67%) and one response (n = 1, 5.55%) of ‘unsure.’
Over 80% of patient responses (n = 35; 83.33%) and over 50% of caregiver responses (n = 12; 66.67%) indicated another opioid was not taken despite continued pain reported at the follow-up EMA. The most frequent reasons given by patients were ‘pain not bad enough’ (n = 13; 37.14%) and ‘not time yet’ (n = 13; 37.14%), and for caregivers ‘not time yet’ (n = 7; 58.33%) (Table 5).
Summary of responses for follow-up ecological momentary assessments (EMAs).

Note: Follow-up EMAs are generated 30 min after participant reports an initial pain event for which they indicated an opioid was taken.
*No ‘still in pain’ events were reported by CG in deployment 3, so only averages of deployments 1, 2, 4, and 5 were considered. Mean severity score calculated by summing each deployment's average pain severity, then averaging the summation. ^EMA question added after deployment 1.
Daily quality of life surveys
End-of-day EMA surveys were generated to both patients and caregivers each evening and asked 10 Likert-style questions (1 = least/lowest/worst; 4 = most/highest/best) related to overall distress levels, sleep and activity, and degree of social interactions over the past 24-h (see Table 6). Average self-reported overall distress and pain interference levels were higher for caregivers (
Summary of end-of-day survey responses, comparison of mean averages, by total sample and by patient and caregiver, deployments 1–5*.

*1- 4; 1 = least/lowest/worst; 4 = most/highest/best; ^“Unsure” responses excluded from analysis; this question was also not asked to patients during deployments 2 and 3 due to a technical error.
**n = number of EMA responses used to calculate mean. Means were calculated for each deployment and then averaged across all 5 deployments.
Self-reported ratings of sleep quality and mood were lower for patients (
Data visualization explorations
We created data visualizations to explore various ways to represent pain events reported by patients and caregivers. With each visualization, we strove to represent complex data as clearly and accurately as possible with the goal to generate a library of visualizations that could be further developed as more data are collected by BESI-C and ultimately be shared with relevant stakeholders (patients, caregivers, clinicians). We share these below with the hope they will be useful to other researchers who are also exploring how to best share complex symptom management data.
Time wheels: pain events in 24-hours
To provide a ‘snapshot’ view of patient and caregiver reported pain events over the course of a 2-week deployment, we created a ‘pain time wheel’ which displays the number and severity of reported initial pain events in a clocklike arrangement (Figure 2). Initial inspiration for this visualization came from polar plots represented in other disciplinary work.42,43 The center circle represents ‘day 0’ and each concentric circle extending outwards from the center represents a deployment day. Moving clockwise, each radiating spoke represents a 1-h period. The severity of pain events is represented by the color gradient key, with darker shades representing higher-severity pain events. This visualization provides a way for clinicians and other stakeholders to see ‘at a glance’ the number and severity of pain events reported in a 24-h period. For example, in Figure 2, we can see that the patient in deployment two reported few pain events between the hours of midnight and 6 am but has experienced more higher-severity pain events in the late afternoon/early evening.
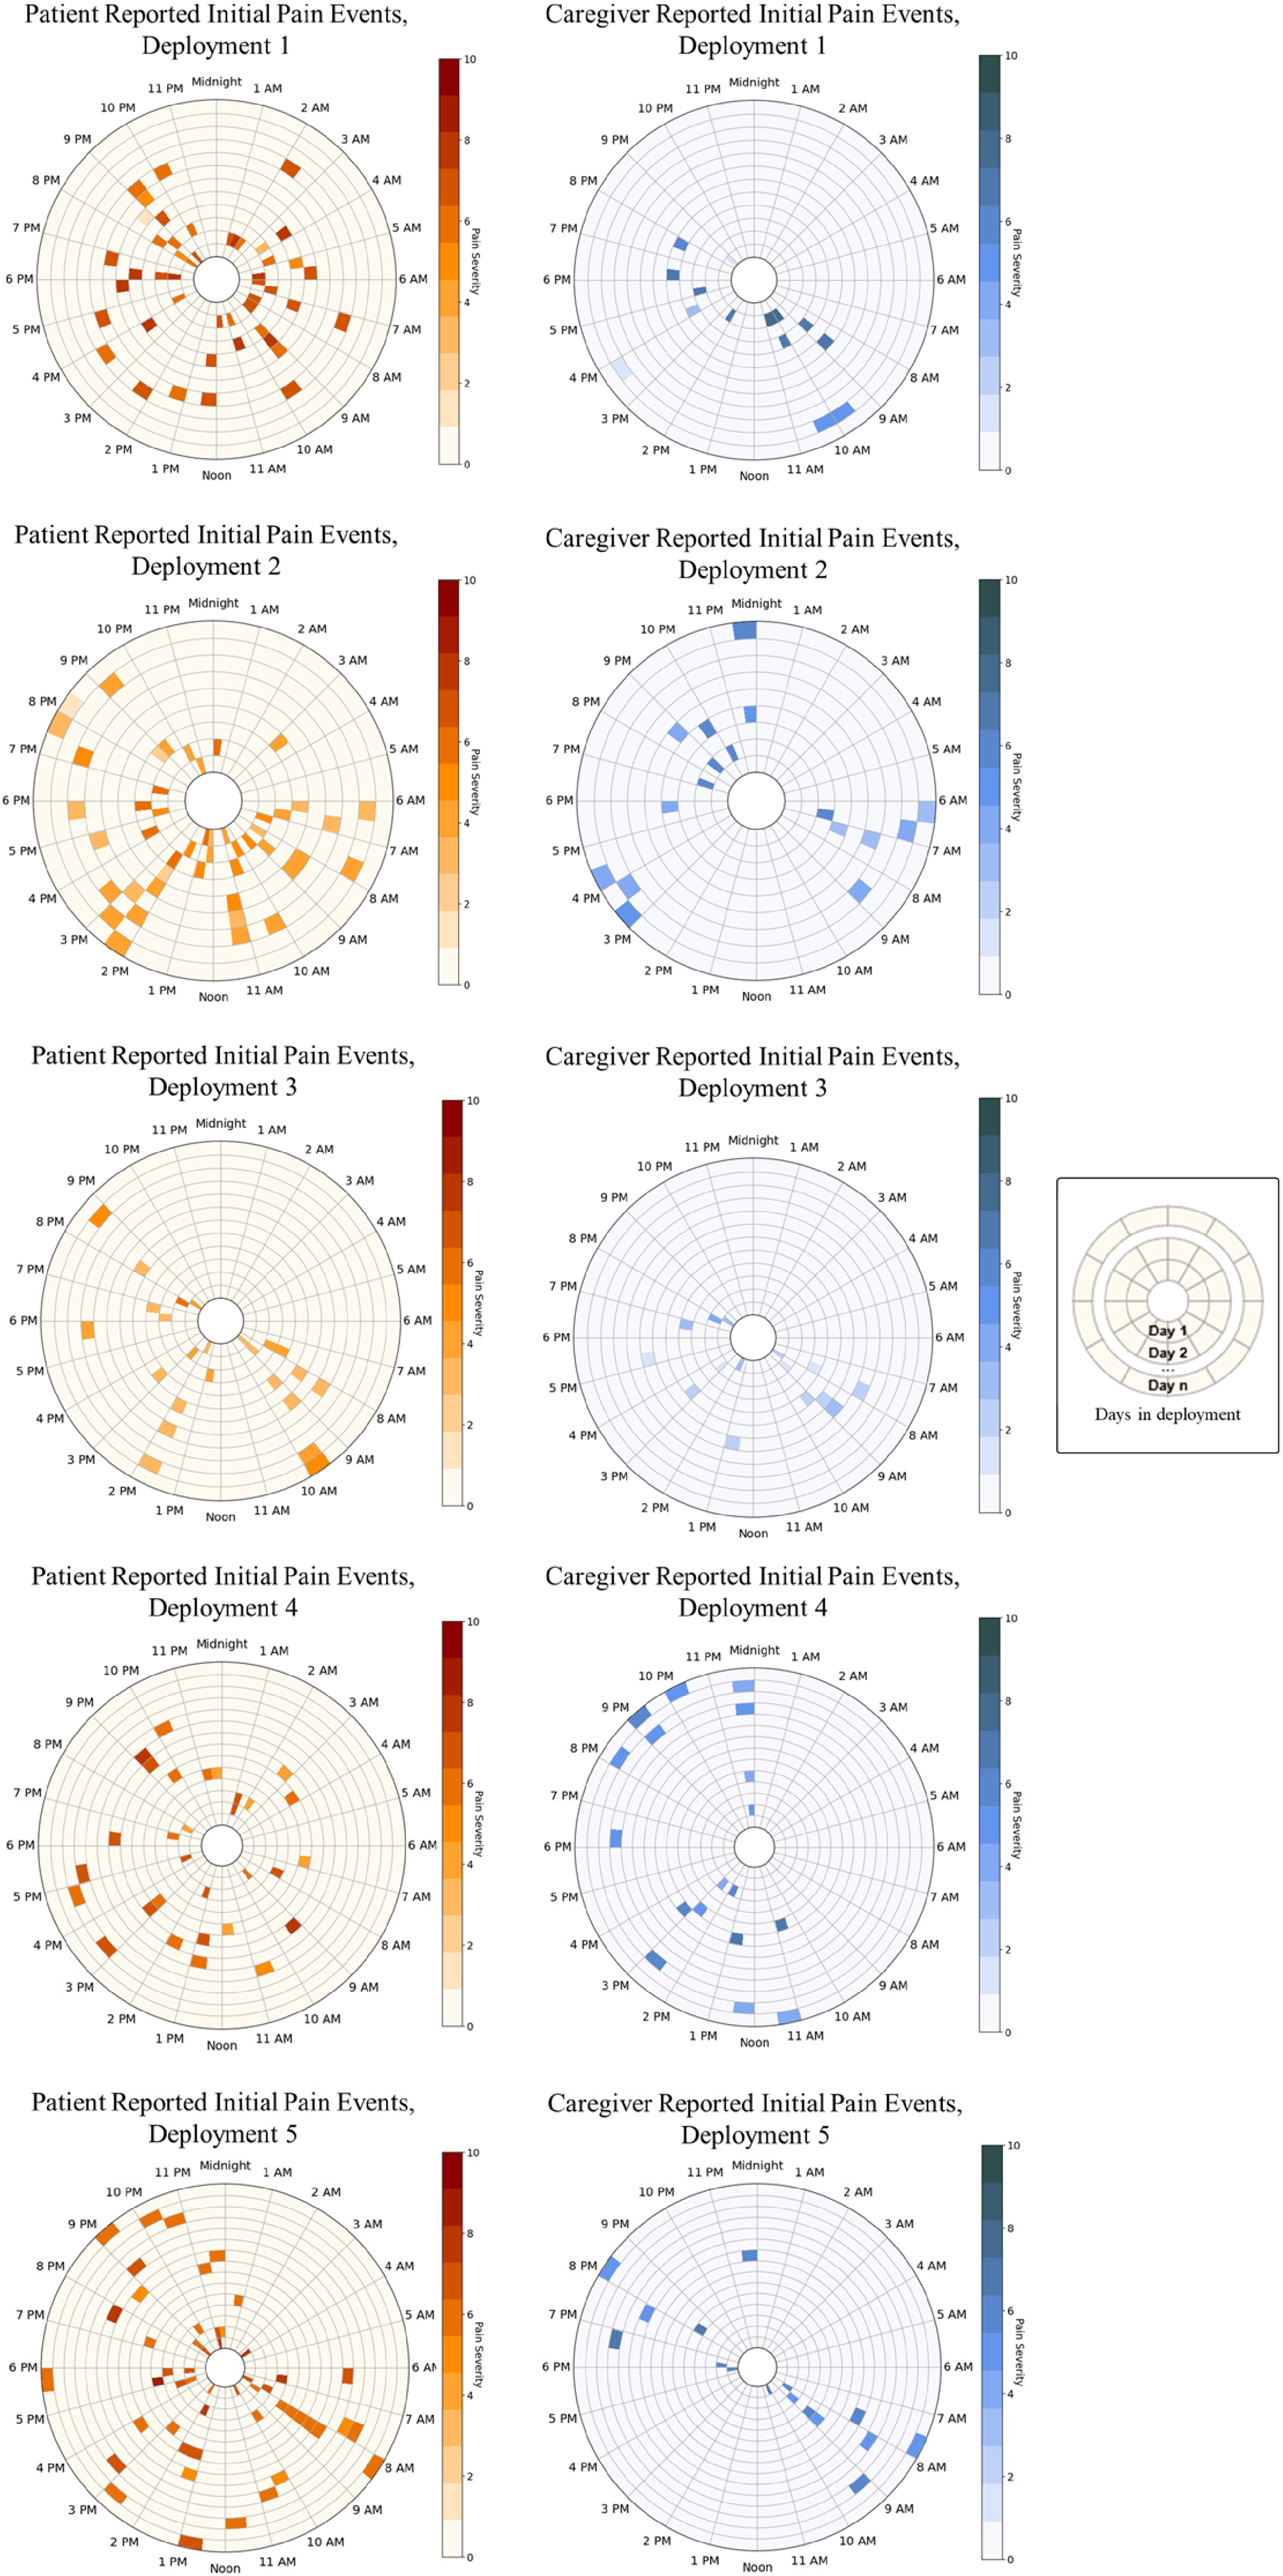
Pain time wheels summarizing cancer pain events over a 24-h period for the duration of a deployment, per patient and caregiver, per deployment.
Bubble plots: concordance of matched pain events
We also explored visualizations to communicate the concordance between patient and caregiver pain responses (Figure 3). Initial inspiration for representing concordance of pain events in this manner came from visualizations used to communicate patterns of gene expression. 44 We considered concordance as the number of pain events equally marked by both patients and caregivers for each deployment within various time periods (5 min up to 60 min) and the degree of similarity between their responses. Figure 3 shows the number of matched initial pain events and degree of concordance reported by patients and caregiver per deployment, for various time windows. Not surprisingly, the number of matched pain events increased as the time window expanded. Using the 60-min time window, 19% of pain events matched (n = 54/283 total pain events). Out of these 54 matched events, almost half (n = 25; 48.15%) had perfect concordance (e.g., patient said they were ‘very distressed’ and caregiver reported they were also ‘very distressed.’) Deployments 1 and 5 showed the highest concordance for both pain events of any severity and for pain events ≥5 in severity, across all time windows. Patients and caregivers showed varying degrees of concordance within each deployment related to ratings of self and perceived partner distress. For example, with deployment 2, the patient consistently rated their self-distress levels higher than their caregiver during pain events across all time windows (e.g., for deployment 2, at the 30-min window, for the six matched pain events the patient rated their self-distress level 1.17 points higher than the caregiver on the 4-point Likert scale). Interestingly, for matched pain events across all deployments and time windows caregivers largely rated the patient's distress higher than patients rated caregiver distress.

Number of matched initial pain events and degree of concordance reported by patients and caregivers, per deployment.
Box plots and line graphs
We also explored representing patient and caregiver EMA pain data in more traditional formats, such as box plots and line graphs. Figure 4 depicts box plots per deployment of all initial and follow-up pain event EMAs with minimum, maximum and average (median) severity ratings for patients and caregivers. Figure 5 depicts line graphs displaying average (mean) severity scores for initial (solid line) and follow-up (dotted line) pain EMA data for patients (orange) and caregivers (blue). Initial pain EMAs are represented by a circle plot point; follow-up pain EMAs by a square plot point; both are scaled in proportion to the number of EMAs events (the larger the plot point, the more EMAs reported). Severity scores of ‘0’ represent reports of ‘no pain,’ and gaps in the lines represent no recorded data. “Unsure” caregiver responses to follow-up pain EMAs were not included.

Box plots summarizing average patient and caregiver initial and follow-up pain EMA severity scores, per deployment.
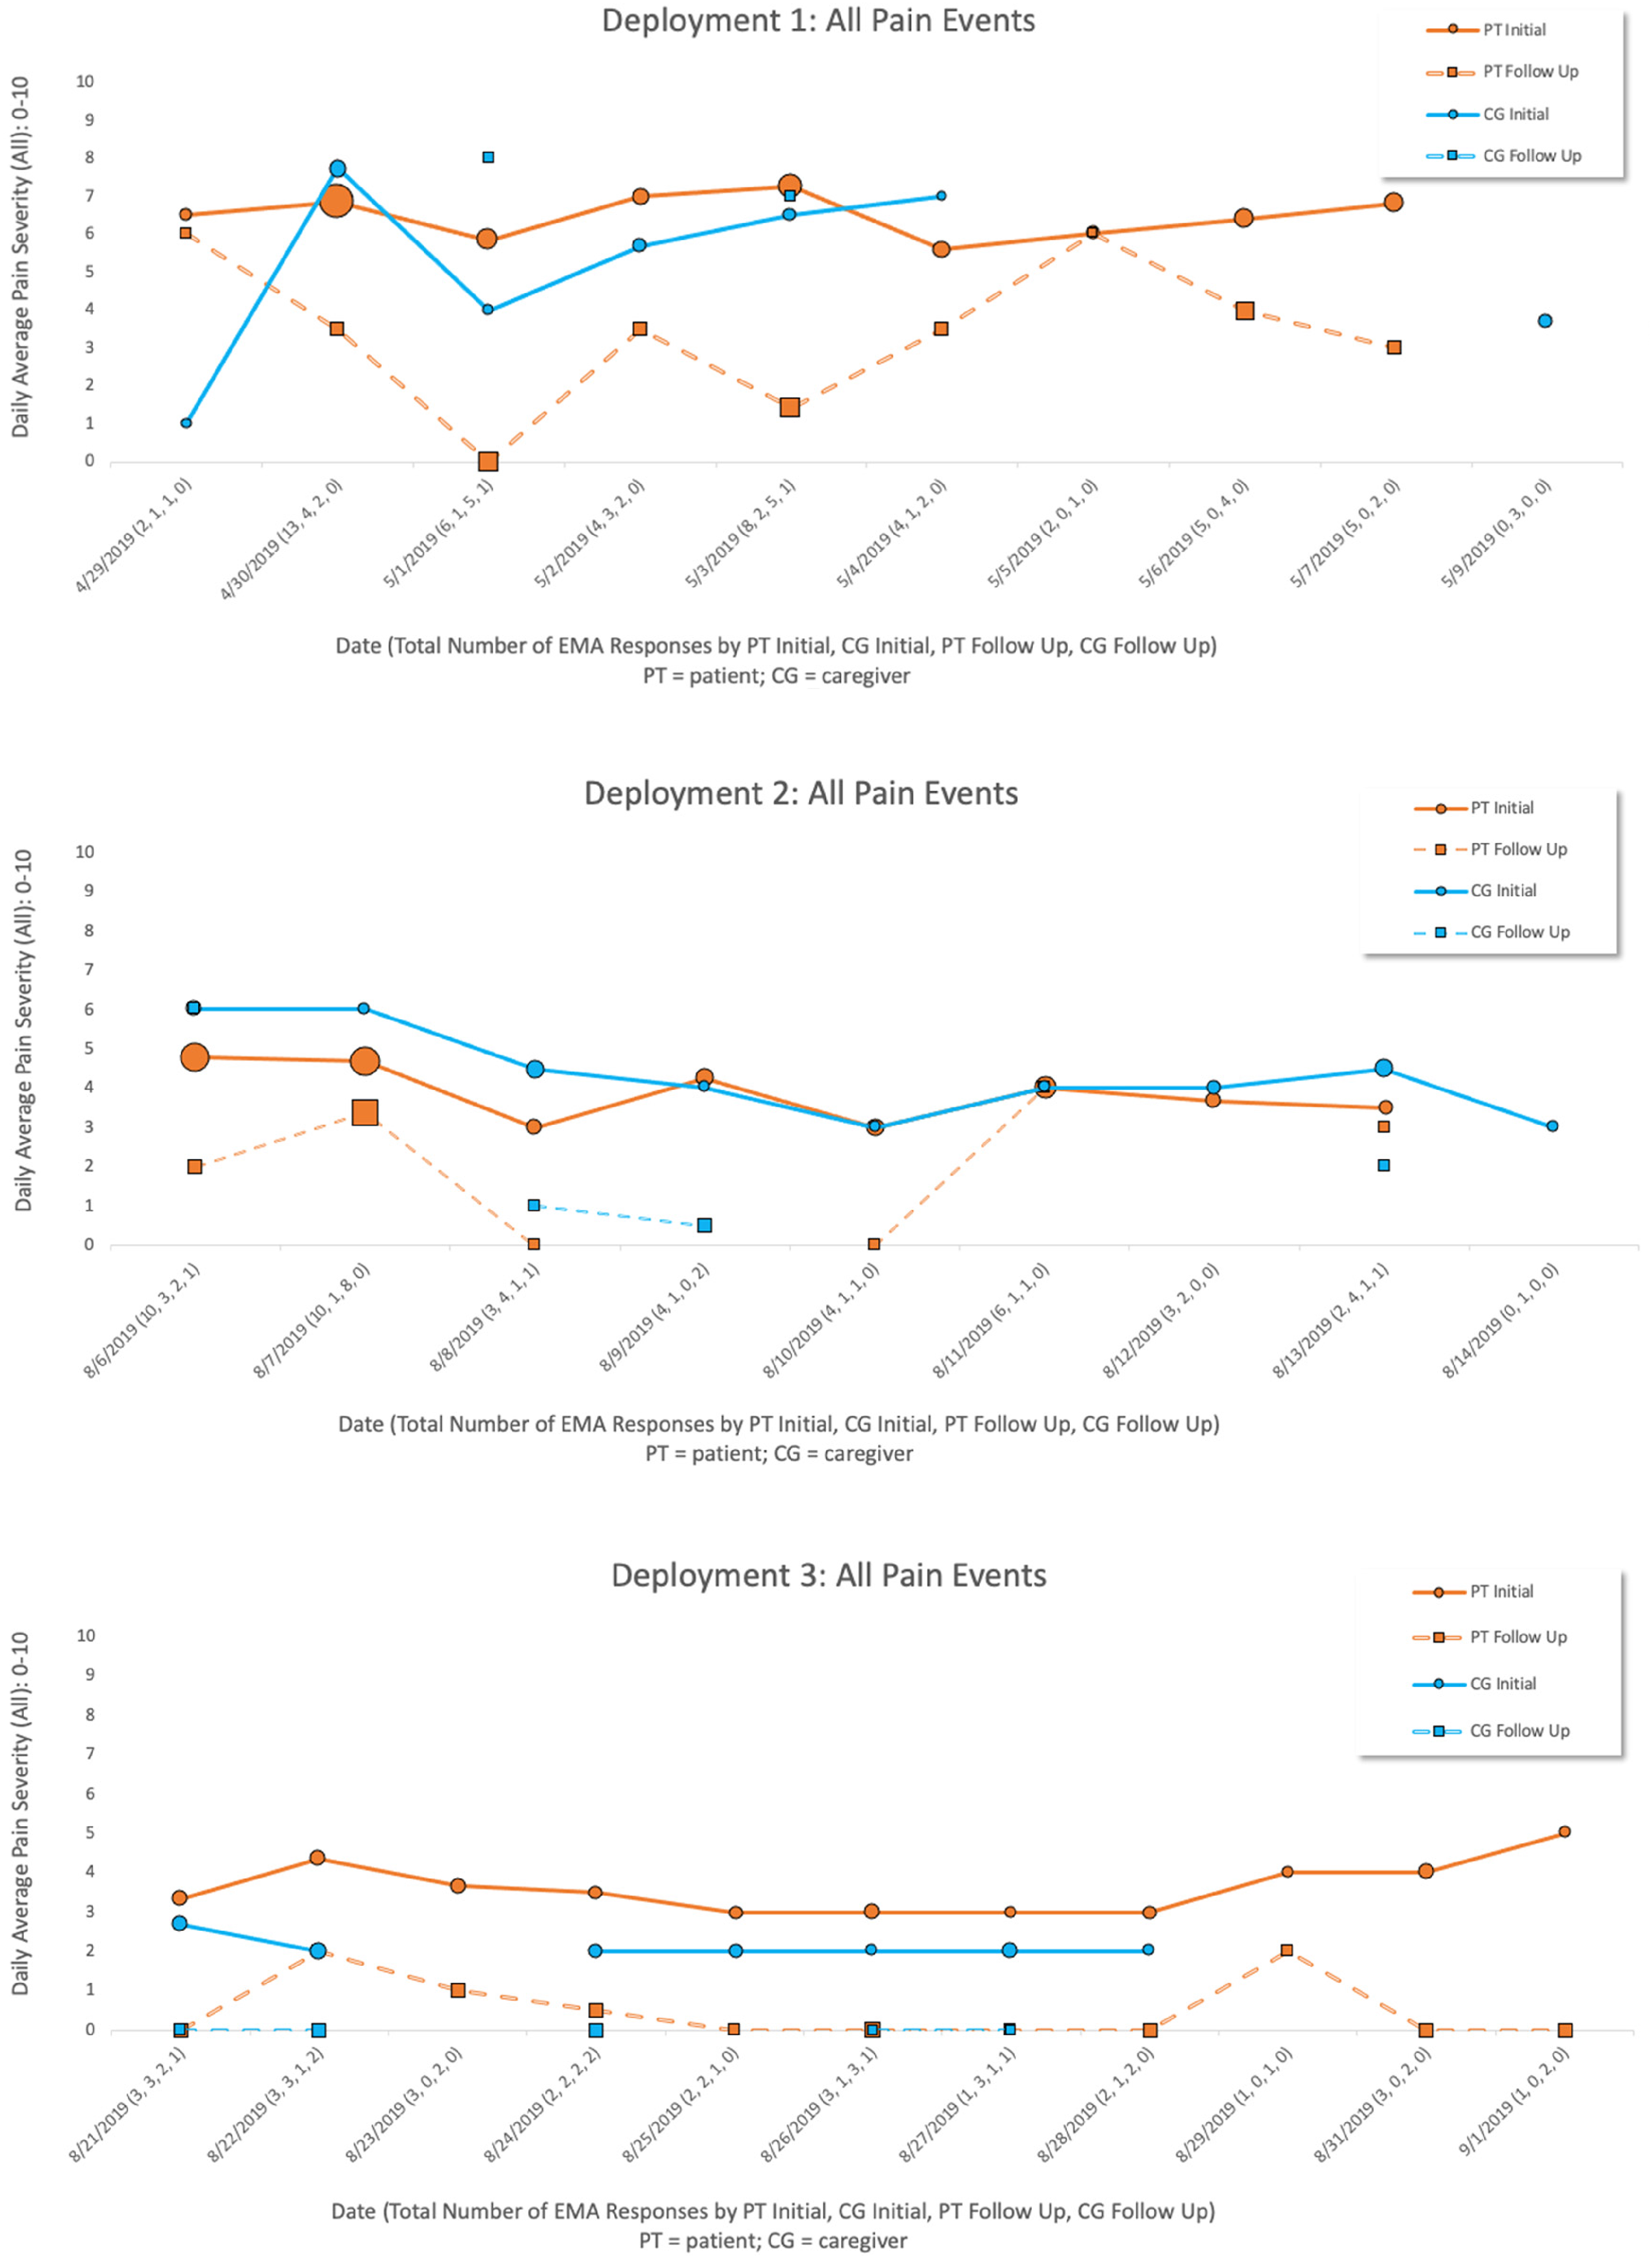
Line graphs summarizing average patient and caregiver initial and follow-up pain EMA severity scores, per deployment.
Discussion
Our results describe the experience of cancer pain in the home context, as experienced by both patients and family caregivers, and as captured by a unique RHMS. 26 A better understanding of the experience of breakthrough cancer pain (i.e., abrupt escalations of pain from baseline) is critical to develop personalized interventions, which are key to optimizing outcomes for both patients and family caregivers. 45 Specifically, our results provide insights about the timing and severity of cancer pain, individual and perceived partner distress levels, the impact of cancer pain on key quality of life metrics, and patterns of opioid use and its perceived effectiveness through a unique schema of on-demand and scheduled EMAs. Importantly, our results reveal that each dyad has a unique response to cancer pain events. For example, some patients report more frequent higher-severity pain events, but less distress and some dyads seem to be more ‘in-sync’ with higher numbers of matched pain events with greater concordance. Such findings are critical to inform truly personalized interventions that can effectively mitigate pain and distress in the home context. Below, we highlight key results and offer a discussion as to how they can be applied to inform and improve care for patients and caregivers.
EMA data and what they can tell us
Both patients and caregivers reported pain events, but patients recorded over twice as many initial pain events as compared to caregivers. The reasons for this could be many; caregivers may not have been in close proximity to the patient, so less aware of the patient's status; they may have forgotten or chosen not to record pain events on their respective smartwatch; or, for a variety of potential reasons, they may not be particularly attuned to the patient's experience, especially if the patient has been functioning at a high level. We recruited a sample of fairly independent and well-functioning patients, so a likely explanation is that they simply did not have their caregiver with them as often. Additionally, patients actively experiencing symptoms may simply be more motivated to track and record their experience compared to even the most attentive of caregivers. It is also possible that the number of pain events recorded is artificially low due to occasional technical problems with the software which may have deterred EMA completion, or due to misunderstanding protocol instructions. For example, one patient shared post-deployment that they only recorded pain events when they took an opioid (which was about half of the time), versus the instructions which asked patients to record all pain events, regardless of intervention.
Despite these caveats regarding the total number of recorded pain events, it is interesting to consider how these pain events were characterized by patients and their family caregivers. For example, overall distress levels for patients and caregivers were lower than may be expected given the pain severity scores (e.g., over 50% of initial and follow-up pain events (where participants indicated ‘still in pain’) were rated with an average severity of 5/10 or higher). Lower reported distress levels seem especially contradictory with the follow-up EMAs where participants reported an opioid was taken, but they were still experiencing pain. Possible explanations for this could be that the prescribed opioid was, in fact, ineffective in reducing the patient's pain severity, but that for whatever reason this was not particularly distressing to the patient or caregivers, perhaps because it had become the norm. Another explanation for higher pain severity but lower distress could be due to the challenges of temporally capturing when the opioid was actually taken and whether the participant completed the EMA before or after the opioid had a chance to take full effect.
The daily EMAs that queried participants about the past 24-h and overall quality of life metrics revealed that caregivers reported higher levels of overall distress and pain interference levels compared to patients. Interestingly, patients perceived caregivers to be more distressed than caregivers self-reported their own distress; in contrast, caregivers perceived patients to be less distressed than patients self-reported their own distress. These findings suggest that while caregiver burden and distress is real and perceived by patients, patients and caregivers may be out-of-sync as to understanding the actual distress experienced by their partners, with patients potentially more likely to overestimate their partners’ distress, and caregivers more likely to underestimate their partners’ distress. Relatedly, we found that no caregivers indicated they were ‘unsure’ about a patient's distress level when reporting initial pain events, whereas a higher number of patient responses indicated they were ‘unsure’ about a caregiver's distress level. This could mean that, similar to the daily EMA findings, patients are less attuned to caregivers’ distress levels; it could also simply mean patients were not in proximity to caregivers when recording the pain event and so appropriately selected the ‘unsure’ option. Exploring factors that may influence patient and caregiver mutual understanding and accurate perceptions of their respective distress levels is an area ripe for future research.
Additionally, our daily EMAs found that self-reported mood and sleep were worse for patients compared to caregivers, and that both groups reported similar activity levels and time outside the home; the latter likely reflects the higher performance status of patients enrolled in the study. Interestingly, patients reported spending more time with their partner than vice versa; one possible explanation is that caregivers may interpret ‘time spent together’ differently than patients and perhaps are less likely to view all time spent together as ‘quality time’ with a partner who is seriously ill. This finding suggests that interventions that focus on restoring and validating connection between patients with serious illness and family caregivers as intimate partners could be particularly beneficial in reducing caregiver burden and distress.
Another insight from our EMA data relates to opioid use for the management of cancer pain. Over 70% of patients and caregiver responses indicated that the patient took an opioid for a pain event. This is logical and appropriate given our patient study population and study inclusion criteria. However, what is perhaps more concerning is the number of instances where participants reported patient pain but did not take medication; the most frequent reason being ‘not time yet.’ This could suggest opioid prescribing with PRN (‘as needed’) intervals that are too far apart or inadequate dosing (i.e., end of dose failure). These sorts of findings can be especially beneficial to clinicians, who could benefit from seeing quantifiable, longitudinal data about a patient's experience at home since their last clinic visit, versus relying on a single snapshot question of ‘how well is your pain medication working?’ to guide medication adjustments. No patient or caregiver responses indicated an opioid was not taken due to being out of pills, and only one patient response reported not taking an opioid due to ‘worried taking too many.’ This is encouraging given concerns that recent opioid restrictions and regulations may negatively impact pain control for patients with legitimate pain; 46 while our findings suggest this was a not a concern for our sample it is critical to continue to monitor this for patients with cancer.
Data visualizations
An exciting element of this work is exploring data visualizations to clearly and succinctly tell the story of the patient and caregiver experience of cancer pain at home. These types of visualizations can provide helpful insights into patterns of pain events for dyads that can help inform interventions and shed light on the effectiveness of medication. For example, with the box plots for deployment 1, it is noteworthy that caregiver average follow-up pain severity scores, even after the patient reportedly took an opioid, remained above 5/10. It is also interesting in deployment 1 that even with taking an opioid, the patient follow-up pain scores reveal significant variance. For the line graphs, the scaled plot points make it easy to see how many pain events have been recorded, and also if pain is persisting or improving (e.g., ideally, we want to see the dotted, follow-up EMA line below the solid, initial EMA line). This visualization also provides information, at a glance, regarding how many pain events are being reported by patient or caregiver and possible concordance.
Our initial work in this area focused on creating ‘time wheels’ to represent individual pain events in a 24-h period, ‘bubble plots’ to explore concordance of patient and caregiver responses, and more traditional box and line graphs to represent pain severity scores and fluctuations over time. We plan to continue to iterate and refine these visualizations, and design new ones, as we seek more structured input and feedback from clinicians, patients, and caregivers. We anticipate that different types of visualizations will appeal to different stakeholders for different purposes, and that providing options to users in how they can view similar data—and the level of desired granularity—will be important. For example, with the pain time wheels we plan to add an interactive component, where a viewer could hover over a pain event and then learn more about the particular context for that event (e.g., was medication taken, the specific time of the event, self-reported distress levels, etc.). We also will continue to expand these visualizations and correlate them to concurrently collected environmental and physiological data.
One critically important consideration related to data visualizations involves thinking through how the sharing of data could potentially (albeit unintentionally) negatively impact self-efficacy or the patient-caregiver relationship. For example, one could envision a possible difficult scenario where a patient sees data that suggests their caregiver does not consider their pain to be equally distressing (as our own findings above revealed), or a patient becomes increasingly discouraged by seeing their pain and distress levels continue to worsen. As most symptom management and patient-reported outcome (PRO) literature focuses on the positive and affirming aspects of data sharing, understanding when and how it could have the opposite effect is essential and an important area for future inquiry. It may be that these issues are particularly salient for patient populations coping with advanced stage and incurable disease where symptom trajectories can be highly dynamic and are expected to worsen, versus, for example, a healthier post-operative patient where rapid improvement and progress is anticipated.
Revision of our EMA schema
Developing EMA schemas able to capture the complexity of pain and dual perspectives, while minimizing participant burden and accounting for the temporal aspect of pain control mitigation efforts was challenging. Analyzing data from this pilot provided key insights into needed refinements related to our EMAs. For example, it became apparent that we had very limited follow-up EMA data that made it difficult to assess response to interventions. Also, there was the temporal challenge of when pain interventions actually occurred. Our initial EMAs asked questions in the past tense, which created confusion; we tried to rectify this with patient/caregiver education and asking participants post-deployment if they tended to mark pain events and then take pain medication or vice versa, but this approach clearly has limitations. In the end, we changed our EMA schema after these five pilot deployments so that all participants receive a follow-up EMA—regardless of whether an opioid is reported as taken or not—and the question is asked in the past tense to capture an intervention they may have done in the past 40 min. We changed the follow-up EMA deployment window from 30 min to 40 min after consultation with a pharmacist and we added questions that ask about non-pharmacological and non-opioid approaches to pain management. We also added: a question more specifically about when the patient took an opioid; questions to our daily EMA related to sleep quantity (versus only sleep quality), fatigue and appetite; and a parallel question about perceived pain interference for the participant's partner (i.e., ‘how much did pain bother your partner?’).
Limitations
Caution is needed in drawing conclusions about patient pain events due to the reality of missing data (e.g., some EMA questions were added later in deployments; some pain events won’t be reported by a participant, for a variety of reasons; follow-up pain EMAs were only generated if participants reported they took an opioid; software or technical glitches prevented EMA deployment or data capture); we have worked to rectify these potential causes of missing data in subsequent iterations of our work. Despite this limitation, our results offer a unique perspective on cancer pain experienced in the home context by patients and caregivers and suggest important future avenues for RHMS symptom management research. Although we had a small sample of 5 dyads which limited our ability to evaluate statistical significance between patient and caregiver groups, we gathered a wealth of data and multiple data points (on average over 90 unique EMAs per participant, with 540 data points per 2-week deployment) which provided us with a rich dataset to descriptively analyze. Deciding how to best quantify and represent individual pain severity scores within a group of multiple time points is also complex; while averaging pain severity scores is a feasible way to provide an overall perspective on the pain experience, this approach can obscure individual pain events. Lastly, it is important to acknowledge the potential psychometric limitations (e.g., low content validity) of evaluating complex constructs, such as pain or distress, with single-item measures. However, we suggest that single-item measures deployed as EMAs serve an important purpose and can be a valid approach to enhance adherence with data collection and reduce participant burden in capturing highly dynamic symptoms experienced by seriously ill patients.
Conclusion
Thoughtfully constructed and deployed EMAs can be a valuable component of RHMS and yield rich data to help guide patient care. Our study helps confirm that EMAs deployed on a wearable device is a viable strategy to collect meaningful data regarding difficult and dynamic symptoms, such as cancer pain. Utilizing a combination of EMA schemas (on-demand, user-initiated and automated, scheduled EMAs) allows for participants to record events as they occur in real-time as well as the response to interventions, such as pain medication, and the impact on overall quality of life. Importantly, collecting EMA data from dyads allows for a more comprehensive picture of symptom burden by understanding the experience of pain from various perspectives. Data collected by EMAs allows for multiple opportunities to visually represent the symptom experience which can be shared with patients, caregivers, and clinicians to inform effective, personalized interventions. Future work will continue to create a library of BESI-C data visualizations and explore how they can be therapeutically shared with diverse stakeholders depending on their needs and preferences.
Footnotes
Acknowledgements
We would like to thank Ridwan Alam; Rachel Bennett; Kate Gordon; James Hayes; Kate Lichti; Yudel Martinez; Sahar Mohammadi; Amber Steen; Sean Wolfe for their assistance with this research.
Contributorship
VL, JL conceived the study. VL led protocol development and gaining IRB approval. VL, LB, EO, NH, JL were involved in participant recruitment and data collection. VL, NH, NP led data analysis. VL wrote the first draft of the manuscript. All authors were involved in interpretation of results and reviewed and edited the manuscript and approved the final version of the manuscript.
Declaration of conflicting interests
The author(s) declared the following potential conflicts of interest with respect to the research, authorship, and/or publication of this article: Authors VL and JL have a pending patent related to the BESI-C technology.
Ethical Approval
This study was approved by the University of Virginia Health Sciences Research Institutional Review Board (UVA-HSR #21017).
Funding
The author(s) disclosed receipt of the following financial support for the research, authorship, and/or publication of this article: This work was supported by grants from the American Cancer Society, Exploratory Pilot Projects in Palliative Care, PEP-19-042-01-PCSM and the National Institutes of Health, National Institute of Nursing Research, R01NR019639.
Guarantor
VL
Previous presentations
Limited aspects of this work have been previously presented at the American Academy of Hospice & Palliative Medicine State of the Science (February 2022, poster) and the Oncology Nurses Society (ONS) 47th Annual Congress; Anaheim, CA (May 2022, poster).
De-identified supporting research materials available upon reasonable request.