
Abstract
This article reports the design and testing of a novel interactive method, abbreviated to ANALYSE (systemAtic aNALYsiS of Electrocardiography) to assist interpretation of 12-lead electrocardiogram. 15 participants interpreted a total of 150 12-lead electrocardiogram recordings randomly using a standard and this novel (ANALYSE) reporting format. The overall aggregated mean score attained using the standard format was 53% (range = 38–82%, standard deviation = 12). Conversely, the overall aggregated mean score attained using ANALYSE format was 75% (range = 55%–93%, standard deviation = 9). A total of 14/15 participants consistently scored higher when interpreting electrocardiograms using the ANALYSE format (range = 10% -45%). A significant difference between the aggregated marks scored using the ANALYSE format and the standard format was calculated (Wilcoxon Z Score = −3.2374 (df = 14), p < 0.01). This study demonstrates the clinical utility of a novel method (ANALYSE) to assist the learning of electrocardiogram interpretation and its association with enhanced diagnostic performance in novices.
Background
The recording of 12-lead electrocardiograms (ECGs) is one of the most useful and commonly performed medical procedures. ECGs are used in diagnosis, risk-stratification management decision-making and assessment in response to therapy. 1 Interpretation of the 12-lead ECG involves analysing several waveforms (P, QRS, ST and T waves) which permits the detection of abnormalities that affect normal electrical conduction. 2 The interpretation of 12-lead ECG recordings is complex and clinically challenging. Appropriate interpretation can be difficult to achieve with misinterpretation resulting in patient fatality. 3 Despite its widespread use, several studies have highlighted deficiencies in ECG interpretation skills among health professionals.2,4–10
In the last few years, decision support systems (DSS) in medicine are being increasingly configured as an innovative mechanism for providing health professionals with clinical knowledge and patient-related information. 11 DSS are designed to assist health professionals with decision-making tasks that reduce the likelihood of errors and improve care quality. 12 DSS knowledge base, ranging from guidelines of best practices for managing patients with specific disease states to new medical knowledge from clinical research, is the key element surrounding this supporting process. 12 Indeed, a recent review of the topic reported that DSS improved practitioner performance in 40 per cent of diagnostic systems and 62 per cent of disease management systems. 13
This article reports the design and testing of a novel ECG interpretation teaching tool systemAtic aNALYsiS of Electrocardiography (ANALYSE) Smart Form (Figure 1). As a proof of concept, the smart form was evaluated with a group of 15 healthcare science practitioner (HCSP) students studying an introductory module of electrocardiography over a period of one teaching term (12 weeks). All students were recently educated to second year undergraduate university level in a medical-related discipline as a part of their university undergraduate degree course. HCSP’s within the United Kingdom have expertise in applied scientific techniques within cardiac physiology and work in a healthcare setting with a clearly defined technologically based role in the delivery and technical reporting of quality assured tests, investigations and interventions for patients. 14 The aim of this research was to evaluate the diagnostic accuracy of learners against a standard curriculum using the ANALYSE Smart Form compared to a traditional reporting format for 12-lead ECG interpretation (Figure 2).
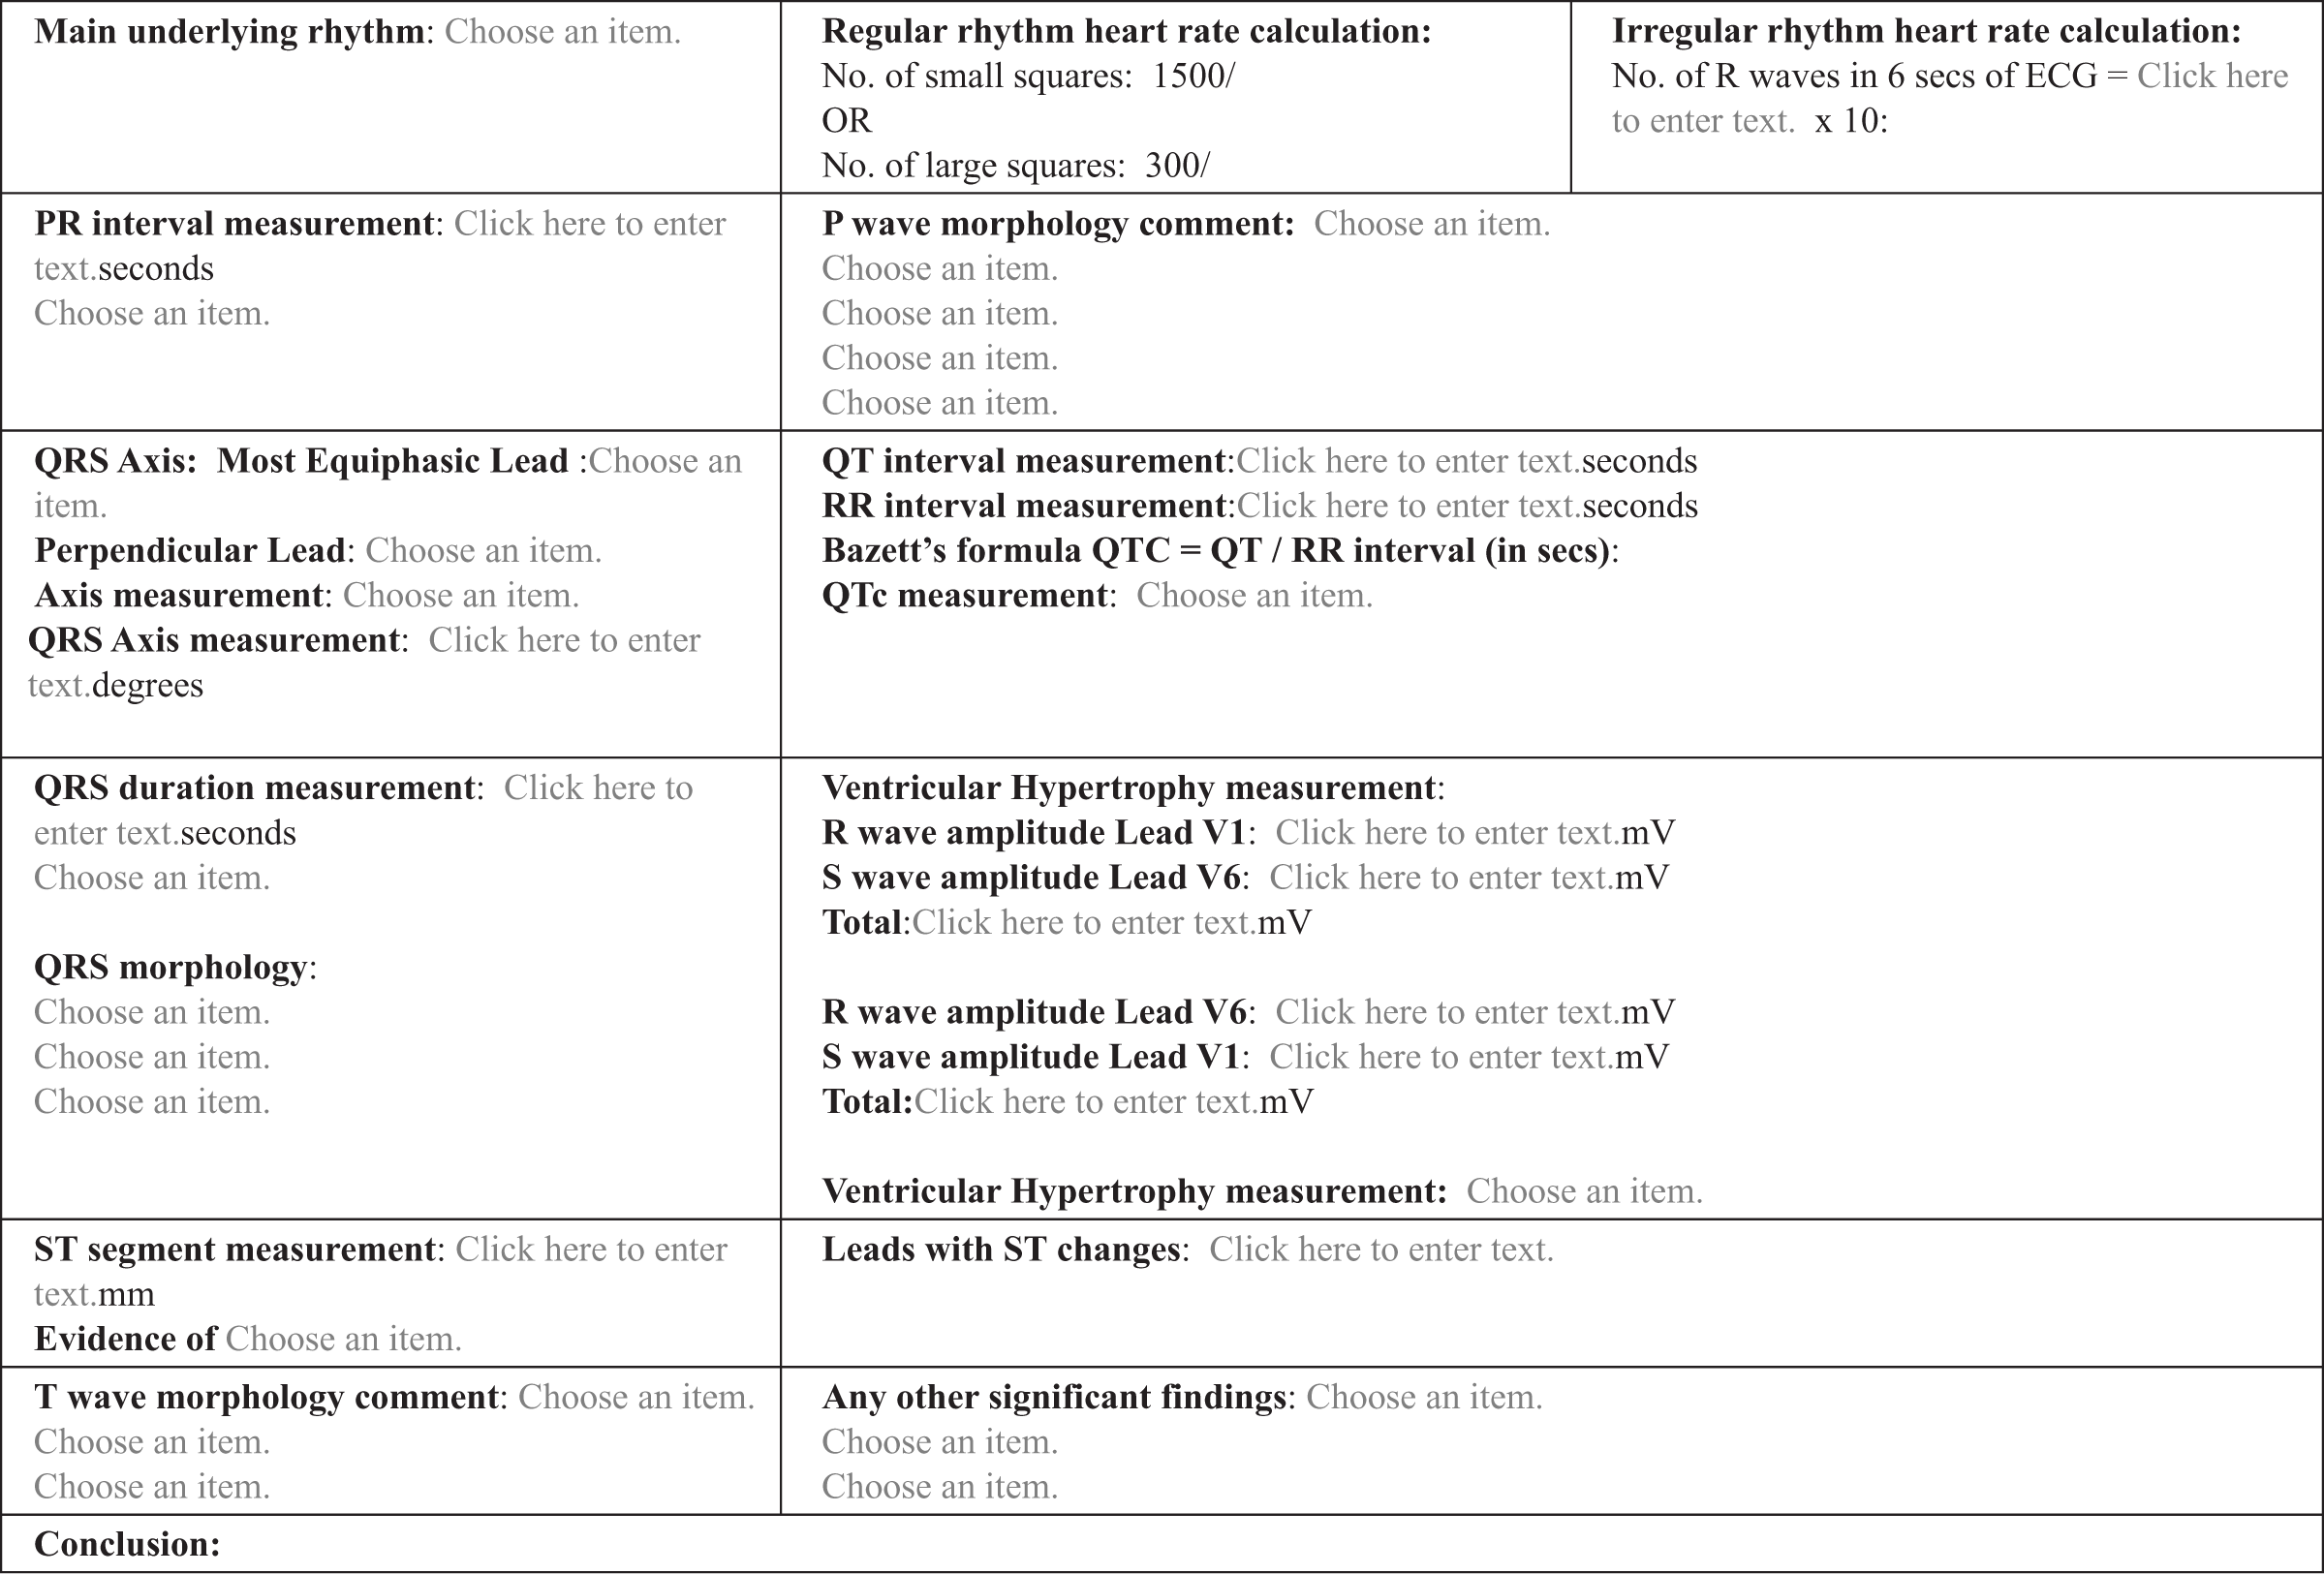
ECG interpretation interactive Smart Form learning tool: ANALYSE (systemAtic aNALYsiS of Electrocardiography).
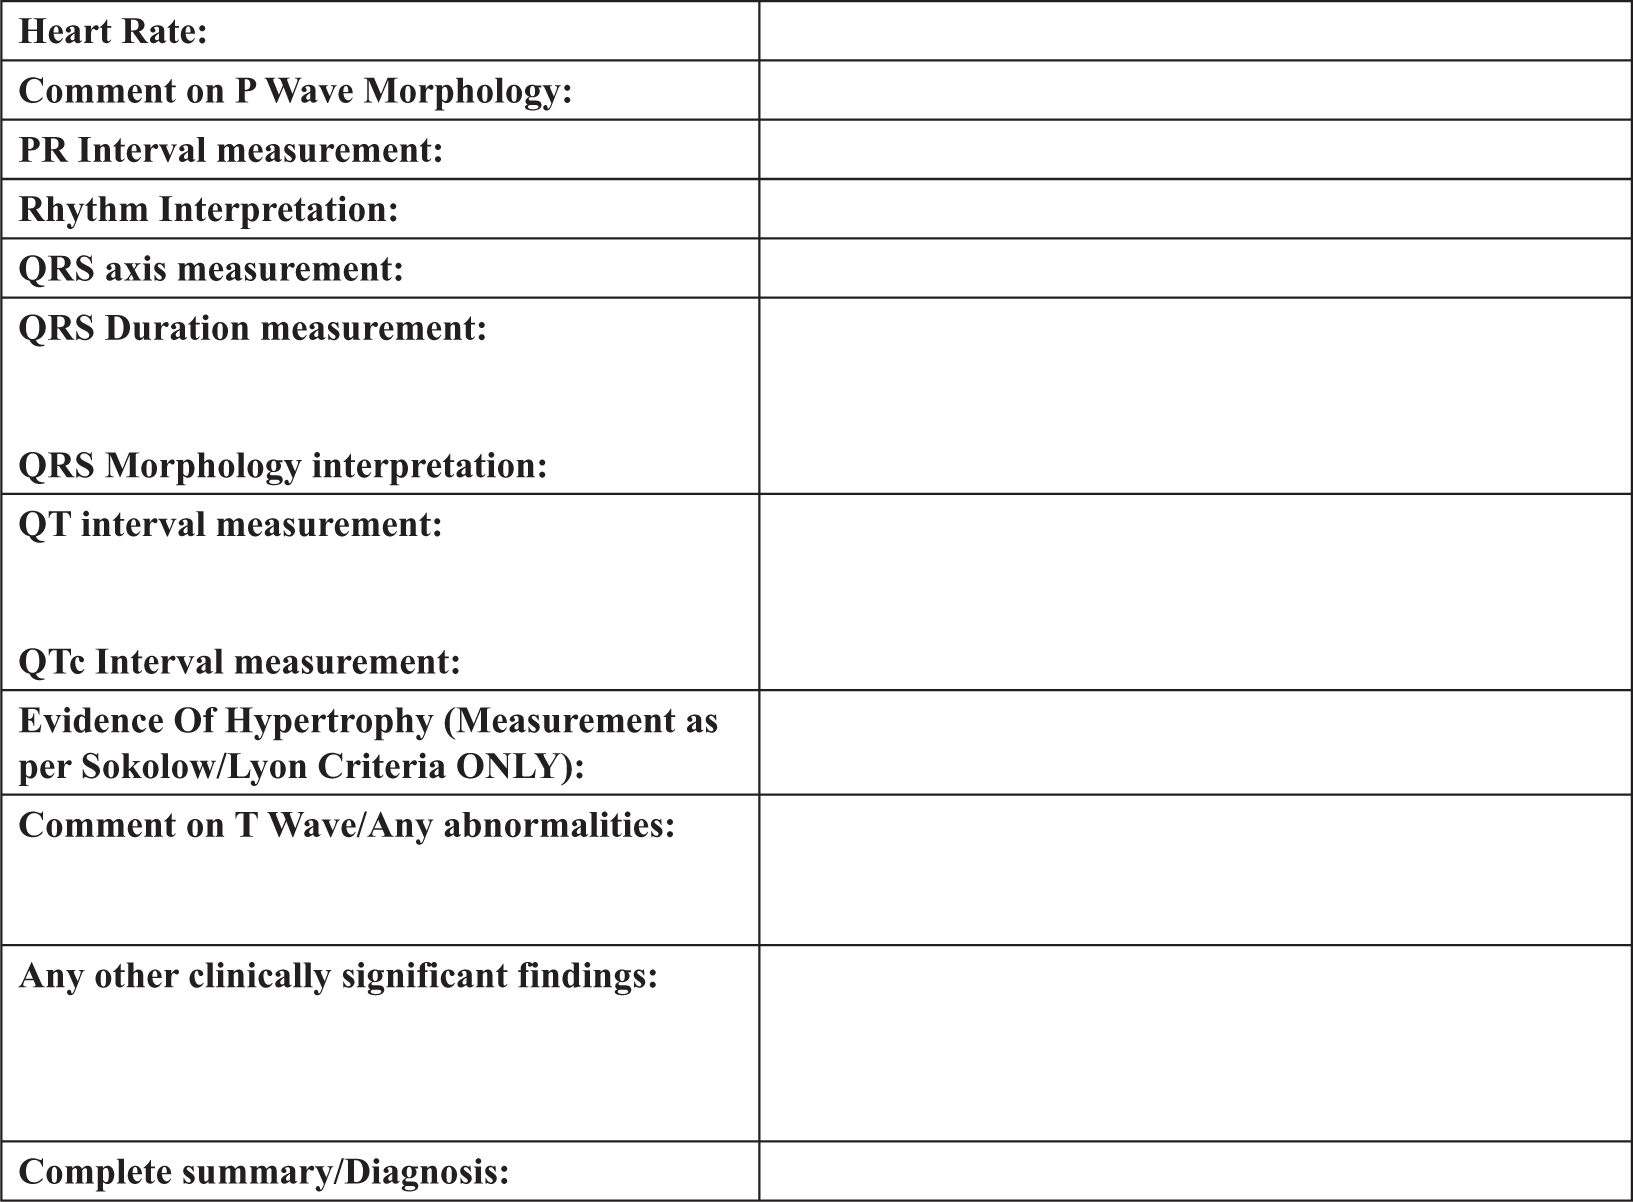
Society for Cardiological Science and Technology (SCST) standard ECG report form. 11
Material and methods
Model design
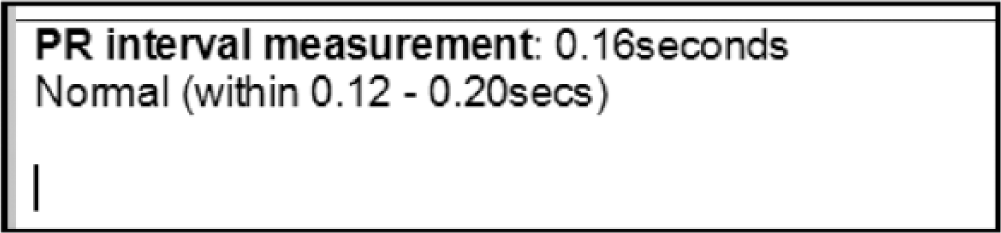
To develop a standardised format for ECG interpretation, we identified the possible ECG metrics that will incrementally lead to an eventual diagnosis. The use of an analytic framework, described as lists of key variables to be sequentially considered, involved careful scrutiny of a systematic review of published literature.15–22 An interactive Smart Form learning tool labelled ANALYSE was devised using a Microsoft Word 2010 template populated with content controls (Figure 1). This tool incorporates a systematic process of analysis with the major objective to achieve precise and accurate interpretation by applying various deductive approaches.15–22 ECG interpreters are required to examine the tracing to evaluate heart rate, rhythm, cardiac axis, signs of chamber hypertrophy, signs of ischaemia and measure electrocardiographic conduction intervals in an organised fashion. ANALYSE incorporates a number of features to collect this data and assimilate it into a comprehensive format. ECG interval measurement prompts (Figure 3) request the interpreter to measure the different ECG segments and intervals which relate directly to phases of cardiac conduction (Figure 4). Limits have been set on these from which to diagnose deviations from normality and are presented in convenient drop-down menu statements (Figure 5). Interpreters can also type freely onto the smart form using free text annotations (Figure 6).
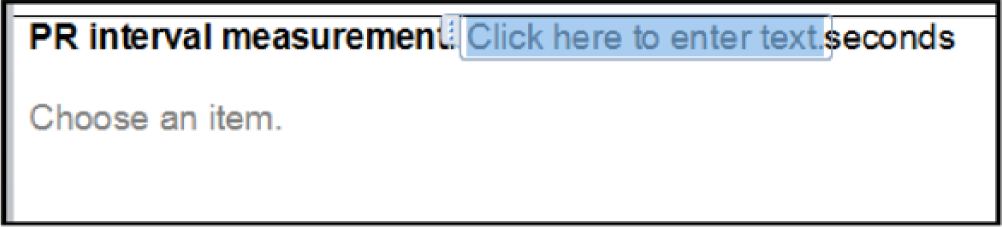
Screen capture shots to illustrate the working of ANALYSE, specifically free text annotation of data.
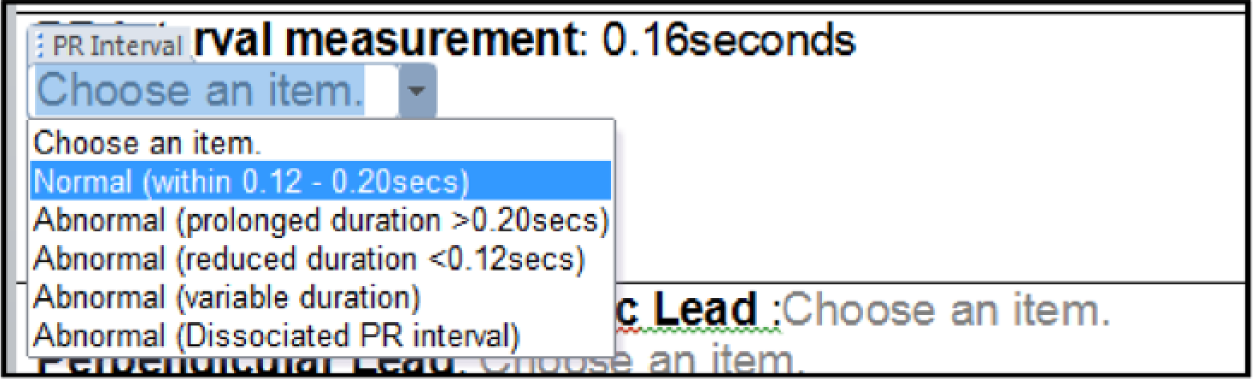
Screen capture shots to illustrate the working of ANALYSE, specifically drop-down box use with normal range data.
Screen capture shots to illustrate the working of ANALYSE.
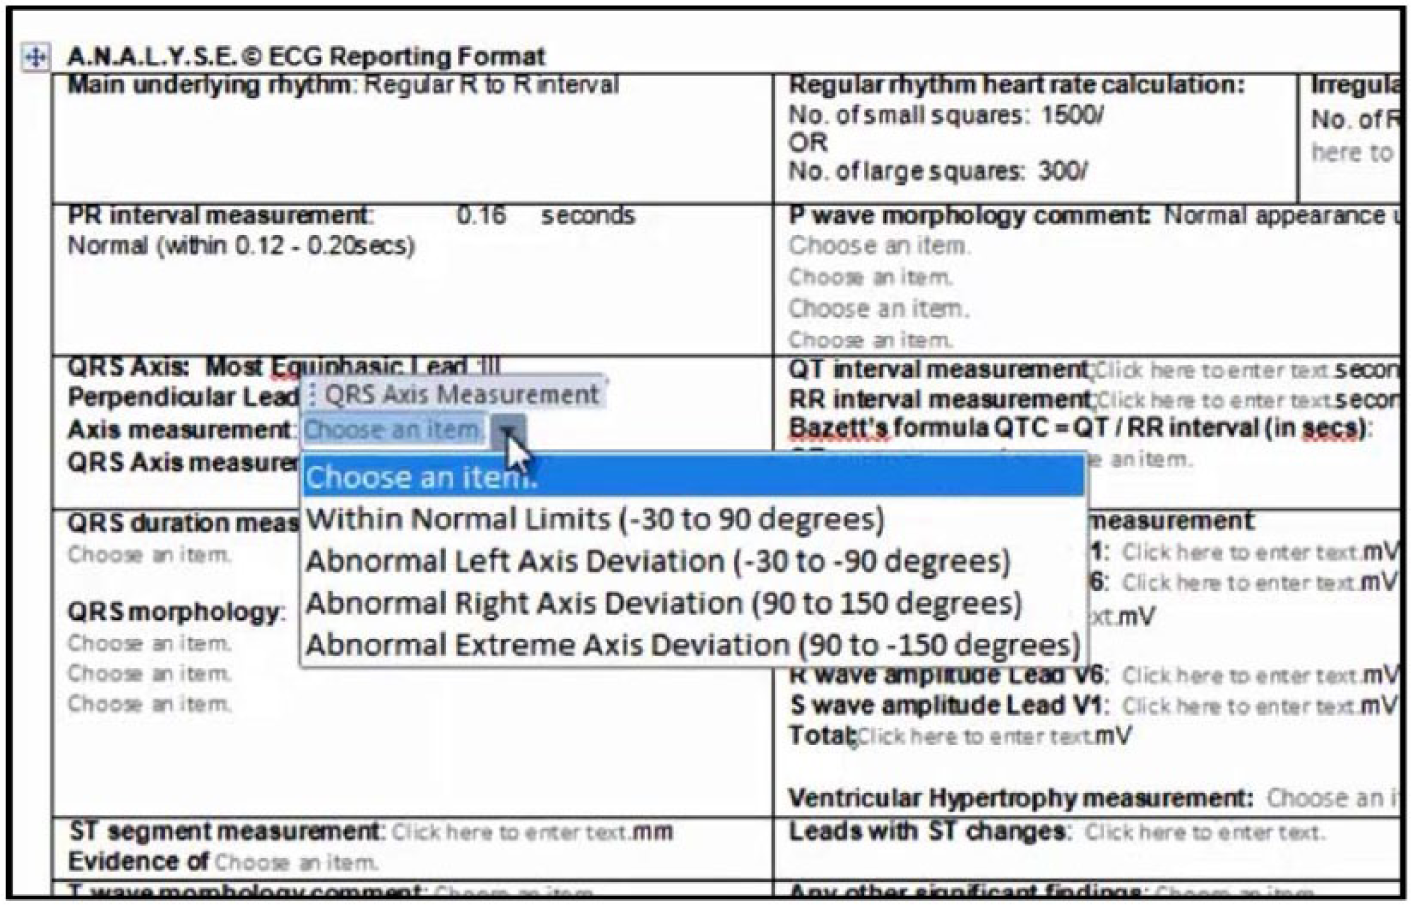
Screen capture shots to illustrate the drop down answer prompts of ANALYSE.
Study design
Participants (n = 15, 5 male and 10 female, 19–31 years old) were recruited and required to interpret five ECGs (Table 1) using the ANALYSE approach (Figure 1) and again to interpret the same five ECGs using a standard ECG reporting format 11 (Figure 2) in two separate sessions. As a result, a total of 150 ECG interpretations were collected (75 interpretations using the standard approach and 75 interpretations using the devised ANALYSE method). Marks were awarded for accuracy of ECG analysis and interpretation. Scores were then compared for each format and sequence used (Table 2). Ethical approval for this study was granted from the ethics board of the Institute of Nursing and Health Research Centre at Ulster University.
The dominant features of the five 12-lead ECG recordings used with this study (as deducted through Figure 7).
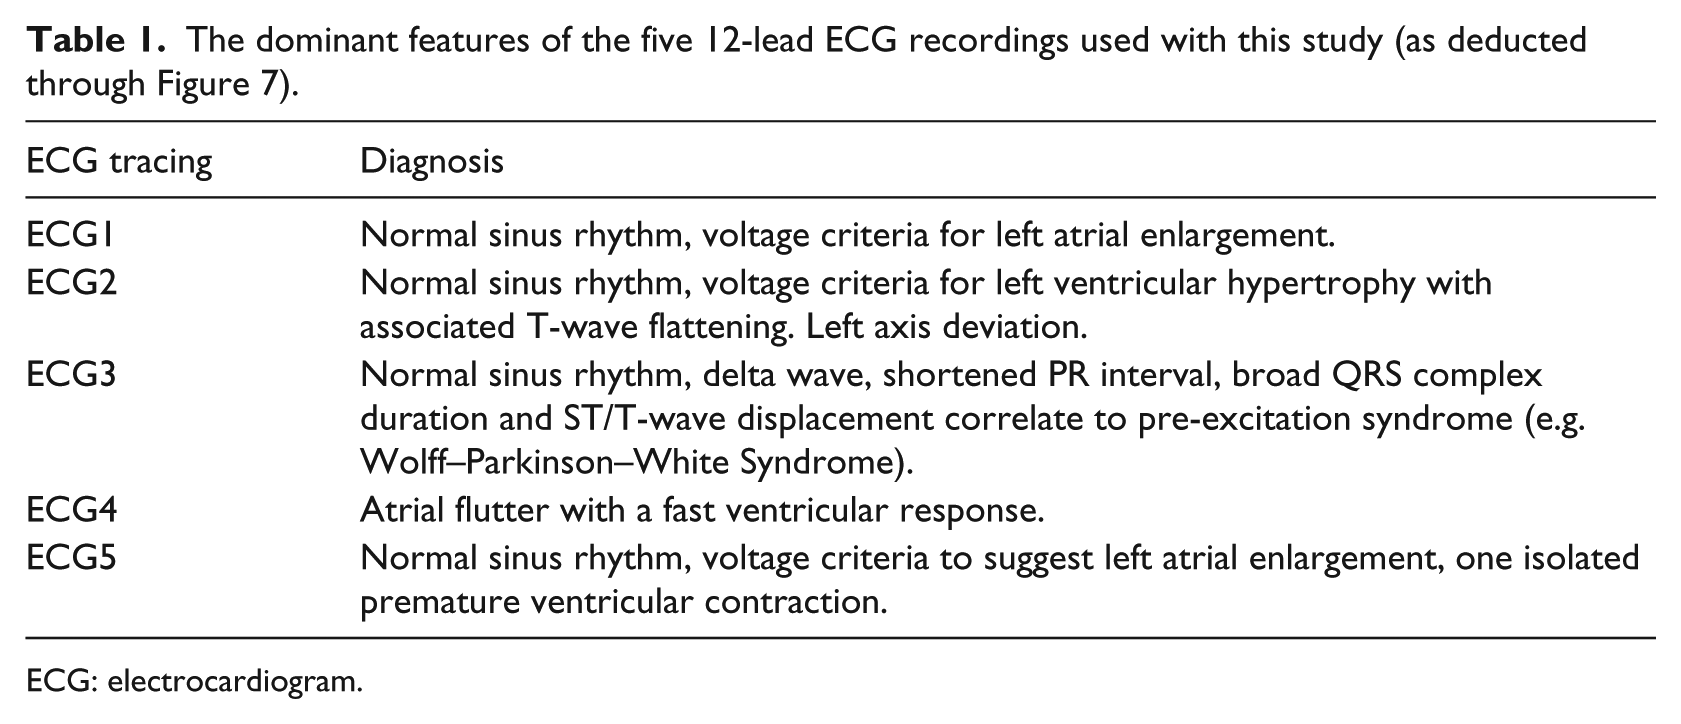
ECG: electrocardiogram.
Aggregated marks attained using the ANALYSE format when compared to the standard ECG reporting format. 11
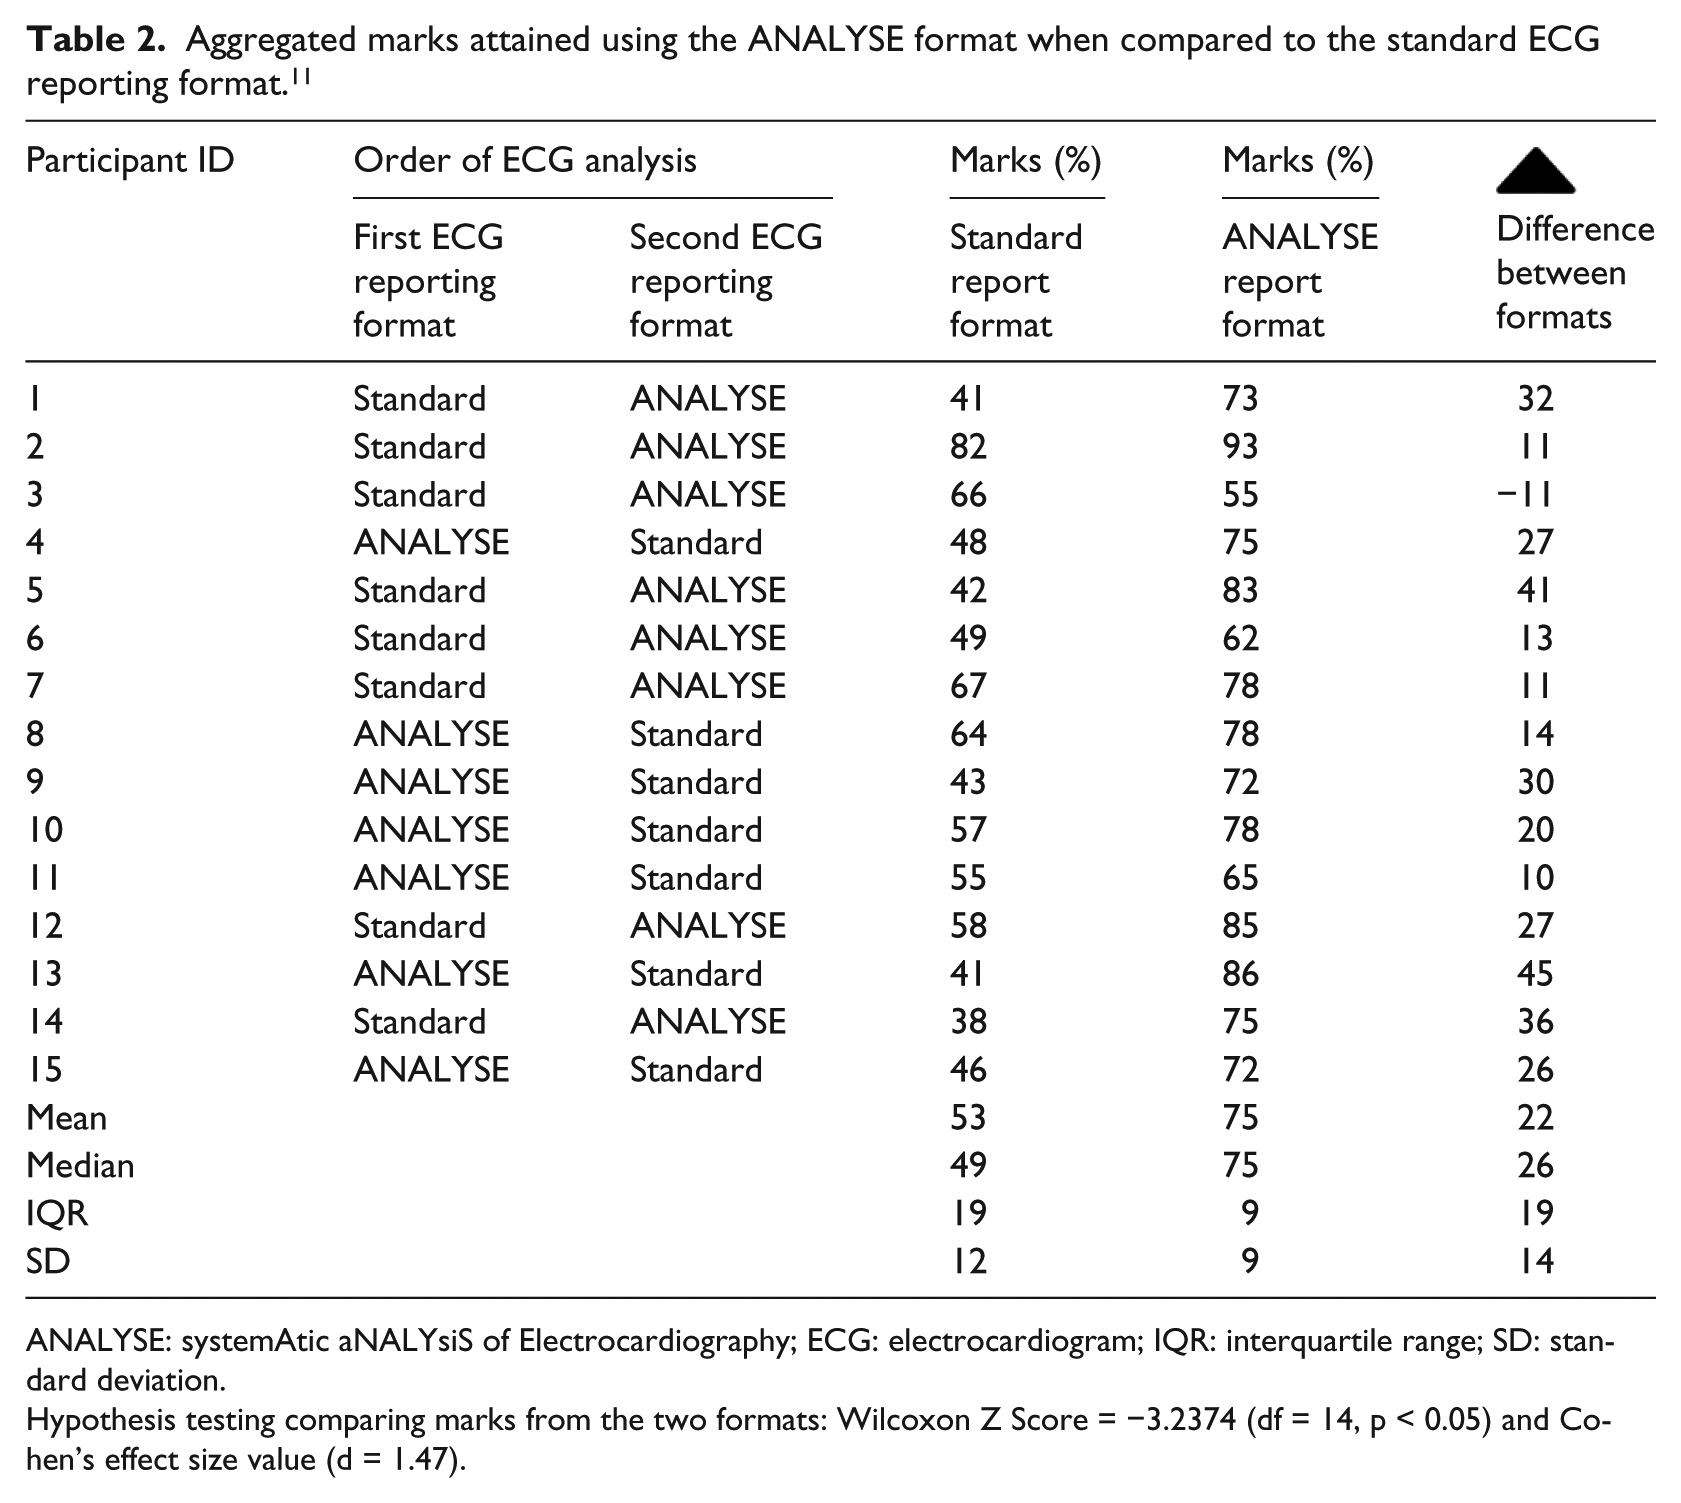

ANALYSE: systemAtic aNALYsiS of Electrocardiography; ECG: electrocardiogram; IQR: interquartile range; SD: standard deviation.
Hypothesis testing comparing marks from the two formats: Wilcoxon Z Score = −3.2374 (df = 14, p < 0.05) and Cohen’s effect size value (d = 1.47).
Recruitment
Students enrolled on module ECG interpretation within the Healthcare Science degree programme (Module Coordinator: Cathal Breen) were invited to partake in the study. The principal learning outcome for this module is 12-lead ECG interpretation in accordance with the national UK curriculum so an appropriate study cohort could be assured. 23 Recruitment to this study was advertised on student notice boards using posters. Students who volunteered sent an email to the module coordinator. An information sheet and a consent form were sent to the student following their initial communication.
Trial design
A cross-over randomised controlled trial (RCT) experimental design was used for this study. All participants attended a clinical skills laboratory to demonstrate their ECG interpretation competence. Participants were randomised in advance into groups (A or B) by having their names drawn from an envelope to determine the sequence of ECG interpretation format they would use (i.e. for the cross-over RCT). Group A (n = 8) initially used the ANALYSE format to interpret the ECGs and later used the standard ECG reporting format. Group B (n = 7) initially used the standard ECG reporting format to interpret the ECGs followed by the ANALYSE format. All students completed a questionnaire reporting their experience of the ANALYSE format to interpret the ECGs.
ECG interpretation
During the experiment, each participant was asked to visually inspect, determine measurements and document their interpretation of each of the ECG tracings using one of the two separate analysing formats (i.e. the standard form or the ANALYSE form). As aforementioned, the ANALYSE reporting format consisted of an interactive smart form which prompted the learner to complete a systematic ECG analysis. The ANALYSE tool provides decision support in the form of an aid memoir for critical parameters used when visually inspecting ECGs. Key analytical criteria (Figure 1) adopted from a range of published literature required the learner to input correct ECG interval measurements, align their interpretation to these values and provide descriptions of their visual inspection of the waveform morphologies to determine a complete analysis of the ECG tracing (Figure 7). For comparison, learners were asked to use an alternative traditional reporting format devised from the aligned professional body in the United Kingdom, the Society for Cardiological Science and Technology (SCST) 24 (Figure 2). The ECGs incorporated within this study were chosen based on the inclusion and illustration of precise electrical abnormalities in a unique or combined format aligning to the curriculum 23 and learning content delivered in a given week of the training period (1–4 weeks) and were consensually agreed appropriate by the teaching faculty who has expertise in clinical education and electrophysiology. All ECGs in this study were displayed electronically on a desktop PC and represented a sample of cardiac conditions (Table 1). A marking scheme for each ECG was devised by a panel of experts via consensual agreement focusing on accuracy of interval measurements, explanation of diagnosis and use of ECG terminology.
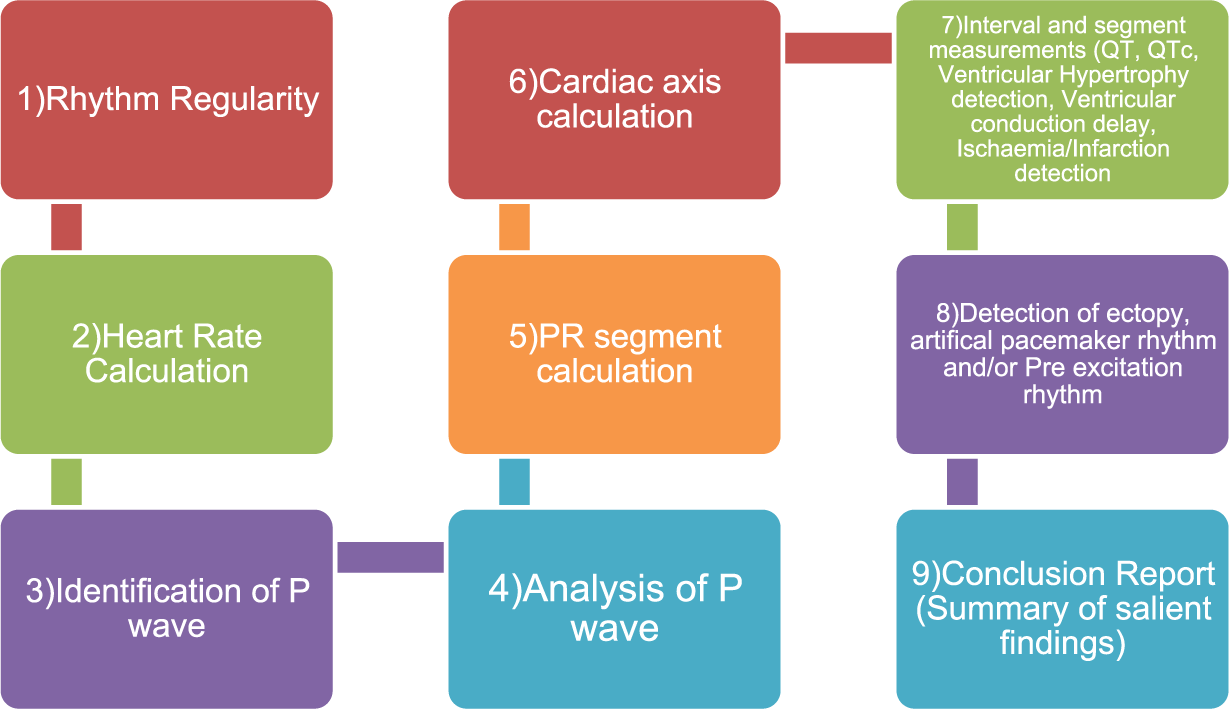
A flowchart to illustrate the work flow of ANALYSE smart form (refer to Table 1).
Data collection
Quantitative data from the ECG interpretations were in the form of marks, which were statistically analysed and compared. Statistics were generated and calculated using Microsoft Excel. Correlations were calculated using Cohen’s effect size (d values), and statistical significance testing was calculated using student’s t-test or Wilcoxon matched pairs test where appropriate with a significance value of p < 0.05. Statistics are presented in mean and median formats with standard deviation (SD), degrees of freedom (df) and/or interquartile ranges (IQRs). Experiential feedback data from each participant’s experience in using the ANALYSE reporting format were collected using a questionnaire. A total of 10 questions which incorporated Likert scales and comment boxes were disseminated following completion of the study.
Results
ECG findings
Performance data were calculated after each trial was completed (ANALYSE findings vs traditional). Marks were awarded based on how exactly answers correlated to those outlined within the score sheet (Supplementary Appendix 1). The overall aggregated mark attained using the ANALYSE format was 75 per cent (range = 55%–93%, SD = 9) and the overall aggregated mark attained using the standard format was 53 per cent (range = 38%–82%, SD = 12). A total of 14/15 participants consistently scored higher when interpreting ECGs using the ANALYSE format (range = 10%–45%). One participant scored lower using this format (−11%). A significant difference between the aggregated marks scored using the ANALYSE format and the standard format was calculated (Wilcoxon Z Score = −3.2374 (df = 14, p < 0.05) (Table 2). Figure 8 depicts box plots that illustrate the significant impact the ANALYSE tool has on ECG interpretation across the entire distribution.
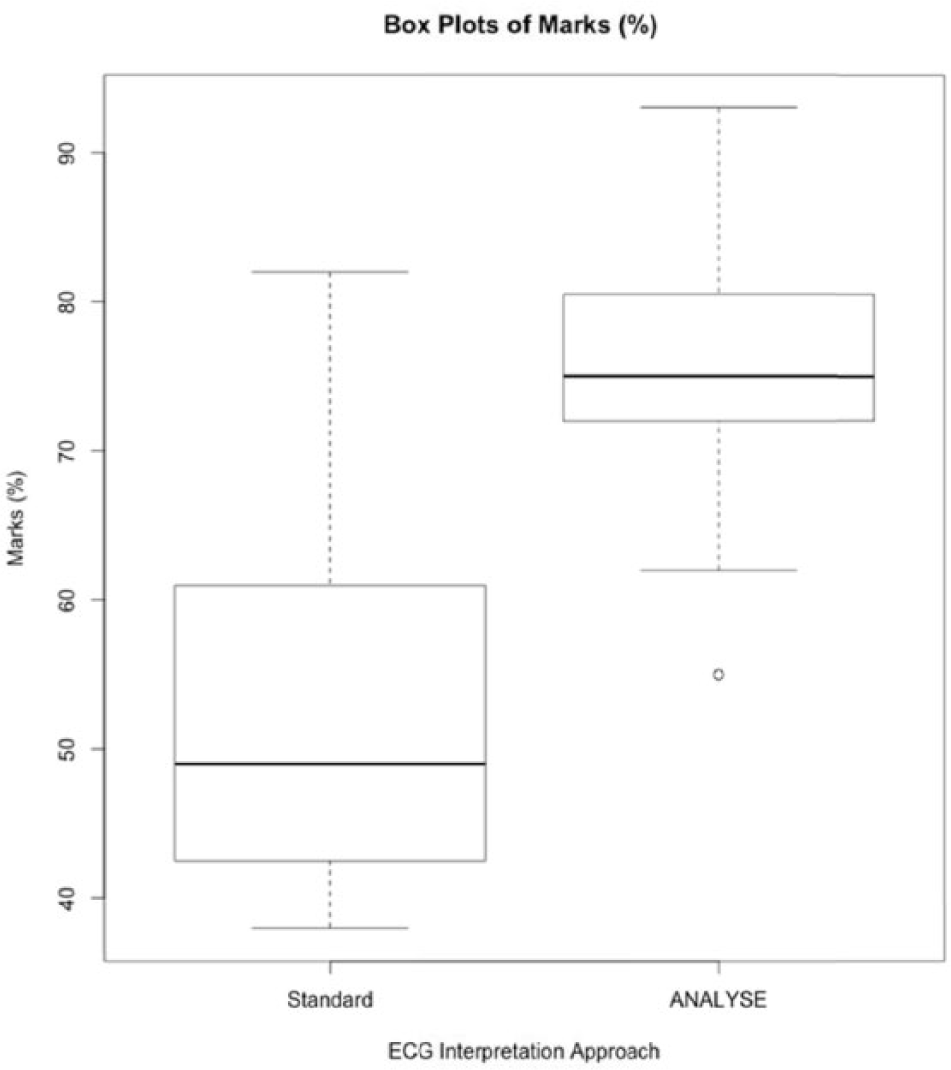
Box plots depicting the distribution of marks when using each of the ECG reporting formats.
Survey findings
The usefulness of the ANALYSE format was highly rated (mean = 9, median = 9, SD = 1), participants commented that ANALYSE was a faster and efficient ECG reporting mechanism that assisted in clarifying their answers and supporting their decisions particularly when they were uncertain. Participants rated the drop-down menu option most favourably (n = 15, 100%) stating that this feature is what enabled them to rapidly interpret the ECG (n = 12, 75%) and to do so more accurately (n = 9, 56%). Participants stated that using the ANALYSE format would improve their competence in learning ECG interpretation (n = 15, 100%). Decision-making is faster because the correct ranges of normality are available and really help with interpretation and the acquisition of this practical skill. All participants agreed that the ANALYSE format should be adopted into the curriculum of this topic (n = 15, 100%). Prior to completing the interpretation, participants rated their ability to interpret an ECG as low (median = 4, SD = 1) stating that they felt not knowledgeable enough at this stage of their learning, they lacked confidence in performing this skill and that they identified a lack of independent study (n = 5). No significant improvement in their confidence performing this skill on completion was reported (median = 5, SD = 2) although participants testified that the experience identified what gaps they had in their understanding and that ANALYSE assisted with identifying what a learner needs to know to achieve competency of this skill.
Discussion
Traditional teaching practices of ECG interpretation are didactical and they primarily focus on memorising diagnostic criteria and morphological patterns of ECG rhythms. 7 Memorising abstract signals, such as the shape of the complexes seen in ECGs, and associating them with disease processes has its limitations; thus, teaching ECG interpretation remains a challenge for educators. 4
The cardiological knowledge that is needed for interpreting ECG patterns can be categorised as morphological waveform knowledge of ECG tracings and the physiological event knowledge of the cardiac conduction system. 1 Accurate medical image interpretation is the culmination of a two-stage process that incorporates both the perceptual skills (they must be able to search the image and detect the abnormality) and the decision skills of the reader (once the abnormality is focused upon, readers must interpret it). Learning is accomplished by the repeated implementation of a skill which can be applied to every ECG tracing over and over again until fluency is achieved. 1 In this study, the Smart Form ANALYSE supported learner’s ECG interpretation ability by increasing the documentation of information acquired and improving compliance of relevant diagnostic terminology necessary to fully interpret an ECG. Like some DSS that use disease-specific templates, the Smart Form ANALYSE organises clinical data in a focused manner to facilitate decision-making and also highlights and ‘requests’ information related to ECG abnormalities.11–13
The curriculum for teaching ECG interpretation varies across learning establishments with the incorporation of indigenous protocols and techniques. In addition, different interpreters adopt various analytical techniques and nomenclature.
While it may be simplistic, the Smart Form ANALYSE may help educators to eventually develop more effective training in ECG interpretation to expedite the learning process in novices.
Limitations
This study design is a proof of concept and preliminary testing study investigating ANALYSE as a learning tool of ECG interpretation. A limitation of this study was the small number of participants sampled. This reflected the recruitment of participants enrolled on module ECG interpretation within the Healthcare Science degree programme (participation rate = 93.7%). This cohort offered a uniform sample to study as they possessed similar academic knowledge and clinical practical experience of the 12-lead ECG interpretation.
ECG tracings illustrating structural and/or rhythmical disturbances and abnormalities were incorporated for interpretation omitting ECG tracing of myocardial infarction. Testing to detect several ECG manifestations is a primary learning outcome of this module so that a participant can demonstrate advanced appraisal of clinical presentations. Due to the clinical relevance of this pathology and the consequence for patient management, future studies should incorporate ECG tracings of myocardial infarction.
Conclusion
The findings of this study demonstrate the clinical utility of a simple teaching Smart Form ANALYSE for the 12-lead ECG interpretation and its association with enhanced diagnostic performance in learners. Future studies involving larger numbers of subjects, from which the findings of this study will inform of the sample size calculation, and the incorporation of a broader range of ECG tracings are recommended.
Footnotes
Acknowledgements
All authors have made a contribution to this study. Breen study concept and design, data analysis and drafting of the manuscript. Bond and Finlay editing and critical revision of the manuscript. All authors provided approval to the final version. The study was performed in compliance with the World Medical Association Declaration of Helsinki on Ethical Principles for Medical Research Involving Human Subjects. Ethical approval for this study was granted from the ethics board of the Institute for Nursing and Health Research Centre at Ulster University. We can confirm that the views expressed in this submitted article are our own and not an official position of the institution or funder.
Clinical relevance
The purpose of the Smart Form ANALYSE was to support learners with ECG interpretation by increasing the documentation of information acquired and improving compliance of relevant diagnostic terminology necessary to fully interpret an ECG. The Smart Form ANALYSE is primarily a documentation tool and has many features including the ability to add, edit and delete structured ECG information. While it may be simplistic, the Smart Form ANALYSE may help educators to eventually develop more effective training in ECG interpretation to expedite the learning process in novices.
Declaration of conflicting interests
The author(s) declared no potential conflicts of interest with respect to the research, authorship and/or publication of this article.
Funding
The author(s) received no financial support for the research, authorship and/or publication of this article.