
Abstract
Despite acknowledging the value of clinical decision support systems (CDSS) in identifying risk for sepsis-induced health deterioration in-hospitalized patients, the relationship between display features, decision maker characteristics, and recognition of risk by the clinical decision maker remains an understudied, yet promising, area. The objective of this study is to explore the relationship between CDSS display design and perceived clinical risk of in-hospital mortality associated with sepsis. The study utilized data collected through in-person experimental sessions with 91 physicians from the general medical and surgical floors who were recruited across 12 teaching hospitals within the United States. Results of descriptive and statistical analyses provided evidence supporting the impact of display configuration and clinical case severity on perceived risk associated with in-hospital mortality. Specifically, findings showed that a high level of information (represented by the Predisposition, Infection, Response and Organ dysfunction (PIRO) score) and Figure display (as opposed to Text or baseline) increased awareness to recognizing the risk for in-hospital mortality of hospitalized sepsis patients. A CDSS display that synthesizes the optimal features associated with information level and design elements has the potential to enhance the quantification and communication of clinical risk in complex health conditions beyond sepsis.
Keywords
Introduction
Sepsis is a high-mortality clinical condition caused by an inflammatory response to infection, resulting in 1.7 million hospitalized patients and 270,000 deaths per year in the United States. With an annual increase in incidence by 8.7% in the last two decades, sepsis has posed a growing challenge for disease management in-hospital setting. 1 Despite acknowledging the importance of early identification and treatment of hospitalized patients, clinical risk perception remains a major obstacle to sepsis management.2–5 Risk in this context refers to the probability that an individual experiences sepsis-induced health deterioration during their hospitalization (e.g., in-hospital death due to organ system dysfunction caused by sepsis). Perception refers to the recognition of this risk by the clinical decision maker (e.g., physician).
Understanding and communicating clinical risk perception associated with sepsis-induced deterioration in a hospital setting is a challenging problem. First, commonly observed sepsis symptoms such as tachycardia, tachypnea, fever, and hypothermia are not specific to sepsis and can present across a wide variety of conditions (e.g., trauma). Second, sepsis trajectory is influenced by patient-specific characteristics including age, immunologic status, and characteristics of the infection.6–8 For example, immunosuppressed patients may not always present with sepsis symptoms such as fever. Third, understanding the clinical risk based on observed physiological signs is challenging due to the limited available pre-hospital information which could provide key insights about the early stages of sepsis trajectory, and the subjective nature of clinicians’ perception of the signs of sepsis.9,10 Finally, the consequences of delayed, or lack of, clear communication of clinical risk associated with sepsis-induced health outcomes are severe and, at worst, can result in irreversible organ damage and death.
Clinical decision support systems (CDSS) grow more common to address these challenges in understanding and communicating the perceived clinical risk. CDSS are ideally integrated into clinical workflow as embedded tools within electronic health records (EHR). 11 While there is variability among CDSS with regards to input data and methods used to communicate risk (e.g., alerts and dashboards), 12 CDSS often have two goals in common: (i) to translate data into a quantification and/or depiction of clinical risk and (ii) to communicate that risk to the decision makers as clearly and efficiently as possible. However, care delivery decisions are influenced not only by the clinical risk quantified and communicated by a CDSS, but also by clinician-specific features, such as the clinical role and frequency at which the clinician treats sepsis patients. For example, Poeze et al. 13 ’s study shows that intensivists exhibit higher awareness to risk of undesired health outcomes associated with sepsis compared to other specialists with less exposure to patients with sepsis. Ultimately, this necessitates a CDSS design that accounts for the clinician-specific features when quantifying, visualizing, and communicating clinical risk.
The objective of this study is to explore the relationship between CDSS display design, frequency at which the decision maker treats sepsis patients, and perceived clinical risk of in-hospital mortality associated with sepsis. Leveraging two sepsis scoring systems, the quick Sequential (sepsis-related) Organ Failure Assessment (qSOFA) score 14 and the Predisposition, Infection, Response, and Organ dysfunction (PIRO) staging model,15–17 and selected display design elements, we analyze the differences in presentation and communication of clinical risk for in-hospital mortality through systematic changes in CDSS display configuration. Specifically, we hypothesize that a clinician’s perception of sepsis-related clinical risk for in-hospital mortality depends on the frequency of treating sepsis as part their clinical workflow (referred as exposure level in the remainder of the article) and display configuration which is informed by the severity of illness score information level and design components of the display.
Methods
Study population and design
The data was collected through in-person experimental sessions with study participants in the form of a 90-min simulation and usability study utilizing 10 unique, de-identified clinical cases integrated within simulated EHR systems. Participants (91 physicians from the general medical and surgical floors) were recruited across 12 teaching hospitals within the United States.
The study design used a series of de-identified clinical cases, that is, clinical scenarios derived from real patients’ hospitalization data. The information from these cases were integrated into a simulated EHR environment and shown to study participants to examine their clinical risk perception as a function of three features: • display type (baseline, pictoral, or text), • information level (low or high), and • clinical scenario severity (early stage or severe).
Display type was categorized by the utilization of additional text or figure compared to baseline. Baseline is a display type that presents the clinical cases without additional text or pictorial design elements, and without the additional Predisposition, Infection, Response and Organ dysfunction (PIRO) staging score or quick Sequential (sepsis-related) Organ Failure Assessment (qSOFA) information. Information level was categorized by using two sepsis scoring systems (qSOFA and PIRO). In this context, qSOFA represents low information level since the score calculation only requires and displays mental status, respiratory rate, and blood pressure. PIRO represents high information level because the score calculation requires and displays multiple clinical features. As for clinical scenario severity, early stage (low) and severe sepsis (high) were defined using established severity of illness scores which are further described in Desciption of Patient Cases
Clinical cases included five early clinical severity cases (cases 1–5) and five severe clinical severity cases (cases 6–10). Each clinical case (excluding cases 1 and 6) was presented with a CDSS corresponding to combinations of information and display type levels. The order in which the cases were shown to each study participant was randomized to avoid any potential bias introduced by the order. Cases 1 and 6 were designed to represent the “baseline,” that is, the CDSS display presented the cases without additional text or pictorial design elements, and without the additional PIRO or qSOFA information. Supplementary Figure A1 in the Appendix illustrates the display configurations that the participants were exposed to during the study.
Desciption of patient cases
The cases used to determine the clinical scenario severity (categorized as early stage and severe) were derived from 10 unique, randomly selected, and de-identified patient cases. These patients were hospitalized at an 1100-bed major tertiary care health care system in United States. All 10 patients met the criteria for infection and were diagnosed with sepsis during their hospitalization. The information derived from the patient cases specifically focused on the observed organ dysfunction associated with sepsis-induced health deterioration during hospitalization. Organ dysfunction was defined using the physiological criteria used in Sequential Organ Failure Assessment (SOFA) score. 18 SOFA score assigns weights to physiological variables in six categories on a 5-point (0–4) scale depending on the severity of the observed abnormality. The six organ system categories are as follows: respiratory, coagulation, liver, cardiovascular, central nervous system, and renal.
The Sepsis-3 consensus definition of sepsis recommends a SOFA score of two or more be used to identify organ dysfunction. 14 Consistent with this definition and domain experts’ input, a case was labeled as “early-stage” (associated with low risk of in-hospital mortality) if the patient had an observed SOFA score of two or more associated with a single organ system category (out of the six categories listed above). A case was labeled as “severe” (associated with high risk of in-hospital mortality) if the patient had an observed SOFA score of two or more in more than one organ system category and was administered vasopressors during hospital admission. Patient status was measured at time of admission to the general medical floor.
Data collection and analysis
The following patient-specific data elements were included in each clinical case: patient’s age and gender, time of arrival to the hospital, discharge disposition, medical history, clinical assessments (e.g., neurological), vital signs measured during the first 12 h after triage, and clinical events (e.g., change in care level such as transfer from lower to higher intensity care). Participants were given approximately 3 min to review the clinical scenario before being presented with one of the following CDSS display configurations: • Baseline (simulated EHR with no additional text or figure visualizing the clinical risk associated with in-hospital mortality and no additional severity of illness information), • qSOFA Text (simulated EHR with an additional display visualizing clinical risk using text and low information level), • PIRO Text (simulated EHR with an additional display visualizing clinical risk using text and high information level), • qSOFA Figure (simulated EHR with an additional display visualizing clinical risk using figure and low information level), and • PIRO Figure (simulated EHR with an additional display visualizing clinical risk using figure and high information level).
After reviewing each clinical case, participants were asked questions about their prediction of in-hospital mortality risk associated with each clinical case and their decisions related to care management. Data collection workflow is illustrated in the Appendix (Supplementary Figure A2). The outcome variables were the numerical and categorical perceived clinical risk for in-hospital mortality in each clinical case, and were derived from participants’ response to the following two questions: • What is your estimate for this patient’s risk of in-hospital death? (Select low, moderate or high), and • What is your numerical estimate for this patient’s risk of in-hospital death (percent)? (Select a number between 0 and 100%).
The first question captures participants’ perceived clinical risk associated with each clinical case as a categorical variable, referred as categorical perceived risk in the remainder of the article. This question does not provide any definitions of low, moderate, or high; rather, it allows the participant to provide their own risk perception for in-hospital mortality based on the presented information. The second question asks participants to quantify their perceived clinical risk for in-hospital mortality as a numerical value between 0 and 100%, referred as the numerical perceived risk in the remainder of the article.
Utilizing participants responses, data analysis focused on the following study questions: • Does the exposure level impact perceived risk of in-hospital mortality? • Does the display configuration impact the perceived risk?
Exposure level was defined as the frequency at which the participating physician treats sepsis patients as part of their workflow. Specifically, exposure level was captured as a categorical variable using the following question: “How frequently do you see/treat sepsis patients?” with five possible values: Never; Rarely (1–2 patients per month); Sometimes (1–2 patients per week), Often (1–2 patients per shift); and All the time (3 or more patients per shift). Cutoff values for exposure level categories were informed by clinician input. While the display configuration is a potential factor impacting the risk perception, exposure to treating sepsis cases can also impact clinical risk perception.19–23 Thus, the question about frequency of treating sepsis patients aims to explore the impact of exposure level on the outcomes of interest.
Descriptive and statistical analysis explored the impact of CDSS display configuration and exposure level on the perceived clinical risk associated with in-hospital mortality. Data were analyzed with Kruskal–Wallis rank sum tests and χ2 tests. p < 0.05 was considered statistically significant.
Results
Study population features
Study population characteristics. All data is self-reported, collected in an electronic survey administered prior to participation in the study.
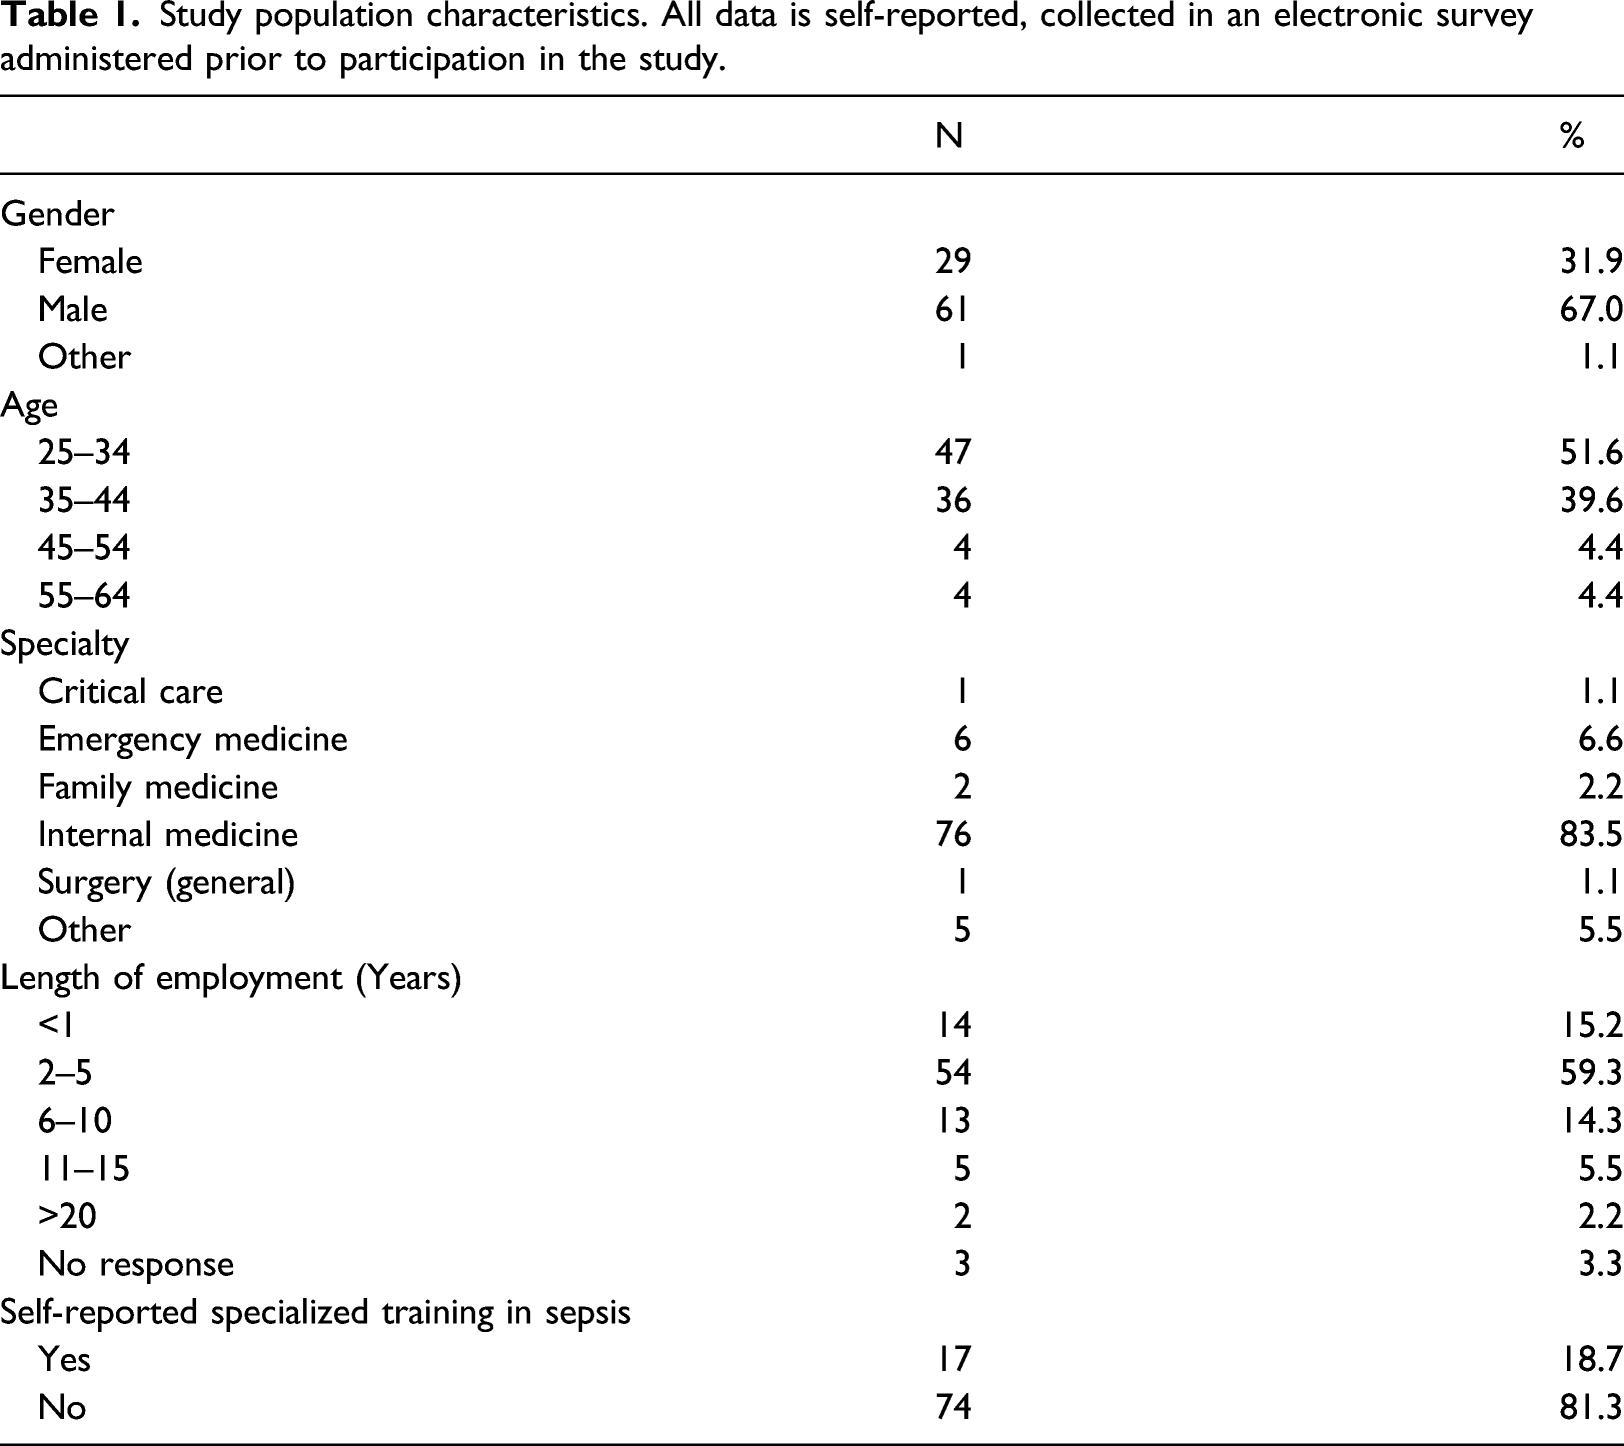
Most physicians were male (67.0%), employed between 2 and 5 years (59.3%), and in the age group 25–34 years (51.6%). Internal medicine was the most commonly observed specialty (83.5%). The majority of participants (81.3%) did not have a specialized training in sepsis.
Exposure level and perceived risk
With regards to exposure level, the majority of the 91 study participants categorized themselves into the Often category, followed by Sometimes category (Never: two physicians; Rarely: 10 physicians; Sometimes: 30 physicians; Often: 44 physicians; and All the Time: five physicians). Figure 1 illustrates the adjusted number of clinical cases, that is, number of clinical cases for which participants provided a categorical risk perception divided by the number of participants in that exposure level) for different combinations of clinical case severity and categorical risk perception. Number of clinical cases for which participants provided a categorical risk perception divided by the number of participants in each exposure level (never, rarerly, sometimes, often and all the time). For each exposure level, the bar chart is color-coded: black indicates that both clinical case severity and participant’s categorical risk perception are high; dark gray indicates that clinical case severity is high but the participant’s categorical risk perception is low or moderate; light gray indicates that clinical case severity is low but the participant’s categorical risk perception is high; and white indicates that clinical case severity is low and the participant’s risk perception is low or moderate.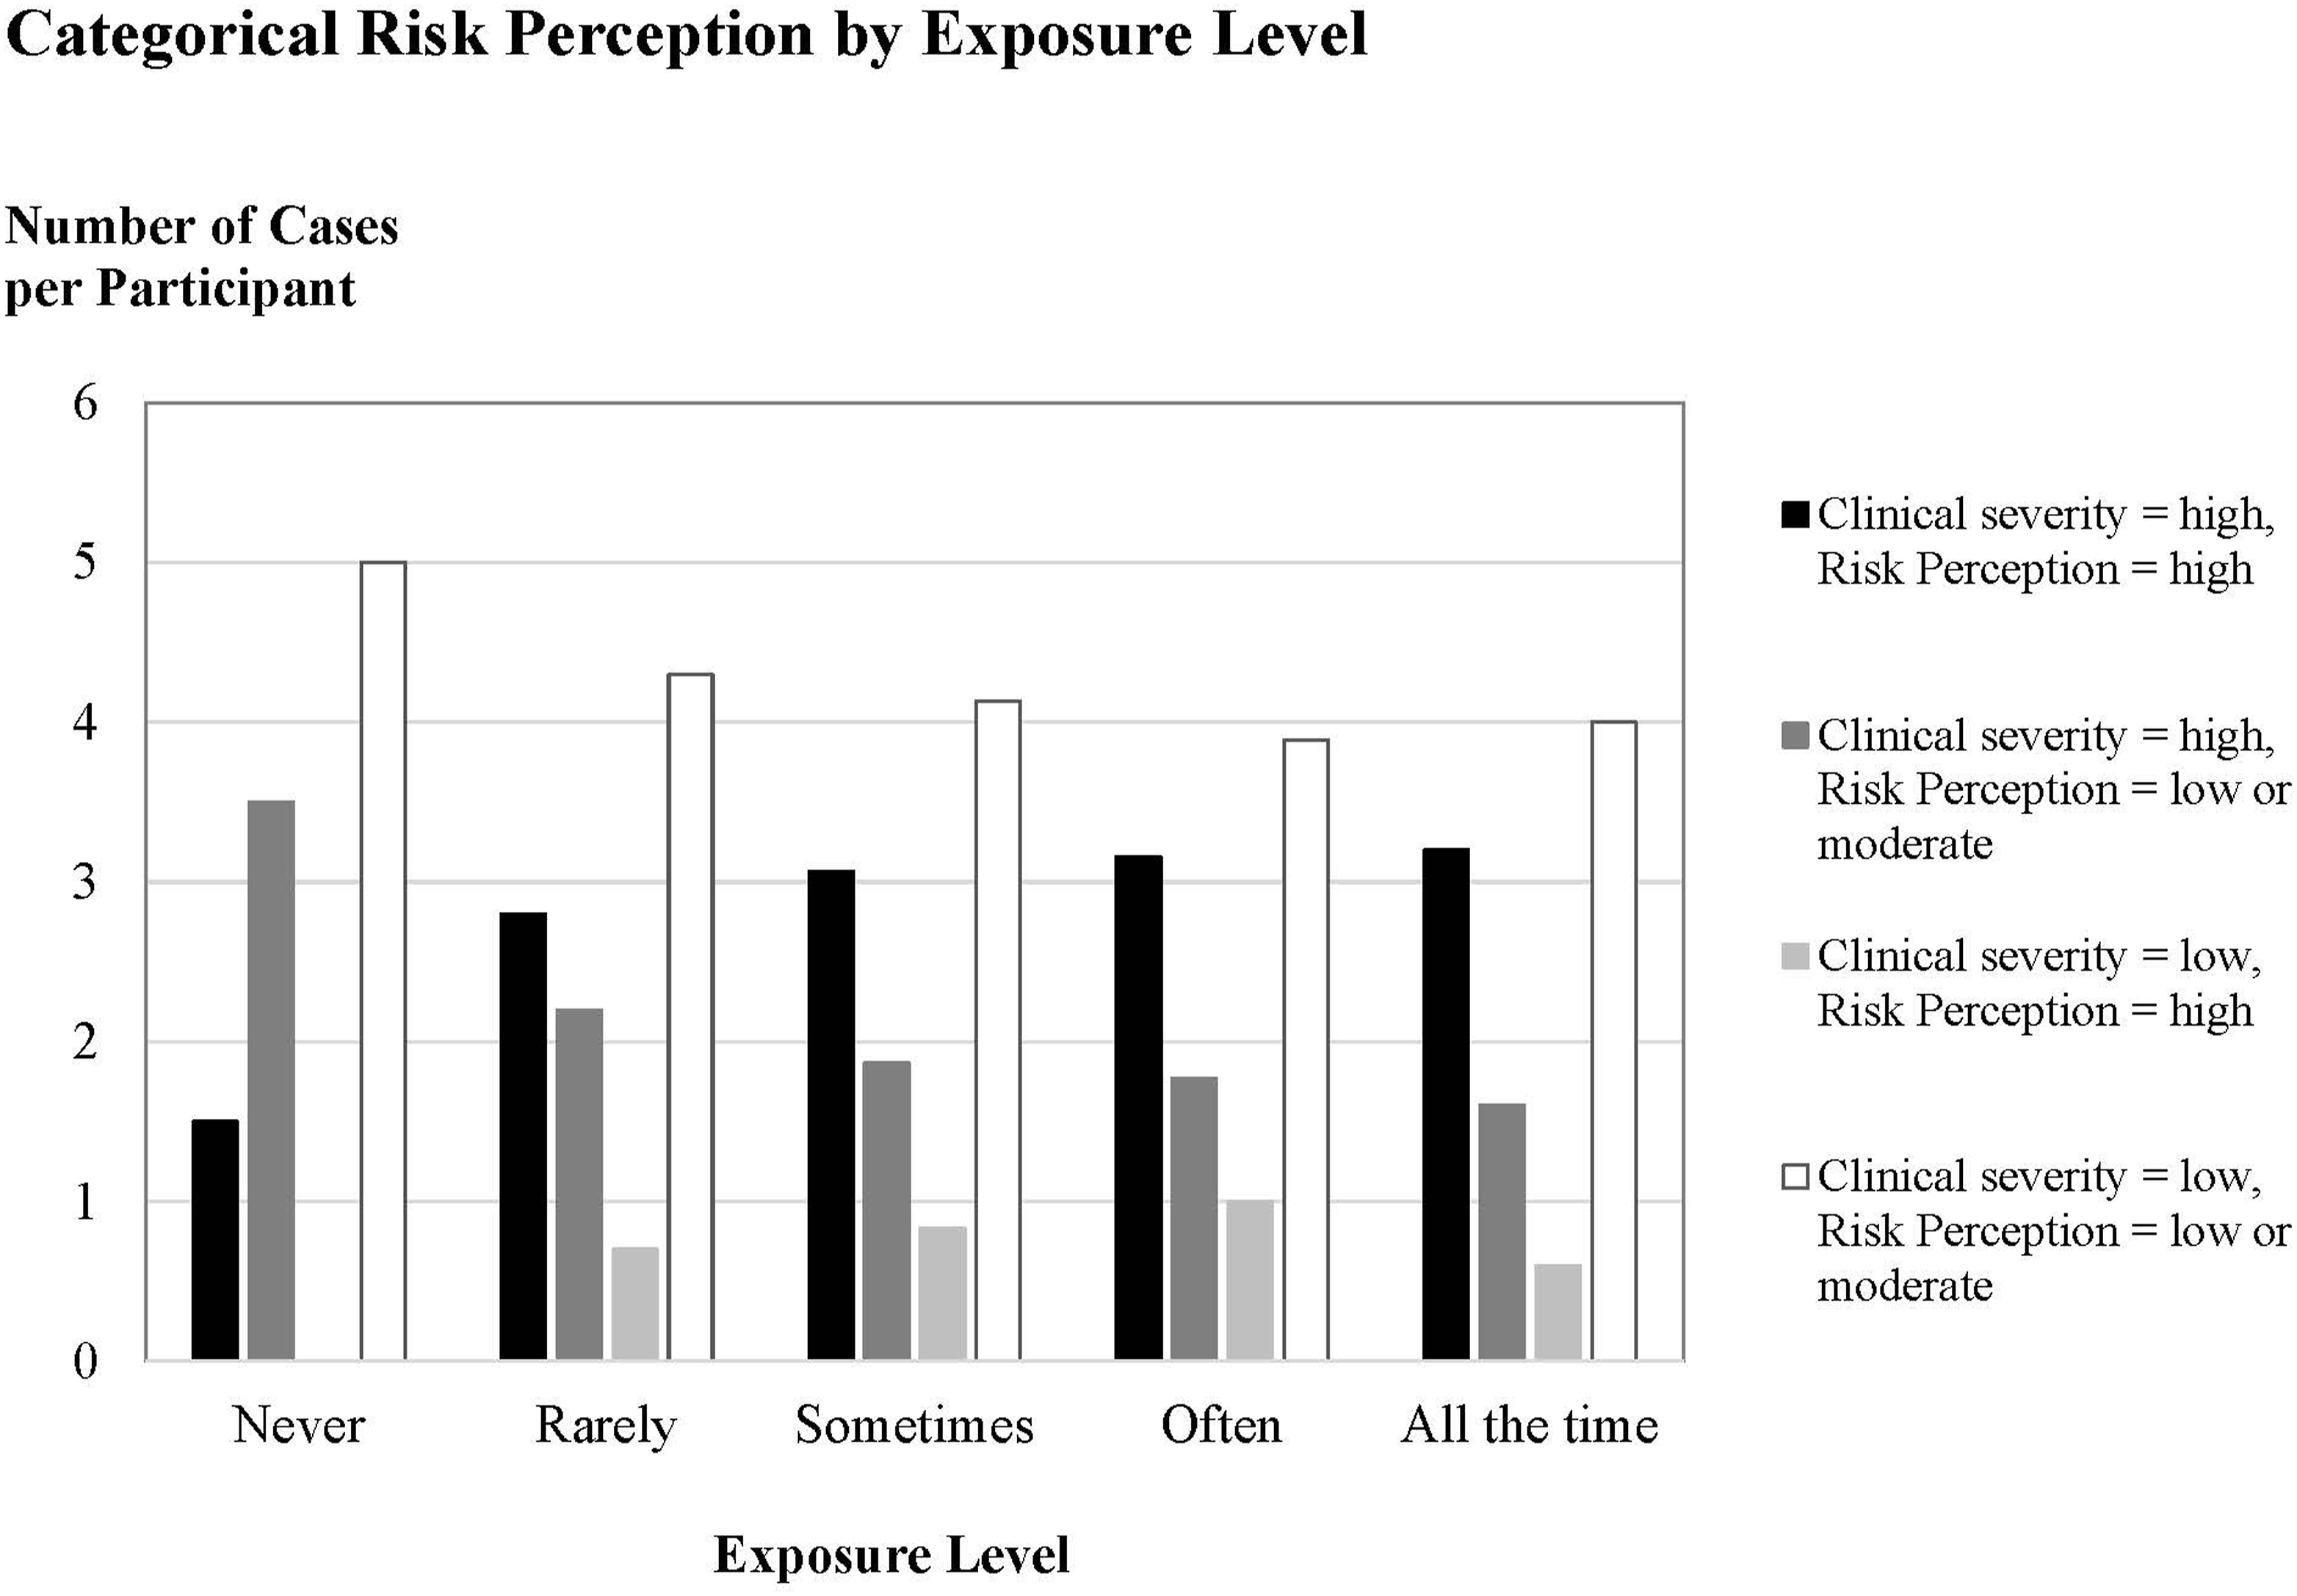
The horizontal axis in Figure 1 shows the exposure level in increasing order from left to right (i.e., from “Never” to “All the Time”). The vertical axis of Figure 1 shows the count of cases for which the participants provided a categorical perceived risk response (low, moderate or high) divided the number of reviewed cases by the number of participants who self-identified in that given exposure level. Number of cases are divided by number of participants with the goal to adjust the case counts since some exposure categories have more participants associated with them than others. For each exposure level, a clinical case can fall into four categories that are color-coded (Figure 1). Black and white indicate where clinical case severity and participant’s categorical risk perception matched. For example, black indicates that both clinical case severity and the participant’s categorical risk perception for the given case are high. White indicates that clinical case severity of the case is low and the participant’s categorical risk perception is also low or moderate. Dark gray and light gray indicate differences between clinical case severity and participant’s categorical risk perception. For example, dark gray indicates that clinical case severity is high but the participant’s categorical risk perception is low or moderate. Light gray indicates that clinical case severity of the case is low but the participant’s categorical risk perception is high.
Figure 1 suggests that if the clinical case severity is high, some exposure levels may have an impact on the categorical risk perception. For example, based on the black bars in Figure 1, participants with exposure level “Never” show a lower number of cases per participant (vertical axis value 1.5) where both clinical case severity and categorical risk perception are high compared to participants with higher exposure levels (vertical axis value between 2.8 and 3.2 for the other four exposure levels). Based on the dark gray bars in Figure 1, if the clinical case severity is high, participants with exposure level “Never” show a higher divergence by perceiving the case as low or moderate (vertical axis value 3.5) compared to participants with higher exposure levels (vertical axis value between 1.6 and 2.2 for the other four exposure levels). For the cases with low clinical case severity, all exposure levels show similar trends in adjusted number of cases suggesting that exposure level may not have an observed impact on perceived categorical risk. These findings are tested statistically to test the null hypothesis: • Null hypothesis 1: categorical risk perception (i.e., perceived risk category high, moderate, and low risk with regards to in-hospital mortality) and exposure level are independent.
The χ2 test failed to reject the null hypothesis that exposure level and categorical risk perception are independent (p =0.328 for high clinical severity cases, p=0.2648 for low clinical severity cases, p=0.2813 for the entire data without clinical case severity level distinction).
Display configuration and perceived risk
For the purposes of this data analysis, information level and display level associated with a given clinical case were combined into one categorical variable display configuration with five possible values: Baseline, qSOFA Text, PIRO Text, qSOFA Figure, and PIRO Figure (as described in Data Collection and Analysis section). Due to violation of the normality assumption in response data, non-parametric tests were used to test the following null hypotheses: • Null hypothesis 2: display configuration (with five levels: Baseline, qSOFA Text, PIRO Text, qSOFA Figure, and PIRO Figure) does not impact the numerical perceived risk, • Null hypothesis 3: clinical severity level (with two levels: low or high) does not impact the numerical perceived risk.
Kruskal–Wallis rank sum test rejected both null hypotheses 2 and 3 (p< 0.0001 for both tests). Thus, results show that there is evidence that the display configuration and clinical case severity impact participants’ numerical risk perception. Next, we explored “how” display configuration impacts the numerical risk perception. Results show that compared to Baseline, PIRO text, qSOFA Figure and qSOFA Text decrease the average numerical risk perception by 11.12, 7.06 and 15.6%, respectively (p < 0.001), whereas PIRO Figure slightly decreases the risk perception (1.8%). When compared pairwise, results showed the following: • PIRO text versus PIRO Figure: Figure increased average numerical risk perception by 9.32%, • qSOFA text versus qSOFA Figure: Figure increased average numerical risk perception by 8.6%, • qSOFA Figure versus PIRO Figure: PIRO increased average risk perception by 5.26%, and • qSOFA Text versus PIRO Text: PIRO increased average risk perception by 4.52%.
Further, an interesting interaction was observed between the display configuration and clinical case severity with regards to the average numerical risk perception (Figure 2). Bar chart visualizing the average numerical risk perception for each combination of display configuration (Baseline, qSOFA Text, qSOFA Figure, PIRO Text, PIRO Figure) and clinical case severity (low or high). Numerical risk perception of a participant is the response to the question: “What is your numerical estimate for this patient’s risk of in-hospital death (percent)? (Select a number between 0 and 100%),” as discussed in Methods section. Average refers to the average numerical risk perception response of 91 study participants for each display configuration and clinical severity level.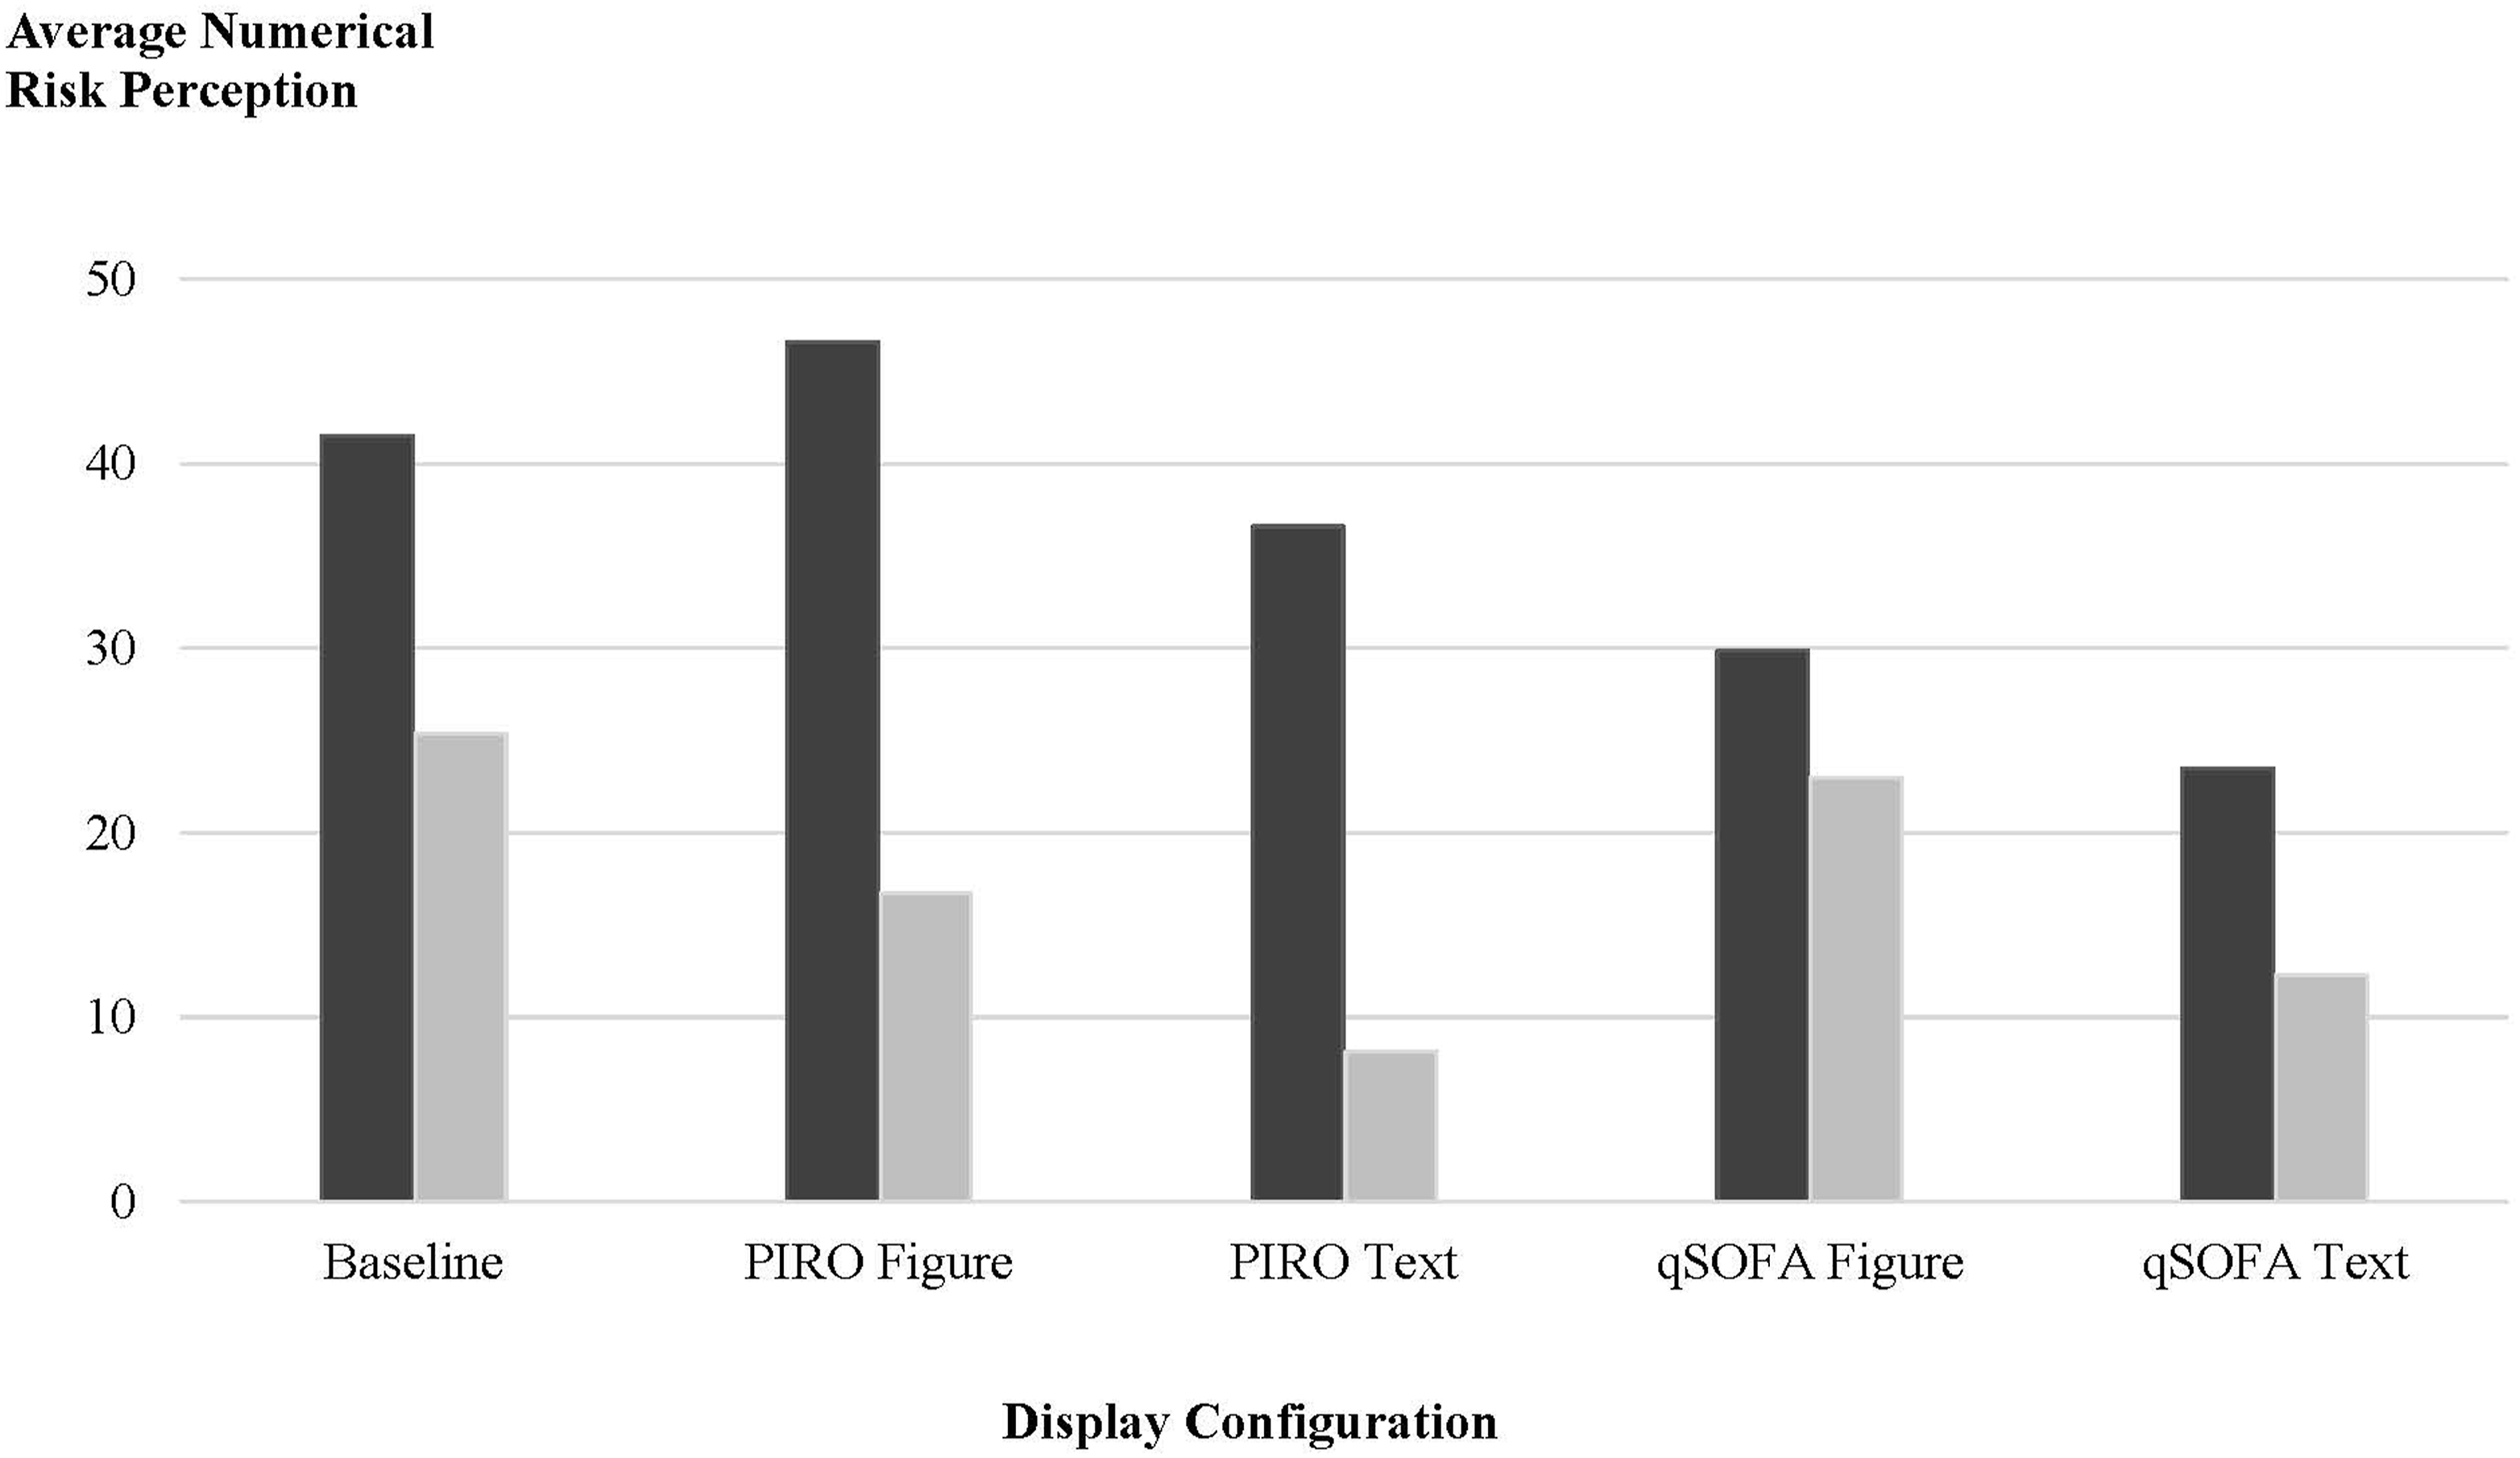
Figure 2 shows that as the clinical case severity decreases from high to low, the average numerical risk perception decreases, as expected, for all five display configurations. However, the amount of decrease in the average numerical risk perception highlights the difference between display configurations.
Exposure level, display configuration, and perceived risk
To analyze the relationship between exposure level, display configuration, and numerical risk associated with in-hospital mortality, Figures 3 and 4 show the boxplot of numerical perceived risk categorized by display configurations and exposure level. This study focuses on the impact of display configuration and exposure level on perceived numerical risk. Therefore, we chose to visualize and analyze the responses of numerical risk perception in low and high clinical severity cases separately, because the perceived clinical risk can be biased by the underlying clinical severity, that is, high clinical case severity scenarios can naturally result in higher perceived numerical risk, independent of how the information is displayed and what the exposure level of the participant is. Numerical risk perception responses to high clinical severity cases are shown in Figure 3 and responses to low clinical severity cases are shown in Figure 4. Boxplot of numerical risk perception values associated with in-hospital mortality (from 0 to 100%) specific to high clinical severity case responses categorized by exposure level. High clinical severity is defined in the Methods section. No Alert represents the Baseline. Dots indicate outliers. Boxplot of numerical risk perception values associated with in-hospital mortality (from 0 to 100%) specific to low clinical severity case responses categorized by exposure level. Low clinical severity is defined in the Methods section. No Alert represents the Baseline. Dots indicate outliers.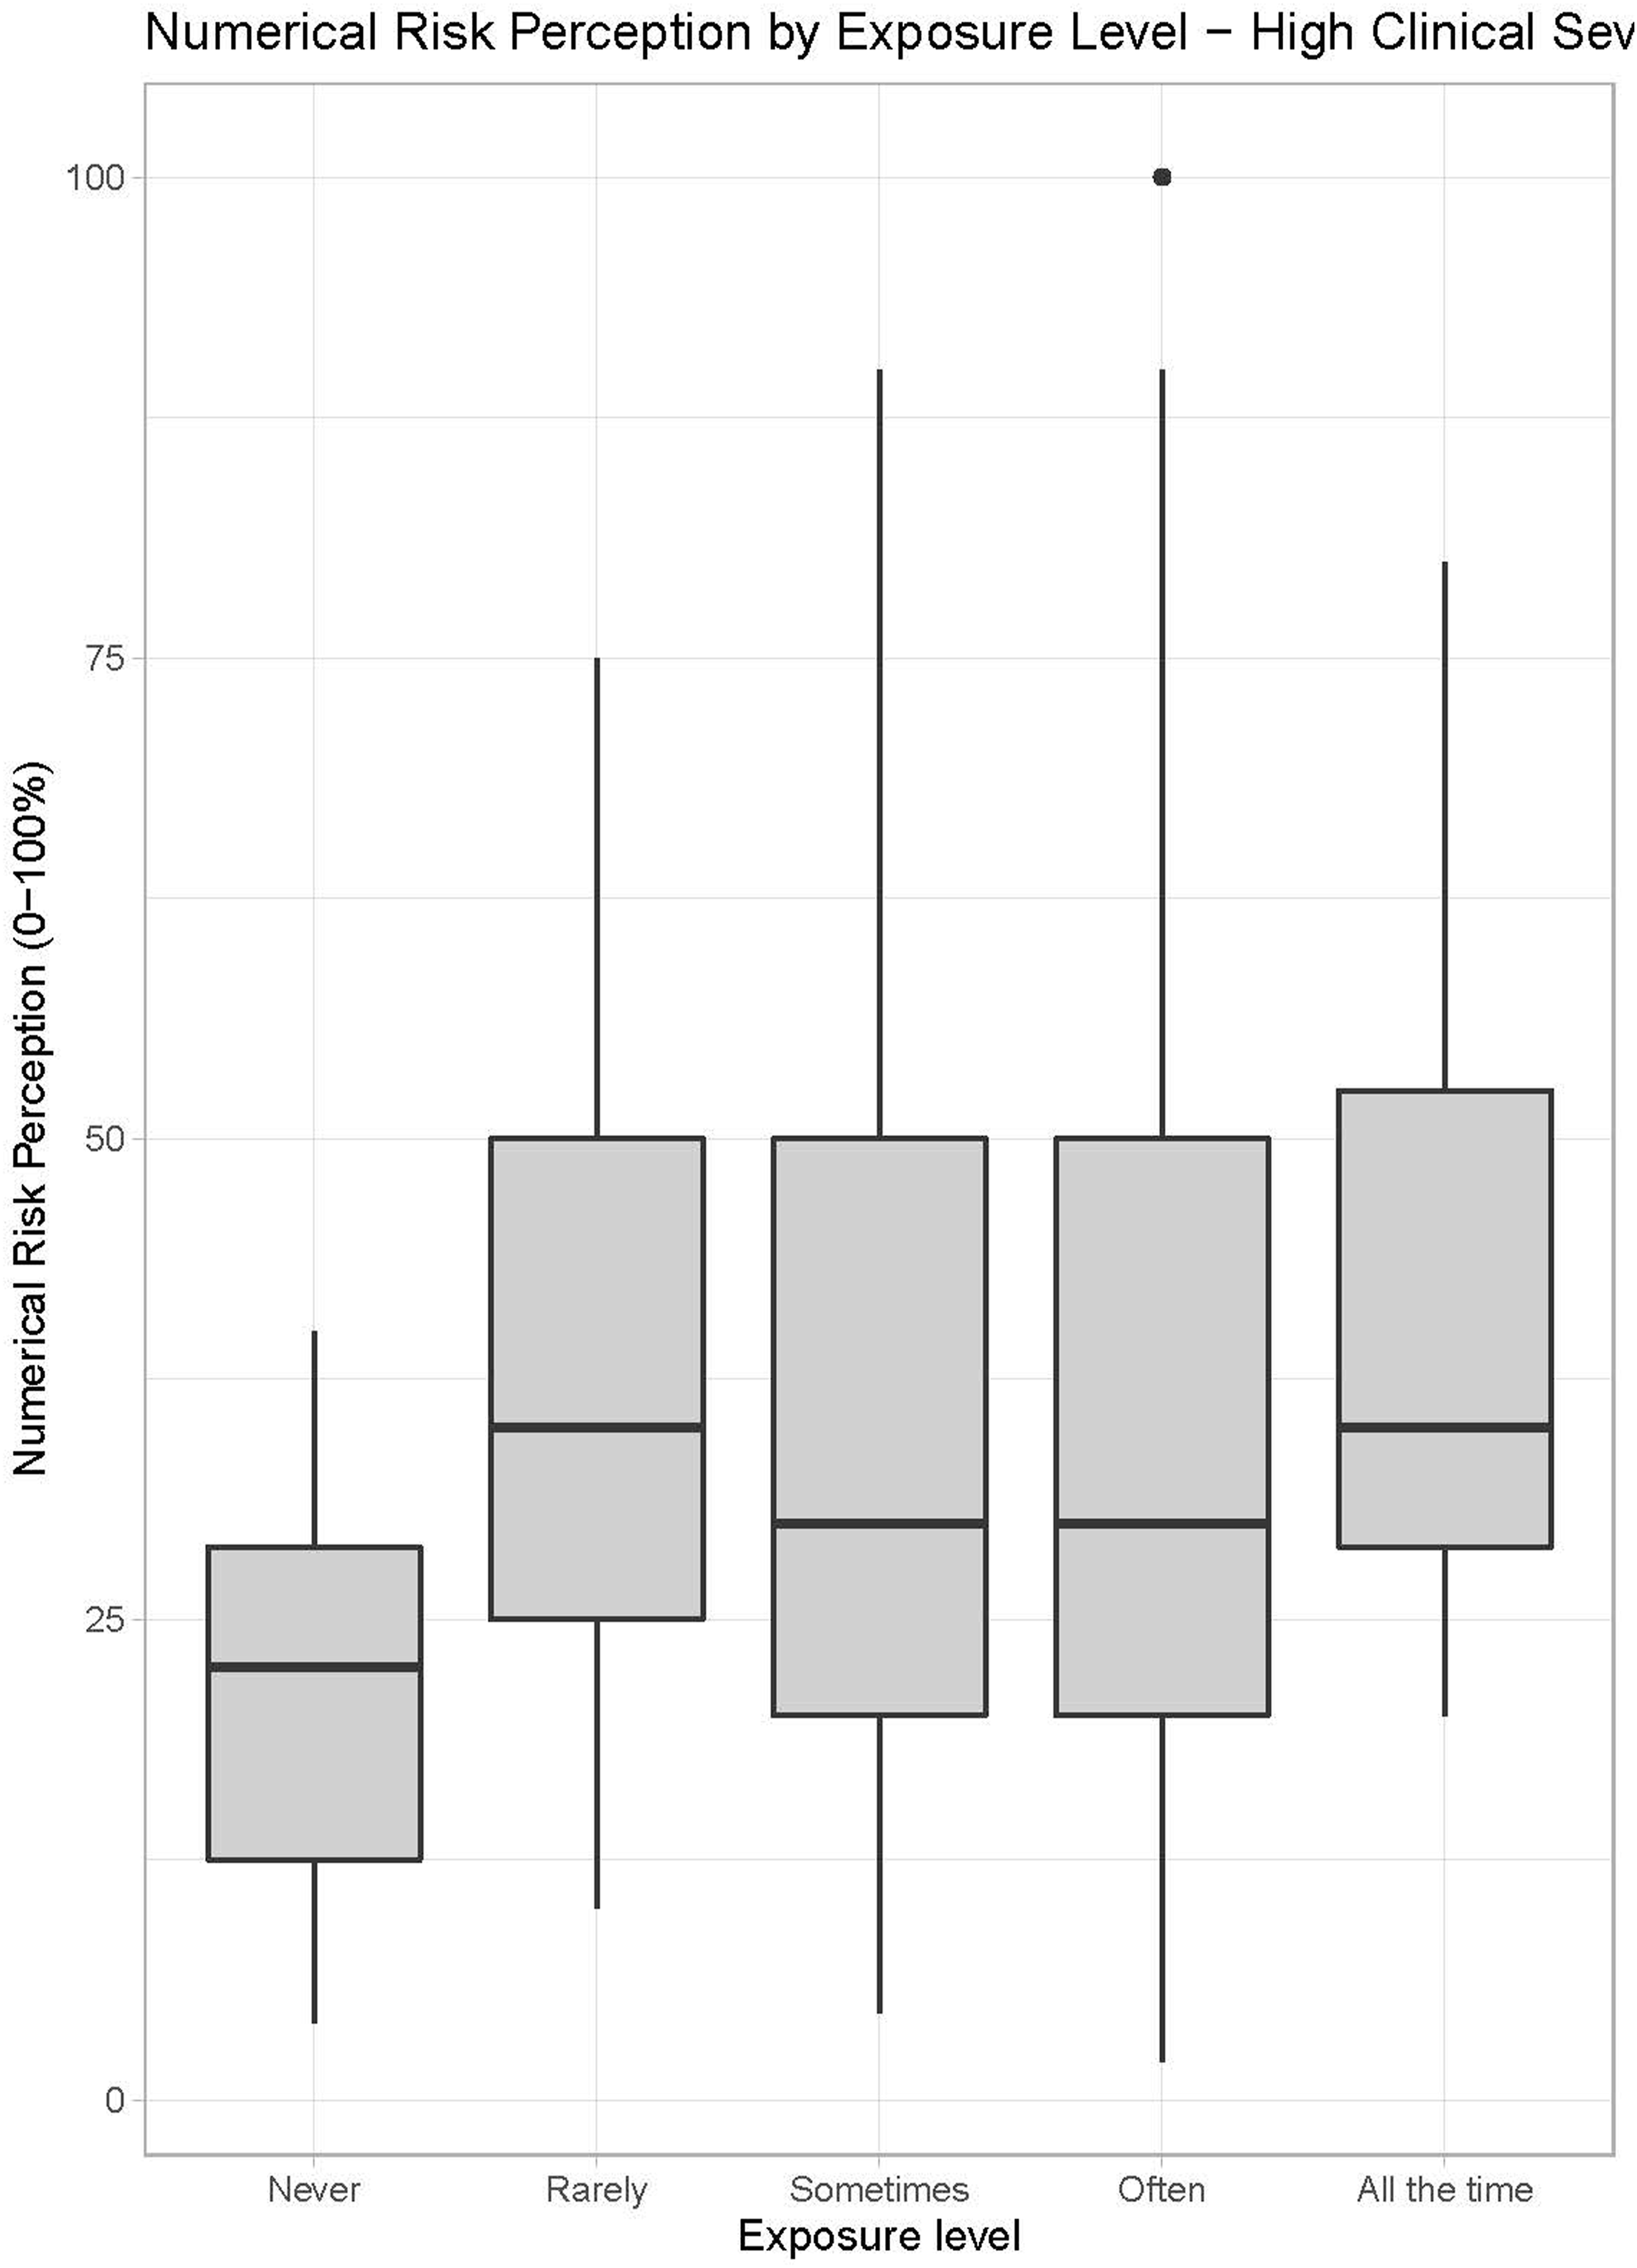
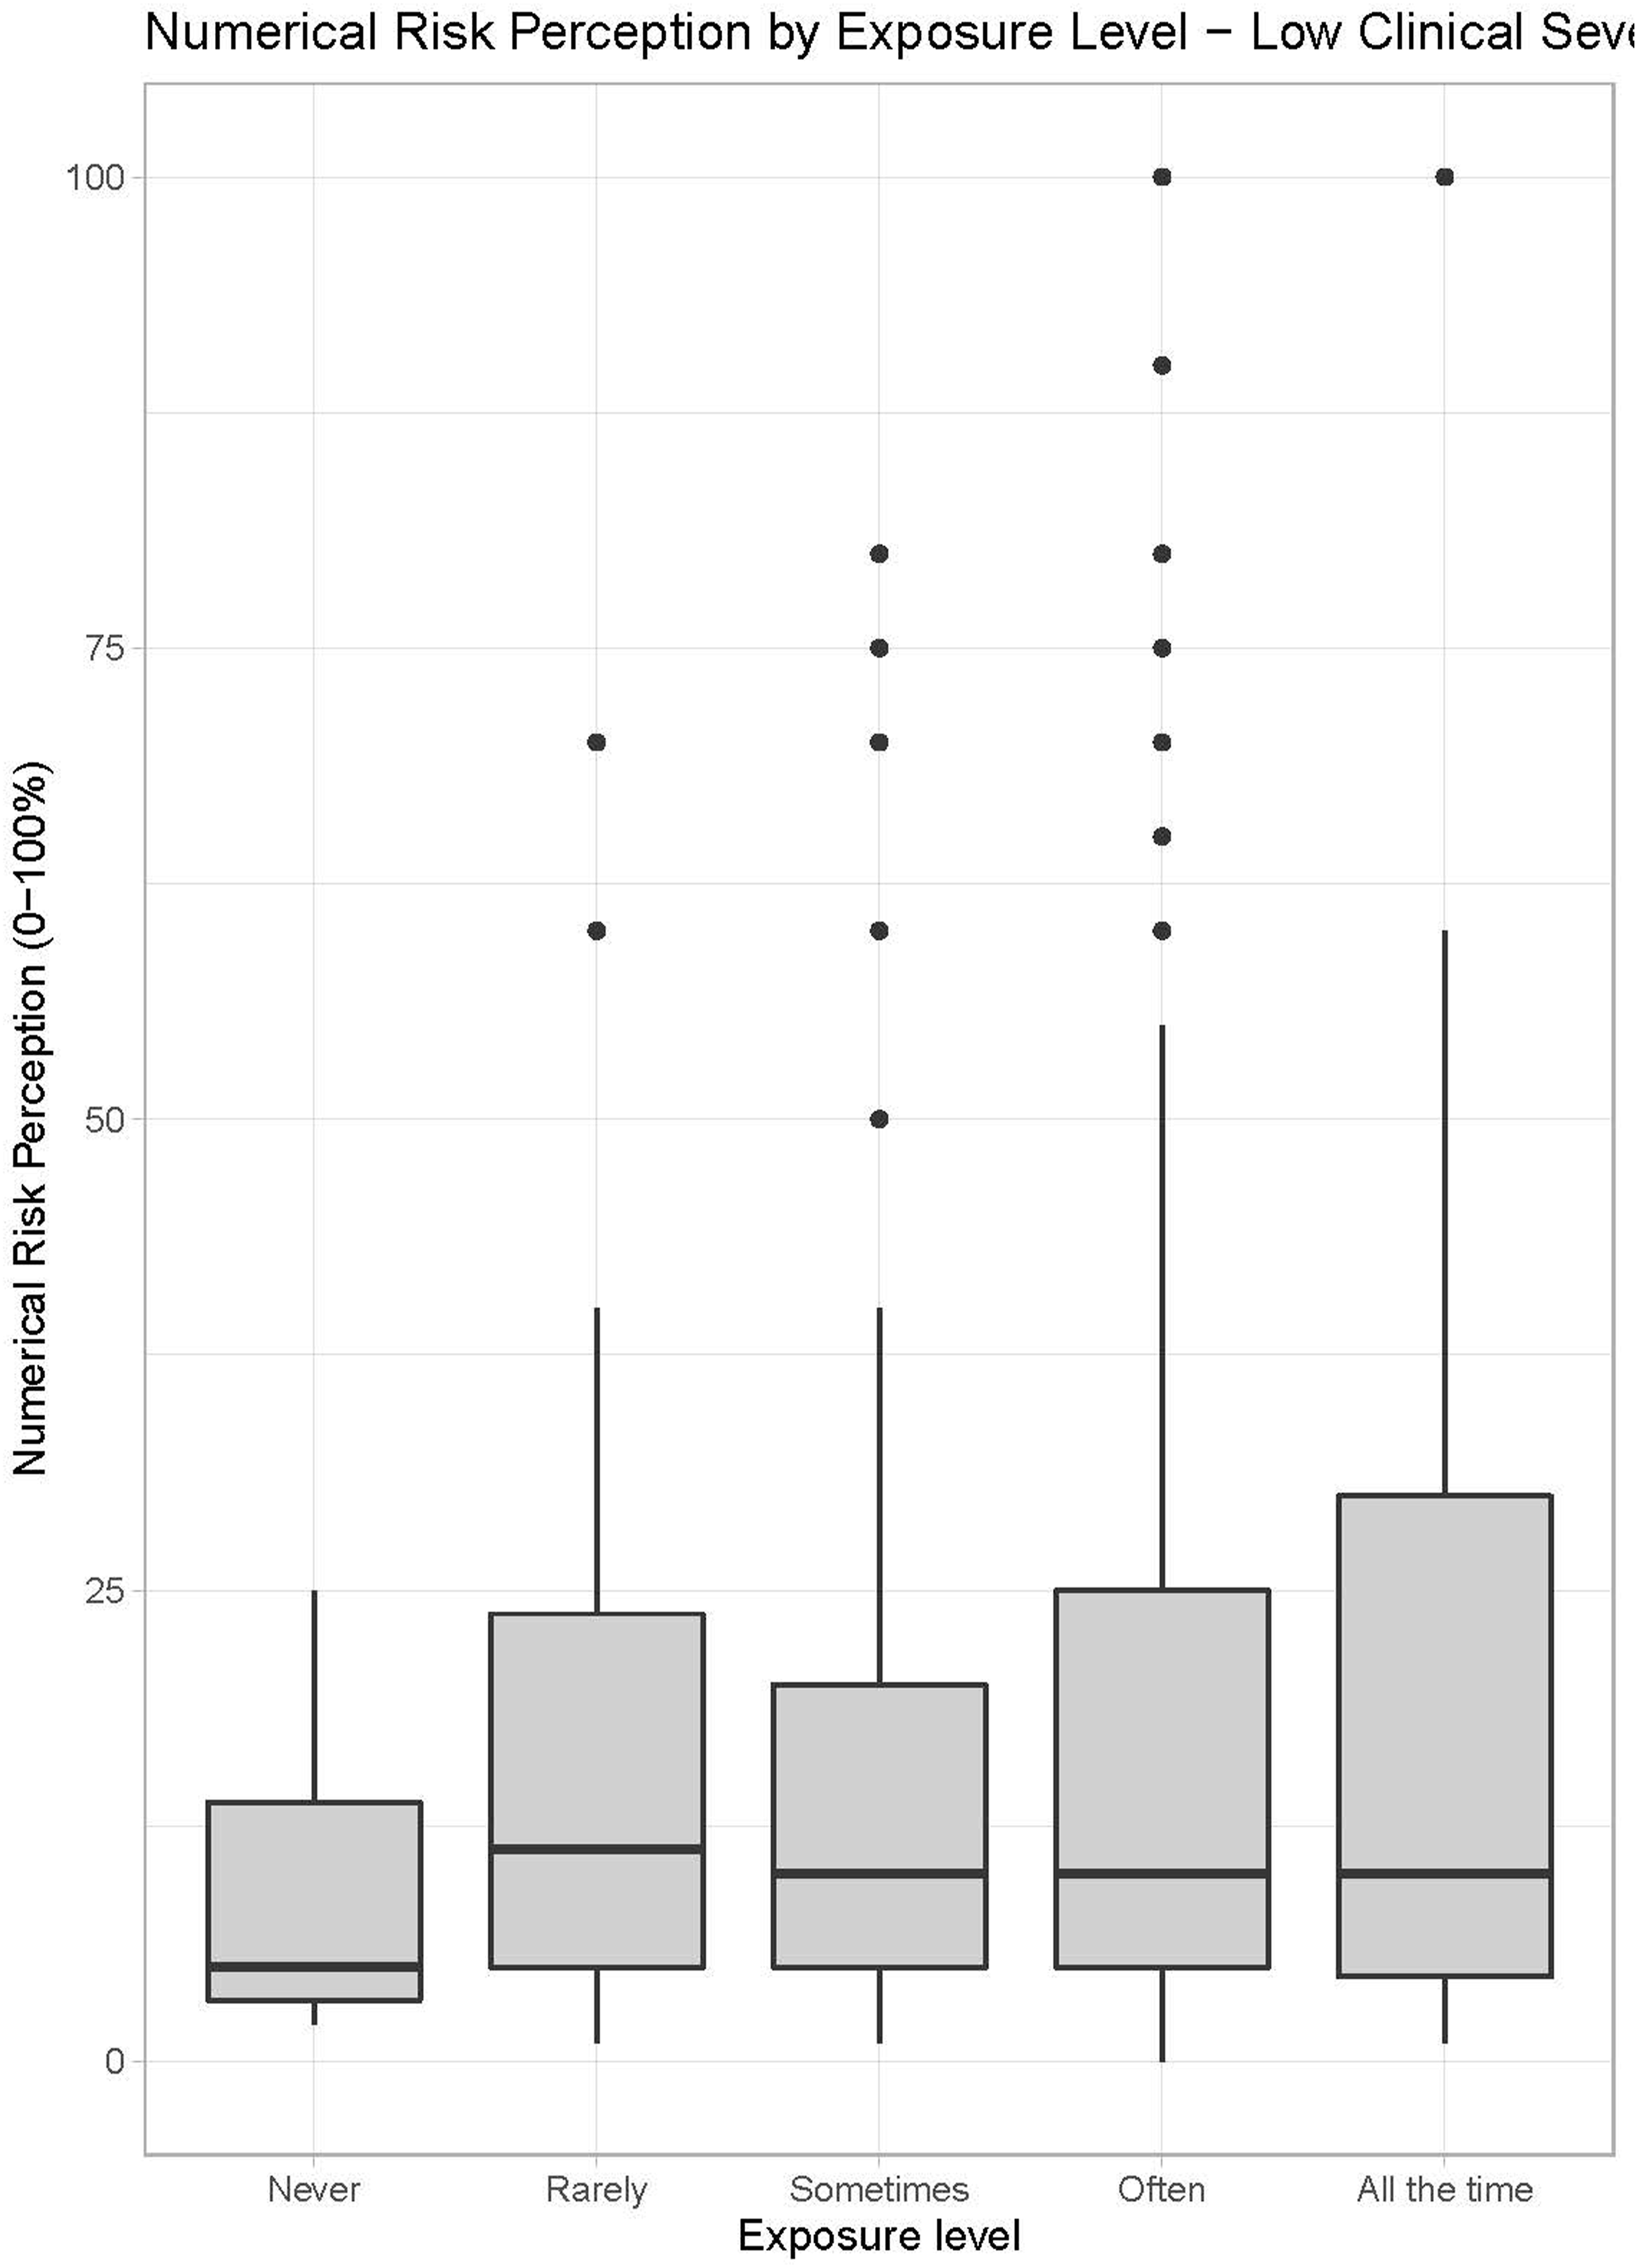
Figure 3 suggests that for high clinical severity cases, as the exposure level increases (from left to right), median perceived risk slightly increases. Median numerical risk perception is higher for exposure levels Rarely, Sometimes, and Often compared to Never, and the highest median numerical risk values are observed in the highest exposure level (All the Time). In low severity clinical cases, there is more variation and outlier values observed with regards to numerical risk perception between exposure levels (Figure 4). In this context, outlier values indicate that some participants in these expertise levels evaluated the presented low clinical severity case with high numerical in-hospital mortality risk. Figure 4 shows that all exposure levels exhibit similar median risk perception.
Kruskal–Wallis rank sum test was used to test the observed differences between exposure levels and information levels with regards to numerical risk perception. Statistical test results showed that for high clinical case severity there is not sufficient evidence to reject that the average numerical risk perception is same for all exposure levels (p = 0.0565), but results provided sufficient evidence that information level impacts the risk perception (p < 0.0001). Further, for the low clinical severity level the test failed to reject that the average numerical risk perception is same for all exposure levels (p = 0.5984) but provided sufficient evidence that information level impacts the risk perception (p < 0.0001). Thus, there is not sufficient evidence to state that exposure level impacts numerical risk perception in low and high clinical severity cases, aligned with Figures 3 and 4, but information level statistically significantly impacts the numerical risk perception of in-hospital mortality for both low and high clinical severity cases.
Discussion
Understanding and communicating the clinical risk perception associated with sepsis remains a significant challenge in-hospital–based sepsis management. The objective of this study was to analyze the relationship between the information level, design components of the display, exposure level of a physician and perceived clinical risk for in-hospital mortality of a sepsis patient, and to inform the presentation of a CDSS display for sepsis-related mortality risk.
Key findings showed the impact of display configuration on perceived risk as quantified by the response to the question: “What is your numerical estimate for this patient’s risk of in-hospital death (percent)? (Select a number between 0 and 100%).” Specifically, compared to Baseline, PIRO Figure was the only display configuration where the average numerical perceived risk was higher for high clinical severity and lower for low clinical severity (Figure 2). Compared to Baseline, all other display configurations (PIRO Text, qSOFA Text, and qSOFA Figure) were associated with a lower average numerical perceived risk for high and low case severity.
Regarding the study question “Does the exposure level impact perceived risk of in-hospital mortality?,” there was insufficient evidence that exposure level impacts perceived risk associated with in-hospital mortality, whether it is measured numerically or categorically. The results suggested that if the underlying clinical case severity represents a high risk for in-hospital mortality, most participants perceived the clinical risk as such. However, participants who self-identified as never seeing sepsis patients in a given shift were more likely to perceive the clinical risk in a high risk case as low or moderate compared to the participants with higher exposure levels. If the underlying clinical case severity was low, the participants perceive the risk for in-hospital mortality as such, and this pattern is observed in each exposure level (Figure 1). If clinical severity was low, the participants perceived the risk for in-hospital mortality as such, independent of their exposure level. Further, information level was found to statistically significantly impact the numerical risk perception of in-hospital mortality for both low and high clinical severity cases (p < 0.0001).
The findings indicated that using a high level of information (represented by PIRO) and Figure in CDSS display improves awareness to recognizing the risk of in-hospital mortality of sepsis patients, for both high and low clinical severity levels. Compared to Baseline, all other display configurations considered in this study had a lower average numerical perceived risk for both high and low clinical case severity. When display configurations other than PIRO Figure were used, the decrease in perceived numerical risk (compared to Baseline) could potentially lead to suboptimal sepsis management—especially if the risk of in-hospital mortality associated with a high risk clinical severity case is perceived lower than the risk that clinical severity level indicates.
First, these findings could be interpreted as a validation of the cutoff score value selected to define the risk for in-hospital mortality associated with a clinical case as high or low, since participants’ perception matched the underlying clinical case severity for both high and low severity levels. Second, it could also be interpreted as participating physicians’ perceived categorical risk perception with regards to in-hospital mortality of sepsis patients, independent of their exposure level, are well-aligned with the underlying clinical case severity. This alignment is important for accurate care management. Third, it could suggest that using frequency of seeing sepsis patients may not be an optimal surrogate for exposure since we could not demonstrate any statistically significant differences between the exposure levels with regards to categorical and numerical perceived risk associated with in-hospital mortality. Selecting a different participant feature to represent exposure, or a completely different physician-specific feature, could show more significant differences between its levels with regards to risk perception associated with in-hospital mortality of a patient.
The usability study was conducted in a simulated environment and under intense time pressure which in some ways may mimic the clinical environment but was not representative of typical clinical workflow (i.e., reviewing 10 patient charts back to back to determine diagnosis and clinical management for each without a physical examination). While this study includes responses of physicians from 12 different health systems to allow generalizability of finding, the sample size of 91 participants is relatively small, and the study population only focused on physicians, and other care providers that play a key role in care management of sepsis patients, such as nurse practitioners, can respond to CDSS display differently.
This study has a few limitations to note. First, as this study focused on only physicians from the medical and surgical units, these findings may not be generalizable to other specialties who encounter sepsis under different circumstances (e.g., emergency medicine). Similarly, all 12 hospitals involved in data collection were considered teaching hospitals, which may also limit study generalizability. Finally, information level was represented by severity of illness scores that summarizes clinical information using a selected set of clinical features weighted according to quantitative methods. In this context, participants’ familiarity with the severity of illness scores in their clinical practice may have had an impact on their risk perception compared to the baseline condition. In future studies, a larger sample size can be utilized and participant responses can be matched according to participants’ familiarity level with sepsis severity of illness scores.
Conclusion
A CDSS that accounts for features associated with information level and design elements used in the CDSS display, as well as user-specific features, such as clinicians’ exposure level to treating sepsis patients, has the potential to enhance the quantification and communication of clinical risk. A promising future study direction is to include different provider roles in the study population and explore differences in their clinical risk perception associated with in-hospital mortality, as well as other health outcomes of hospitalized patients beyond just exploring mortality.
Supplemental Material
sj-pdf-1-jhi-10.1177_14604582211073075 – Supplemental Material for Display and perception of risk: Analysis of decision support system display and its impact on perceived clinical risk of sepsis-induced health deterioration
Supplemental Material, sj-pdf-1-jhi-10.1177_14604582211073075 for Display and perception of risk: Analysis of decision support system display and its impact on perceived clinical risk of sepsis-induced health deterioration by Muge Capan, Laura C Schubel, Ishika Pradhan, Ken Catchpole, Nawar Shara, Ryan Arnold, J Sanford Schwartz¸Jake Seagull, Kristen Miller in Health Informatics Journal
Supplemental Material
sj-pdf-2-jhi-10.1177_14604582211073075 – Supplemental Material for Display and perception of risk: Analysis of decision support system display and its impact on perceived clinical risk of sepsis-induced health deterioration
Supplemental Material, sj-pdf-2-jhi-10.1177_14604582211073075 for Display and perception of risk: Analysis of decision support system display and its impact on perceived clinical risk of sepsis-induced health deterioration by Muge Capan, Laura C Schubel, Ishika Pradhan, Ken Catchpole, Nawar Shara, Ryan Arnold, J Sanford Schwartz¸Jake Seagull, Kristen Miller in Health Informatics Journal
Footnotes
Declaration of conflicting interests
The authors declared no potential conflicts of interest with respect to the research, authorship, and/or publication of this article.
Funding
The author(s) disclosed receipt of the following financial support for the research, authorship, and/or publication of this article: Research reported in this publication was supported by the National Institutes of Health National Library of Medicine (award number 5R01LM12300-03). The research team has no other known competing financial interests or personal relationships that could have appeared to influence the work reported in this paper.
Supplemental Material
Supplemental material for this article is available online.
References
Supplementary Material
Please find the following supplemental material available below.
For Open Access articles published under a Creative Commons License, all supplemental material carries the same license as the article it is associated with.
For non-Open Access articles published, all supplemental material carries a non-exclusive license, and permission requests for re-use of supplemental material or any part of supplemental material shall be sent directly to the copyright owner as specified in the copyright notice associated with the article.