
Abstract
Introduction
COVID-19, caused by severe acure respiratory syndrome coronavirus 2, has posed unprecedented challenges globally, with diverse clinical manifestations ranging from asymptomatic and mild symptoms to severe and fatal illness. Identifying patient subgroups with distinct clinical profiles could enhance individualized treatment strategies. Clustering mixed clinical data offers a promising avenue for uncovering meaningful patterns; however, few algorithms effectively manage heterogeneous datasets. This study applied evidence-based clustering algorithms, that is, KAMILA and K-prototypes, to categorize COVID-19 patients on the basis of medical history and biochemical and radiological data.
Methods
A retrospective cohort study was conducted on 556 COVID-19 patients admitted to Hôtel Dieu de France Hospital in Beirut between March 2020 and October 2021. Only data collected within the first 24 hours of admission were used for clustering to ensure early prognostic relevance. After data cleaning, the missing values were imputed into 30 datasets. KAMILA and K-prototype algorithms were applied to these datasets, generating clusters ranging from two to six groups. The optimal clustering solution was determined via the silhouette, Calinski–Harabasz, and Dunn indices, followed by statistical analyses to characterize cluster-specific patient profiles and outcomes.
Results
Clustering identified three distinct patient groups, with the KAMILA algorithm providing the best fit. Cluster 1 primarily included middle-aged male patients exhibiting elevated inflammatory markers, consistent oxygen requirements, and extended hospital stays. Cluster 2 included elderly patients with multiple comorbidities and high intensive care unit (ICU) admission rates, requiring cautious anticoagulation and early antibiotic intervention. Cluster 3 included younger, generally healthier individuals who required minimal interventions and experienced low mortality.
Conclusions
Mixed-data clustering revealed three COVID-19 patient clusters indicating the clinical meaningfulness and global reproducibility with prognostic and therapeutic implications. This unsupervised approach may inform early triage and resource allocation. Further prospective validation in diverse, vaccinated populations is warranted.
Introduction
Even after the World Health Organization (WHO) ended the PHEIC (Public Health Emergency of International Concern) on 5 May 2023, COVID-19 remains an ongoing health issue, with millions of reported deaths worldwide and far higher excess-mortality estimates for 2020–2021. 1 Lebanon's multiple crises have kept the health system under acute strain inaugurated by the Gross Domestic Product collapse since 2018 and aggravated by ongoing hostilities since late 2023, attacks on health care, plummeting routine immunization coverage, and a sustained exodus of staff.2–7 Clinically, COVID-19 still spans mild to critical disease; risk is concentrated in older adults, those with comorbidities, and immunocompromised individuals.8,9 Protection from the updated 2024–2025 vaccines persists against severe outcomes, and the novel descendant's circulation has not shown increased intrinsic severity.8–11 Against this backdrop, predicting individual patient responses and optimizing treatment to mitigate severe outcomes are no longer considered novel approaches, with machine learning and clustering algorithms offering promising solutions.
Clustering is a unique method in data analysis, particularly for complex diseases with evolving knowledge, such as COVID-19. By grouping data into clusters on the basis of intrinsic similarity, cluster analysis uncovers patterns that are often concealed by high data complexity. 12 This approach aligns with the evolution of precision medicine, enabling personalized care strategies, a trend increasingly observed in fields such as oncology and metabolic disorders. 13 For COVID-19, identifying patient subgroups based on the basis of unique clinical profiles can enhance individualized care and targeted interventions.
Clinical datasets often contain mixed data, encompassing both continuous and categorical variables, which poses a yet debatable problem of the feasibility of clustering such data. There is limited guidance on optimal clustering methods for such data, with a notable exception being Preud’homme et al., 14 who provided proof using real and generated data on the suitable and recommended clustering algorithms for mixed data. Among their recommended methods, the KAMILA and K-prototype stand out for their unique features. K-prototype extends the k-means algorithm, which uses Euclidean and Hamming distances to handle mixed data efficiently. It usually accepts scaled continuous variables and balanced categorical data. KAMILA, in contr, adapts k-means for heterogeneous datasets by modeling continuous data with mixture distributions and categorical data with multinomial distributions and is robust against data imbalance.
In this study, we applied the KAMILA and K-prototype methods to cluster COVID-19 patients treated at Hôtel Dieu de France Hospital in Beirut on the basis of medical histories and initial biochemical and radiological data. Our goal was to delineate patient categories, enabling tailored care strategies for newly admitted patients by matching them to predefined clusters and offering evidence-based treatment recommendations rooted in their unique clinical profiles.
Material and methods
We conducted a single-center, retrospective cohort study at Hôtel Dieu de France Hospital, including 556 hospitalized patients with confirmed COVID-19 from 3 March 2020 to 12 October 2021 (pre-Omicron variant phase 15 ). Our goal was to assess early prognostic indicators and treatment effects on clinical outcomes. All statistical analyses were performed via R 4.3.1 (The R Foundation for Statistical Computing, Vienna, Austria).
Data collection
Study data were extracted from the hospital's electronic medical records (EMR) system. Patients eligible for inclusion had a confirmed COVID-19 diagnosis and were admitted during the study period. Only the data points collected within 24 hours of admission were used for clustering (Table 1), comprising variables commonly accessible upon admission for standard COVID-19 patients. The early data points chosen will assist clinicians in promptly classifying new admissions, guiding initial treatment decisions. Data extracted from the EMR were cross-checked for consistency and quality. All data entries were n-tuple-checked by a workforce of residents to confirm accuracy, with discrepancies resolved through consensus and review of the source documents. The prognostic value of the different treatments administered during the stay was assessed by studying their effects on severity variables such as contraction of nosocomial infections, development of pneumo-mediinum, intubation, occurrence of thromboembolic or hemorrhagic events, duration of hospitalization and death.
Variables used for patient clustering analysis.

This table lists the clinical and demographic variables collected within the first 24 hours of admission and used to group patients. The variables are divided into two types: continuous and categorical. For each categorical variable, a definition is provided along with the numerical codes, and their meaning, which are used in the clustering algorithm. CRP: C-reactive protein; CT: computed tomography; LDH: Lactate dehydrogenase; COPD: chronic obstructive pulmonary disease.
Inclusion and exclusion criteria
Patients who received experimental or compassionate-use treatments prior to admission were included, to ensure that the treatment effects studied were from the standard protocols in use in Lebanon at the time as well as those with pre-existing terminal illnesses (e.g. advanced malignancy with end-of-life care) that could support severity assessment of COVID-19. The exclusion criteria which were applied at the time of admission or during the statistical analysis, included patients with insufficient baseline data or those with incomplete hospital records during the 24-hour window. We also excluded patients admitted for conditions unrelated to COVID-19.
Statistical analysis
We prepared the data via systematic cleaning, imputation, and mixed-type clustering. Variables with more than 20% missing data were excluded from the analysis. The remaining data were multiply imputed into 30 completed datasets (MICE). Redundant variables were identified via appropriate correlation metrics: Spearman correlation for continuous pairs, the φ coefficient for binary pairs, and point–biserial correlation for mixed pairs (thresholds |r|, φ ≥0.60; point-biserial ≥0.50), removing one variable from any flagged pair on the basis of clinical relevance and data quality. We then removed near-zero-variance predictors using caret defaults (frequency ratios ≥95:5 and ≤10% unique values). Continuous features were z scored. Clustering was performed separately in each imputed set using two nonlikelihood algorithms suited to mixed data, KAMILA and K-prototypes, for k=2…6. For each k, we formed a consensus partition across the 30 imputations via clue::cl_consensus (squared-Euclidean partition distance). To quantify internal validity while respecting mixed data, we computed Gower distances on the most representative imputed set (the one with the highest adjusted Rand index to the consensus) and evaluated silhouette, Calinski–Harabasz, and Dunn indices; a composite score (product of the three) guided selection of the final k. Because KAMILA and K-prototypes do not maximize a parametric likelihood, likelihood-ratio statistics are not applicable to the clustering step; instead, we report consensus stability and the above distance-based validity metrics. Cluster differences in baseline characteristics were assessed with the Kruskal–Wallis test (continuous; with Dunn's post hoc test) and the χ2 test (categorical; with pairwise comparisons when relevant).
For association analyses within clusters (intensive care unit (ICU) and non-ICU strata), we fit univariable models per predictor–outcome pair. For the continuous outcome (length of stay), we used Huber M-estimation (MASS::rlm) to mitigate outlier and nonnormality influence; nonlinearity was screened via component-plus-residual plots, adding a quadratic term when indicated. We examined heteroscedicity (Breusch–Pagan) and used HC1 sandwich variances when needed; influence was screened with Cook's distance (Di >4/n triggers refit). For binary outcomes (e.g. mortality and hemorrhage) we used binomial logistic regression (logit link), again cluster-specific and univariable, adding a quadratic term for evident nonlinearity and using HC1 robust standard errors. As rlm is an M-estimator without a true likelihood, likelihood-ratio tests are not defined for the length of stay (LOS) models; for logistic generalized linear models, effect sizes with confidence intervals were prioritized for interpretability.
Results
Thirty imputed datasets were generated. Each was clustered via KAMILA and K-prototypes into k = 2, 3, 4, 5, and 6 clusters each. For each k, the consensus cluster was extracted. The number k of clusters with the highest silhouette, Calinski–Harabasz, and Dunn indices was chosen to be the best clustering solution; namely, the KAMILA algorithm with k = 3 clusters was the best overall (silhouette = 0.11, Calinski–Harabasz = 0.04, Dunn = 85.01). Each cluster was then divided into two subgroups on the basis of whether they were admitted to the ICU. Table 2 summarizes the frequency per cluster and group.
Distribution of patients across clusters and hospital units.

This table shows how the 556 patients in the study were allocated into the 3 distinct clusters identified by the KAMILA algorithm. It provides the total number and percentage of patients (of the total) in each cluster. Furthermore, it breaks down each cluster's population by their location of care: the ICU or the general hospital floors.
Patient characteristics
All the imaging findings and quantitative measurements differed significantly across the clusters (p < 0.001). Immunocompromised status did not predict patient prognosis or treatment response (p = 0.48). Cluster 1 comprised predominantly males (≈5:1), typically >50 years, with the greatest weight and a comorbidity burden comparable to that of age-matched peers (>10% but <30% per condition). Patients presented later to the ED and showed higher inflammatory/cytotoxic markers (elevated ferritin and lactate dehydrogenase (LDH) and lymphopenia) with a high percentage of lobar consolidation and ground-glass opacities on the index computed tomography (CT); nearly half were transferred to the ICU (Table 2), and hospital stays were the longest. Cluster 2 had a male to female ratio ≈2:1 and was the oldest group; it harbored the highest comorbidity prevalence (>30% for each disease), laboratory signs of infection and thrombosis, and the greatest baseline CT consolidation burden. Cluster 3 was the youngest, had an approximately 1:1 sex distribution, and carried very few comorbidities (<10% for each, hypertension most common); it had the highest lymphocyte counts in comparison to clusters 1 and 2, nevertheless staying within the norm; the fewest complications; and the shortest stays. Summary contrs appear in Figure 1 and Tables 3 and 4.
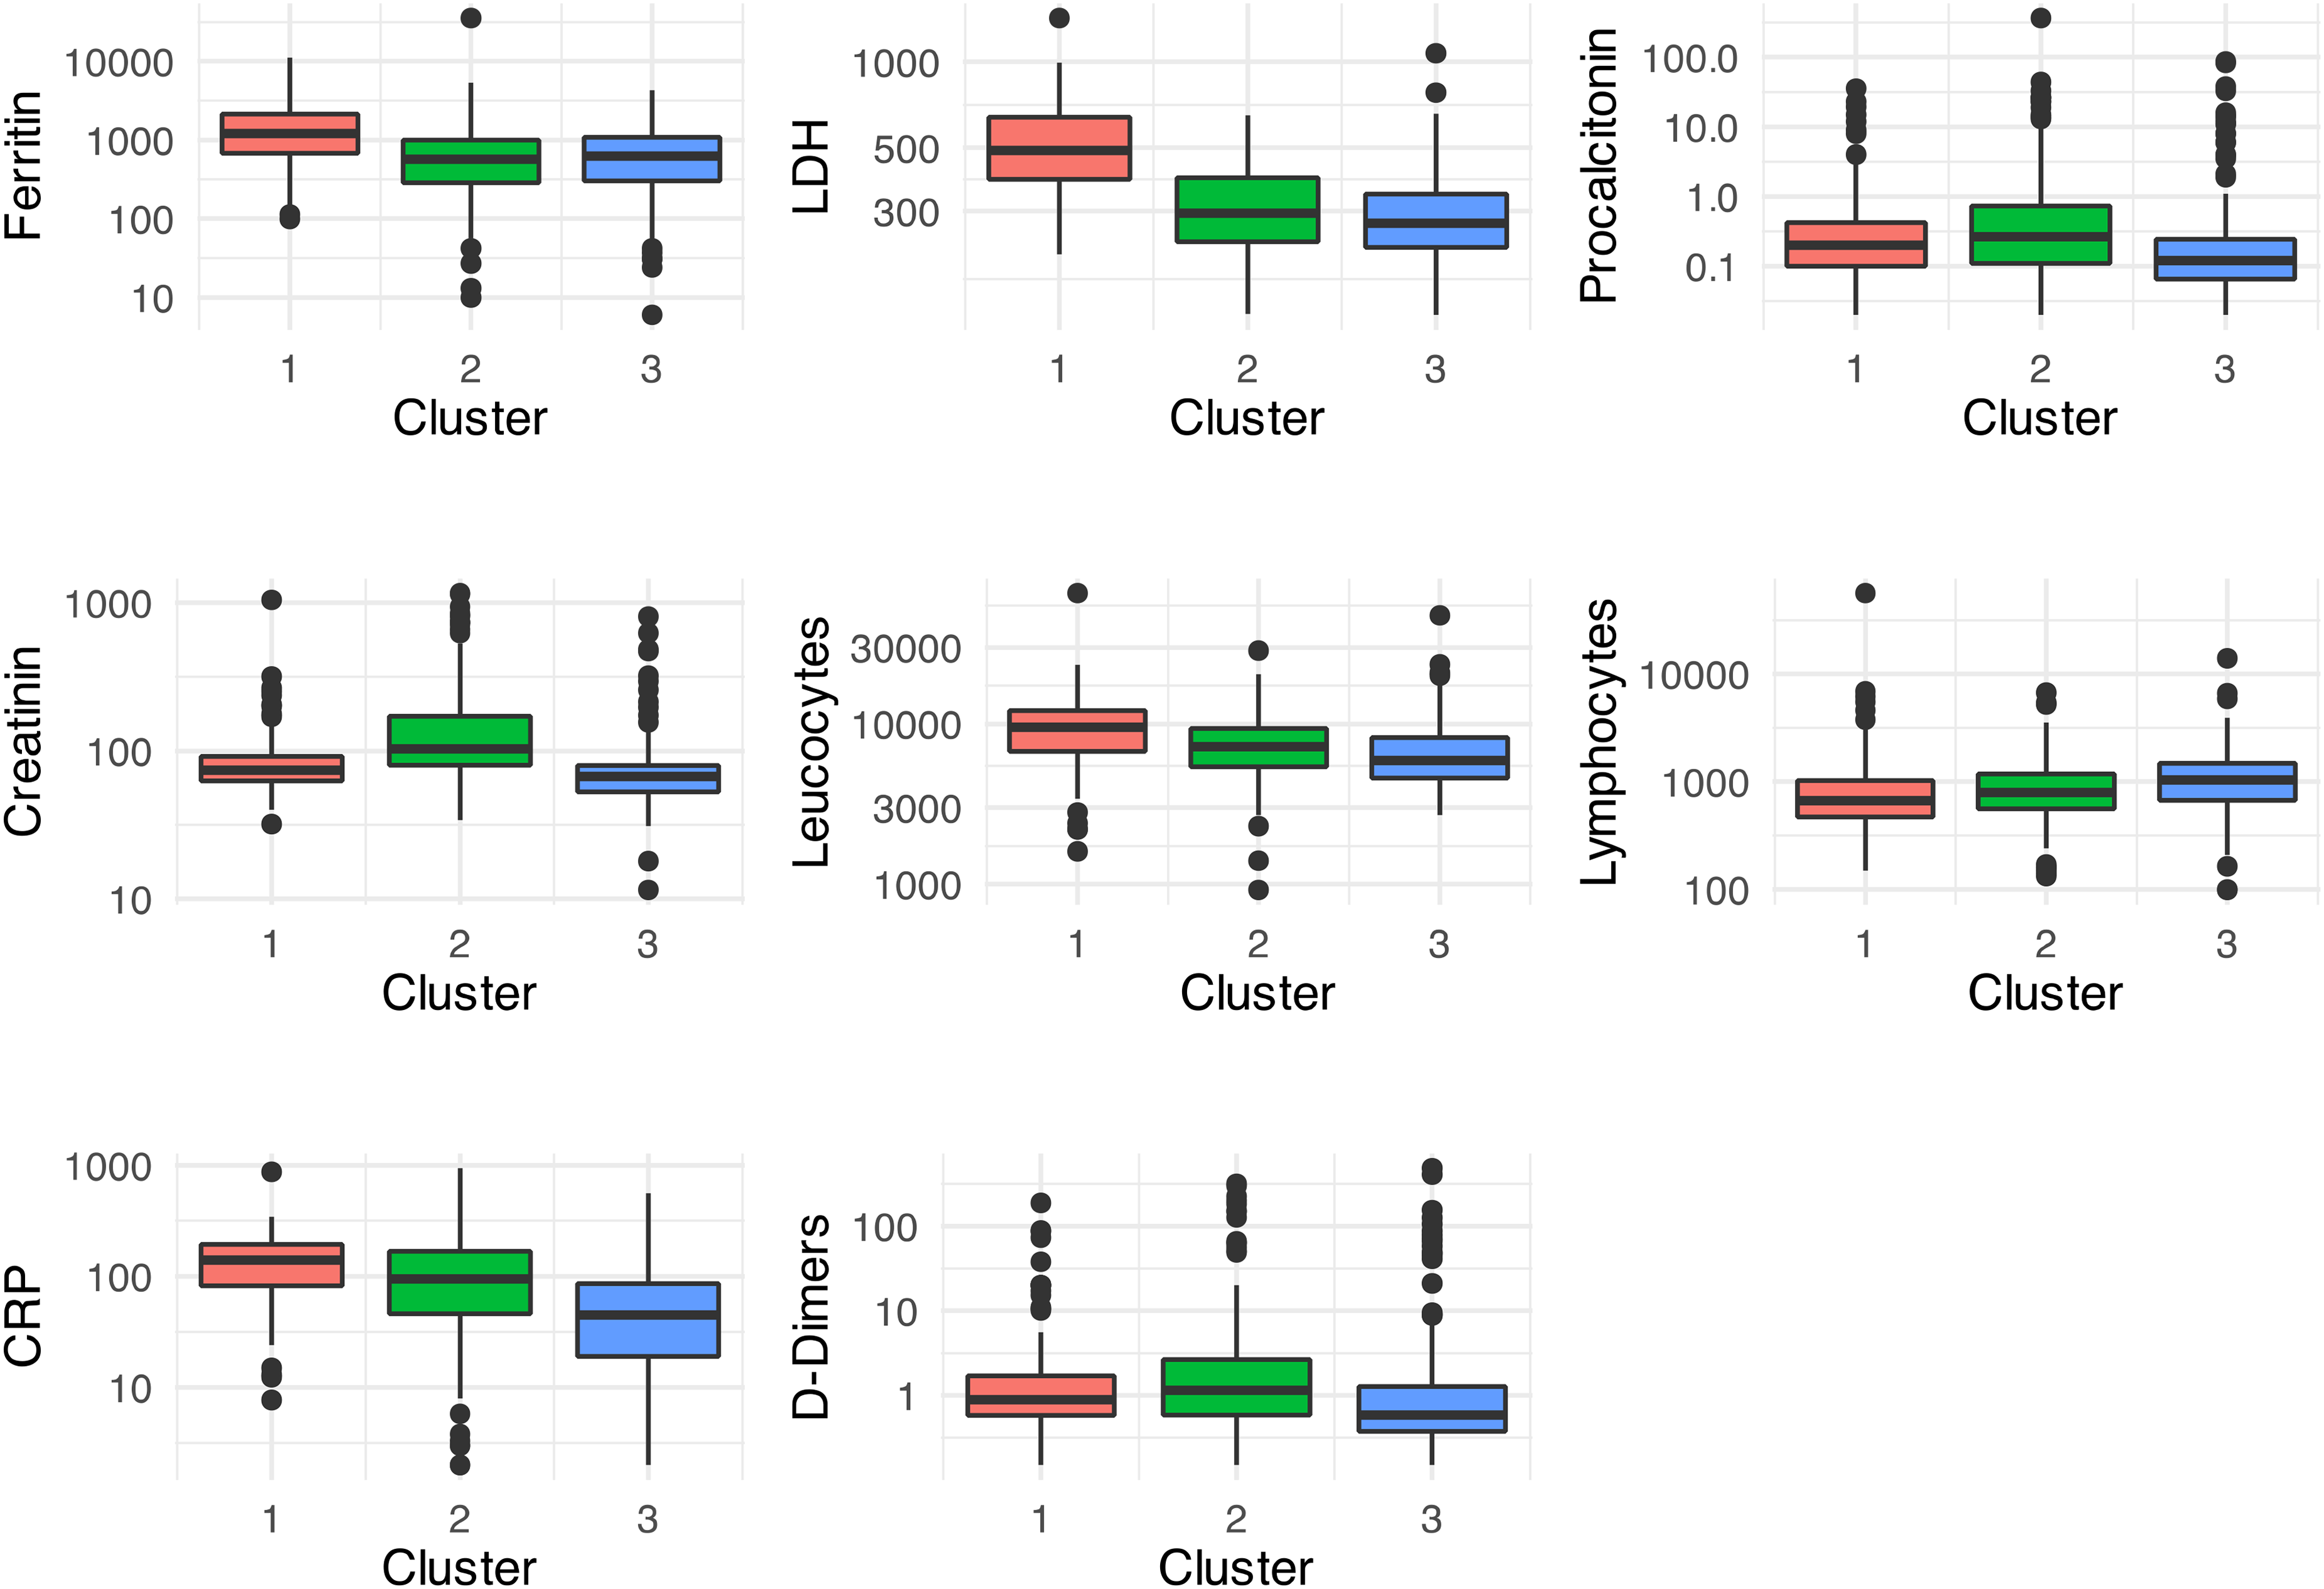
The three clusters exhibited varying levels of routine blood tests. All tests are significant at p < 0.001 according to the Kruskal–Wallis test.
Comparison of categorical patient characteristics across clusters.

This table displays the breakdown of patients’ baseline characteristics for each of the three clusters. The data, organized by personal medical history and initial CT scan findings are presented as the total number of patients followed by the percentage within their cluster show in (%). This allows for a direct comparison of the prevalence of these conditions among the groups.
Comparison of continuous patient characteristics across clusters.

This table compares the distributions of continuous variables across the three patient clusters. The data are presented as the median value, with the first and third quartiles shown in [ ]. GGOs: ground glass opacities; PAs: pulmonary arteries.
Adverse outcomes and treatment effects
Chronic comorbidities and adverse outcomes differed significantly across the clusters (p < 0.001). Cluster 1 patients almost uniformly required oxygen, with most having a rate >4 L/min, and had prolonged stays. Cluster 2 patients required oxygen in roughly three quarters of the patients (most <10 L/min), had a greater bleeding risk, and also had long stays. Cluster 3 patients had the shortest stays, and approximately half did not require supplemental oxygen (Table 5).
Comparison of clinical outcomes and complications by cluster.

This table outlines the frequency of key clinical outcomes and adverse events experienced by patients in each of the three clusters. All p-values are <0.001, but † <0.01. HFNC: high flow nasal canula.
In the ICU subgroup, there was no difference in ICU length of stay or intubation risk between clusters. Antibiotic therapy was associated with longer stays; patients without infection more often had pneumothoraces. Cluster 2 had 2.36-fold greater odds of death than cluster 1 did (95% confidence interval (CI) 1.07–5.32, p = 0.035), whereas clusters 1 and 3 did not differ in mortality (p = 0.99). Among cluster 2 patients who received on glucocorticoid therapy upon ICU admission, the odds of mortality differed significantly from those of patients who did not (odds ratio (OR) 1.32; 95% CI 1.05–1.77; p = 0.035).
In the ward (non-ICU), cluster 3 had a 2.4-day shorter length of stay than clusters 1 to 2 did (95% CI 1.24–3.58). Across clusters 1 to 3, none of the other tested interventions (hydroxychloroquine ± azithromycin, ivermectin, lopinavir/ritonavir, remdesivir, shifts from prophylactic to curative anticoagulation or antiplatelets, broad-spectrum antibiotics, or advanced ventilatory adjuncts) yielded statistically significant benefits in mortality, ICU transfer, intubation, or length of stay.
Discussion
Our principal finding is that hospitalized COVID-19 patients in our center reproducibly separate into three clinically coherent phenotypes that map onto a familiar severity gradient and carry distinct prognoses: a group with elevated serology markers of severe inflammation, the highest ICU demand and substantial mortality (critical illness, Infectious Disease Society of America classification 16 ), an older multimorbid group with high risk of thrombosis and superinfections (severe illness), and a young-low-risk group with the shortest stays and lowest adverse events (mild to moderate illness). In our data this translated into, respectively, longer admissions and high escalation needs (cluster 1: LOS 12 d, 45% ICU, 17% mortality), an intermediate but still fragile profile being older in age and having multiple comorbidities (cluster 2: LOS 11 d, 38% ICU, 33% mortality), and a comparatively favorable course (cluster 3: LOS 6 d, 17% ICU, 7.5% mortality). Clinically, assigning phenotypes at admission offers a rapid and interpretable summary of the patient's host response that can steer triage, monitoring intensity, and early therapy. Although some patients with mild illness develop Long COVID-19 including rare delayed deaths, a mild initial presentation does not necessarily predict favorable long-term outcomes.17–19 Even in patients with a less severe disease course, careful acute evaluation, structured follow up, and treatment are still necessary.
Several classifications from 2020–2025 resulted in similar patterns. Unsupervised analyses usually divide hospitalized COVID-19 patients into three common types: mild to moderate, severe, or critical illness. Sometimes, an additional type is added to the four groups.20–29 Their reproducibility confers clear clinical utility, although a minority of series report two clusters 23 or, in long-COVID-19 or highly granular datasets, four. 24 The severe to critical/hyperinflammatory phenotype comprises predominantly male older adults,30–32 with higher body mass index (BMI) 15 and the heaviest burden of chronic cardiac, renal, hepatic, pulmonary, and oncological disease. 31 Biochemically, it is associated with a C-reactive protein–LDH–D-dimer surge, neutrophilia, lymphopenia, a high neutrophil-to-lymphocyte ratio (NLR)33,34 and multiple organ markers (aspartate aminotransferase, alanine aminotransferase, bilirubin, creatinine, urea, N-terminal pro-B-type natriuretic protein [NT-proBNP], and troponin). 33 Radiologically, there is dominance of extensive ground–glass opacities or lobar consolidation associated with hypoxemia.25,30 Intermediate clusters with older, multimorbid patients but with less extreme inflammation/organ injury lie between extremes25,31, whereas less severe clusters center on younger adults, often female-skewed, 35 with preserved lymphocyte/monocyte counts, the lowest inflammatory indices 31 and the sparsest CT changes. 25 Thus, irrespective of geography, data granularity, or algorithms, COVID-19 admissions reliably resolve into a hyperinflammatory severe to critical phenotype, a multimorbid phenotype and a low-risk phenotype composed of younger patients, underscoring a biologically coherent continuum of host responses.
Contemporary COVID-19 stratification studies use various unsupervised learning techniques, 31 including K-means, x-means, Partitioning Around Medoids,25,32 hierarchical methods (Ward's criterion),25,36 model-based approaches (Latent Class Analysis (LCA), 37 Gaussian-mixture models, 38 Mixture of Autoregressions (MoAR), Multiple Factor Analysis (MFA) 39 ), dimensionality-reduction tools (Factor Analysis of Mixed Data, 25 Principal Component Analysis 40 ), self-organizing maps, 41 rigorous preprocessing (log-transforming, 25 z-scaling, categorical encoding 32 ), chained-equation imputation, 35 and algorithms tailored to mixed or longitudinal data (Kml3d, 31 distribution-specific LCA 37 ). Internal validity indices (Bayesian Information Criterion, Akaike Information Criterion, silhouette, Dunn, and Davies–Bouldin)25,31 and stability checks (ensemble consensus, 35 imaging-exclusion sensitivity, 25 train-test splits, 42 and Adjusted Rand Index concordance 25 ) ensure robustness. Methodologically, the literature encompasses K-means, 27 agglomerative clustering, 25 K-prototypes for mixed data, 24 KAMILA for kernel-enhanced mixed clustering,14,23 probabilistic LCA,21,29 hybrid unsupervised–supervised pipelines,21,22 expectation–maximization mixtures, 43 and self-organizing maps. 44 Robustness is achieved through algorithm ensembles or external validation,25,28 whereas fragility arises from small samples, missing data, and time-variant therapies, which are partially mitigated by imputation and temporal sensitivity checks. The convergence of three analogous clusters across diverse tools might suggest methodological reliability when best practices are followed, but it is worth questioning the robustness of these findings. Heterogeneous studies seem to yield a similar schema: a hyperinflammatory critical cluster, a multimorbid elderly cluster, and a mild low-risk cluster. However, some datasets merge extreme age and inflammation, whereas others separate a younger hyperinflammatory group from an older multimorbid group, raising questions about the consistency of these categorizations. Sex-based nuances, such as female-skewed low-risk clusters or a sensory-symptom female cluster with altered long-COVID-19 risk, are noted. The one-to-one mapping between this consensus and our three clusters might validate our mixed-data KAMILA/K-prototype approach, which suggests segregation of adult COVID-19 patients into inflammatory-critical, older-comorbid prone to thrombi and superinfections, and young mild-to-moderate phenotypes, each of which presumably require requiring tailored management (aggressive immunomodulation, enhanced anticoagulation, or standard care respectively).
This study has important limitations. The cohort comes from a single institution and is modest in size, and stratification and subgroup analyses further reduce precision. Recruitment occurred before widespread vaccination and under two dominant variants (alpha 45 and delta 46 ), so generalizability to vaccinated populations and to newer variants (omicron and forward) is uncertain. Imaging relies on chest CT only, and we do not include other modalities such as SPECT or VQ SPECT CT, which could reveal thrombotic and other vascular changes in small subsegmental vessels, including in younger patients 47 ; thus, clustering may have been influenced by imaging modality and timing and may have led to missed relevant disease. Treatments were not randomized, and symptoms were not captured in a fully standardized manner, limiting causal inference, and clinical detail. Clusters represent clinical tendencies rather than deterministic outcomes, and outliers exist, so any triage or access to care guidance derived from our phenotypes should support rather than replace personalized clinical judgment. The literature synthesis we provide is illustrative given the very large amount of COVID-19 literature and should not be read as exhaustively. We therefore present our work as exploratory and hypothesis-generating, and we encourage validation in larger multicenter cohorts with contemporary case mixes, standardized data capture, comprehensive imaging that includes perfusion and ventilation modalities, and longitudinal follow up to assess long-term outcomes such as long COVID-19.
Conclusion
This single-center, mixed-data unsupervised analysis shows how routinely collected variables can reveal three clinically interpretable phenotypes in hospitalized COVID-19 patients. The observed patterns resemble those reported elsewhere but may reflect the case mix and tests performed. Phenotypes reflect clinical tendencies rather than deterministic outcomes. Outliers exist, and patients with initially mild presentations may still develop long COVID-19. These groups should support, not replace, personalized clinical judgment, acute evaluation, and structured follow up.
This study presents a practical workflow for clustering mixed-type data, incorporating multiple imputation and robust internal validation and shows how phenotype assignment can be used to organize care pathways. We do not assert universal applicability across countries, populations, or viral variants. Future work should test these findings in larger, contemporary, multicenter cohorts, incorporate multimodal imaging, and follow patients longitudinally to quantify long-term outcomes. With external validation, phenotype-aware approaches may complement established triage and treatment decisions.
Footnotes
Acknowledgments
The author thank Dr Georges Maalouly's for helping me throughout the journey of conceptualizing, writing and publishing this study. The author also appreciate Dr Mouin Jamal's help in study conceptualization, Dr Rindala Saliba for supervision, Dr Moussa Riachy and Dr Ghassan Sleilaty for granting me access to the Hospital's COVID-19 dataset.
Ethical approval
Our study was approved by the ethical board at Hotel-Dieu de France Hospital. The ethics committee approval code is Tfem-2022’-30.
Informed consent
This retrospective study did not require patient consent for data interrogation because no intervention was introduced and all patients were anonymised.
Contributorship
CEH conceived the study. analysed the data, and wrote the manuscript. GM supervised the project, and all authors reviewed the final manuscript.
Funding
The authors received no financial support for the research, authorship, and/or publication of this article.
Declaration of Conflicting Interests
The authors declared no potential conflicts of interest with respect to the research, authorship, and/or publication of this article.
Guarantor
GM is the guarantor of this work and, as such, had full access to all the data in the study and takes responsibility for the integrity of the data and the accuracy of the data analysis.
Peer review
All reviewer and editorial comments have been addressed in a satisfactory manner.
Data availability
The datasets analyzed during the current study are not publicly available due to strict regulations imposed by the Hotel Dieu de France Hospital; however, they are available from the corresponding author upon reasonable request.