
Abstract
Dengue fever remains a persistent global health threat, particularly in Southeast Asia, the Pacific, and the Americas. This study aims to improve early detection and prediction of dengue outbreaks by addressing the challenges of data scarcity and complex transmission factors through a hybrid machine learning approach. We developed a methodology that integrates clustering and classification techniques to identify and predict seasonal patterns of dengue risk. Using regional data from Bangladesh, clustering was performed to uncover latent patterns, with optimal clusters selected based on low inertia and high silhouette scores. The supervised machine learning models were then trained on labeled data to classify dengue risk levels using key meteorological and demographic characteristics. Clustering analysis revealed well-defined structures within the data, with a silhouette score of 0.774, indicating robust clustering quality. The classification models demonstrated exceptional performance, achieving more than 99% in accuracy, precision, recall, and F1 score metrics. These models effectively identified high-risk periods and regions with strong seasonal trends in dengue incidence. Overall, this study presents a data-driven framework for the early detection of dengue outbreaks, supporting proactive public health strategies, while also contributing to the identification of dengue patterns and serving as a tool for controlling infectious diseases.
Introduction
Dengue fever is a significant global health concern, with estimates of the annual incidence of infections ranging from 50 million to almost 400 million. 1 The disease poses a continuing threat, with approximately 50 million dengue infections and around 500,000 individuals hospitalized with dengue hemorrhagic fever each year, particularly in Southeast Asia, the Pacific, and the Americas. 2 Urbanization has been found to accelerate the growth and survival of Aedes albopictus, a mosquito that spreads dengue fever. This could cause more outbreaks of dengue fever. 3 Furthermore, the incidence of dengue fever has been observed to fluctuate over the years, with reported cases and deaths varying annually. 4
The spread of dengue fever is influenced by various factors, including human travel patterns, international traffic between dengue-endemic and dengue-free countries, and the presence of suitable vectors for the virus. 5 Furthermore, dengue outbreaks are significantly influenced by climate and socio-ecological settings; therefore, prevention strategies should focus on reducing the urban heat island effect, modifying vector control measures, and providing targeted health education to travelers at border points. 6 Monsoonal precipitation has a significant impact on the dynamics of dengue epidemics because it increases mosquito populations, which in turn causes dengue outbreaks. 7 Furthermore, dengue fever is becoming more commonplace worldwide, affecting public health. 8 Climate-related risk factors also impact the spread of dengue fever. 9 Aedes aegypti mosquitoes are the primary vectors of this fever, posing a serious health risk in many tropical nations. 10
Dengue, a crucial arthropod-borne viral infection, causes millions of annual infections worldwide.11–13 The importance of including socioeconomic covariates in assessing dengue risk is underscored by its global scale. 14 Early and accurate diagnosis is imperative for disease surveillance and control, requiring practical analysis and detection methods. 15 Distinguishing dengue from other dengue-like diseases is crucial, emphasizing the need for precise analytical approaches. 16 Furthermore, the links between imported and indigenous cases of dengue highlight the importance of preventing disease spread and promptly identifying high-risk individuals in high-risk areas. This shows the need for thorough research and effective prevention methods. The potential development of antiviral drugs and vaccines underscores the importance of ongoing analysis and research for effective disease management. 11 The life-threatening nature of dengue also emphasizes the need to increase awareness among physicians in temperate areas, requiring continuous education and analysis of the disease.
Accurate analysis and prediction are crucial for effective disease management. Machine learning models have played an important role in understanding dengue population dynamics and virus evolution and inform intervention strategies. 17 However, challenges persist due to a limited understanding of transmission factors and concerns about data availability. 18 Spatial analysis, age-related epidemiology, and the influence of immunological interactions further complicate the analysis.19,20 Machine learning works better when it uses a variety of data sets from genetics and epidemiology 21 and advanced statistical methods, such as principal component analysis. 22
In response to the growing threat of dengue, particularly in regions like Bangladesh, this study addresses key knowledge gaps through a hybrid machine learning methodology. The proposed approach integrates clustering and classification techniques supported by systematic data retrieval, cleaning, feature engineering, and multivariate trend analysis. The elbow method and the silhouette score guide the clustering to identify optimal groupings characterized by strong internal consistency, as indicated by low inertia and high silhouette values. Supervised learning models, including Decision Tree (DT), Random Forest (RF), K-Nearest Neighbor (KNN), and Logistic Regression (LR), achieved outstanding performance, with precision, precision, recall, and F1 scores that all exceeded 0.99. Experimental results show a seasonal trend in dengue incidence, particularly from August to October. The adaptability of this hybrid framework, along with informative visualizations of clusters, decision boundaries, and temporal trends, underscores its potential as a reliable tool for disease surveillance and early warning.
This study makes a significant contribution by introducing an innovative hybrid methodology that integrates clustering and classification techniques. The key contributions can be summarized as follows: • Hybrid Methodology: The study employs a novel hybrid method that integrates data collection, cleaning, feature engineering, multivariate trend analysis, and the fusion of clustering and classification techniques to enhance the accuracy of dengue analysis. • Structured Dengue Dataset: This article focuses on the preparation of a structured dengue dataset derived from the medical histories of Bangladeshi patients over 5 years. • Clustering Analysis: The elbow method and silhouette score serve as guides for the clustering analysis, which finds ideal clusters with low inertia and high silhouette scores. • Supervised Learning Models: It aims to validate the quality of the cluster separation and build predictive models capable of identifying the dengue risk level for new or future observations, thereby converting unlabeled historical data into a usable training set for future risk prediction. • Versatile Tool for Surveillance: Positioned as a versatile and accurate tool for infectious disease surveillance and control, this methodology is complemented by insightful visualizations. • Actionable Insights: Beyond filling crucial gaps in dengue analysis, the research provides actionable insights for public health interventions, resource allocation, and targeted strategies.
This research is structured as follows. In Section
Related works
The literature on dengue prediction in Bangladesh encompasses various models and methodologies aimed at addressing the increasing public health problem. Naher et al. (2022) emphasized the importance of early warning systems in controlling dengue epidemics and recommended the ARIMA model for accurate forecasting. Their study found an effective forecasting model and predicts a worrying rise in dengue cases. 23 Khan et al. (2022) address the challenge of predicting dengue outbreaks in Bangladesh using multilayer perceptron neural networks (NN) and decision tree models. Although their research outperforms conventional methods, achieving an accuracy of over 90% and detecting seasonal patterns remains challenging. 24
Krishnan et al. (2022) contribute to the literature by predicting dengue outbreaks using artificial neural networks and decision tree models, both of which are based on meteorological data. The study emphasizes climate variables in predicting outbreaks but identifies limitations in the dataset’s parameters. 25 Rana et al. (2022) propose the Dengue Fever Expert System using Machine Learning Analytics (DFES-MLA) for efficient dengue prediction. While their model showcases strengths, challenges in selecting vulnerable features and the correct classifier are acknowledged. 26
Chakraborty et al. (2019) introduce a hybrid ARIMA-NNAR model for forecasting dengue epidemics, emphasizing its reduction of model uncertainty. However, the study acknowledges the universal challenge of model applicability in diverse circumstances. 27 Lowe et al. (2014) present an innovative approach to forecasting dengue fever risk during the World Cup in Brazil, integrating real-time seasonal climate forecasts. The study provides valuable early warnings but is criticized for lacking a comprehensive discussion on limitations. 28
Hoyos et al. (2021) conducted a systematic literature review on dengue modeling using machine learning techniques, identifying challenges and opportunities. 29 Despite limitations in the scope of the search, the review offers valuable insights into improving dengue control through diagnostic, epidemiological, and intervention models.
Caicedo-Torres et al. (2016) suggest using machine learning to predict the severity of dengue early on. However, they admit that their dataset is not completely balanced, which is one of the problems they mention. 30 In a comprehensive review, Hoyos et al. (2021) provide insights into challenges and opportunities in dengue modeling using machine learning techniques. 29 The review highlights the urgent need for models to manage data uncertainty and suggests future research priorities for improved dengue control strategies.
Research on dengue prediction and surveillance encompasses a diverse range of methodologies, revealing distinct strengths and limitations. Reiner et al. provide a global overview, offering a comprehensive foundation for understanding current and future disease distribution. 31 In their systematic review, Johansson et al. emphasizes the need for standardized approaches in modeling tools for dengue risk mapping, despite potential weaknesses. 32
Machine learning approaches, exemplified by Liu et al., leverage real-time data for accurate predictions, although complexities in model interpretation may pose challenges. 33 Regional predictions, such as those made by Salim et al. in Selangor, Malaysia, are effective at taking into account socioeconomic factors to provide a comprehensive picture of the region. However, they may not be applicable in other locations. 34
Yadav et al. integrate weather data into machine learning models for dengue prevalence prediction in India, enhancing models with climatic factors. 35 Similarly, Manjunath et al. utilize LSTM neural networks for multivariate time-series forecasting in the Mysore district, Karnataka. 36 Chen et al. focus on real-time forecasting at a neighborhood level in tropical urban Singapore, providing actionable insights for localized interventions. 37 Zheng et al.’s systematic review explore data-driven methods, emphasizing the integration of real-world and big data. 38
In the context of machine learning, decision tree algorithms, as employed by Thein et al., offer transparency and interpretability in early-phase diagnosis and outcome prediction for dengue fever. While DT contributes to a clear understanding of the complex disease process, potential weaknesses may include oversimplification of the intricate dynamics involved. 39
In summary, global dengue forecasting, especially in Bangladesh, reveals studies with notable strengths and identified weaknesses. For example, Naher et al. 23 highlighted the need for early warning systems and proposed the ARIMA model for accurate forecasting, yet they do not project potential dengue case surges. Existing studies on dengue prediction use a wide range of machine learning and statistical models, each with unique strengths and challenges. However, limitations such as data quality, feature selection, model generalizability, and early warning accuracy remain areas of active research. These gaps provide opportunities for hybrid and integrative approaches to improve risk prediction and outbreak management.
Methodology
Our research methodology combines both unsupervised and supervised techniques to develop a hybrid model that aims to understand and predict dengue disease patterns in Bangladesh. A pivotal aspect of our contribution is the meticulous structuring of a previously unavailable dataset, which addresses a critical gap in dengue epidemiology research for the Bangladeshi population. This effort not only establishes the foundation for our analyses but also serves as a resource for future studies in this field. Our methodical approach, as illustrated in Figure 1, employs advanced techniques to identify hidden patterns and make predictions, even in the absence of an organized dataset. Hybrid model integrating unsupervised and supervised techniques for dengue prediction in Bangladesh, addressing a critical data gap.
Data retrieval and structuring
Our research commences with the acquisition of dengue case information from a reliable source for healthcare data. The data collection involves a meticulous approach, utilizing manual extraction to ensure a comprehensive and representative dataset. After collecting the information, it is systematically organized into a structured format, laying the groundwork for subsequent analyses.
Data cleaning and feature engineering
The integrity of our dataset is paramount, and thus, we embark on a thorough data cleaning and feature engineering process. This process involves addressing missing values, outliers, and inconsistencies with precision and accuracy. Additionally, special attention should be given to formatting dates and numerical values correctly. The outcome of this phase is the creation of a feature set that incorporates variables such as year, date, hospital patients, daily cases, daily deaths, and daily recoveries, establishing a robust foundation for our analytical endeavors.
Multivariate trend analysis
Our analytical journey includes a comprehensive exploratory data analysis (EDA) to unravel the dataset’s intricacies. Visualizations are employed to reveal temporal trends, geographical distribution, and any discernible patterns within the data. This phase serves as a crucial precursor, providing insights that shape subsequent stages of our research.
Feature scaling
Ensuring the equitable contribution of features to our analyses necessitates the normalization of the dataset. If required, feature scaling, including dimension reduction techniques, will be applied to bring variables to a consistent scale. A standard technique used for normalization in this study is Min-Max Feature Scaling, as outlined in Algorithm 1. This step is crucial for fostering accurate interpretations of results and facilitating meaningful comparisons between different features. Additionally, dimension reduction methods may be employed to streamline the dataset, enhancing the efficiency of subsequent analyses, particularly when applying cluster algorithms. This strategic incorporation of dimension reduction enhances the robustness of our methodology, enabling a more nuanced exploration of dengue disease patterns in the Bangladeshi population.
Cluster optimality assessment
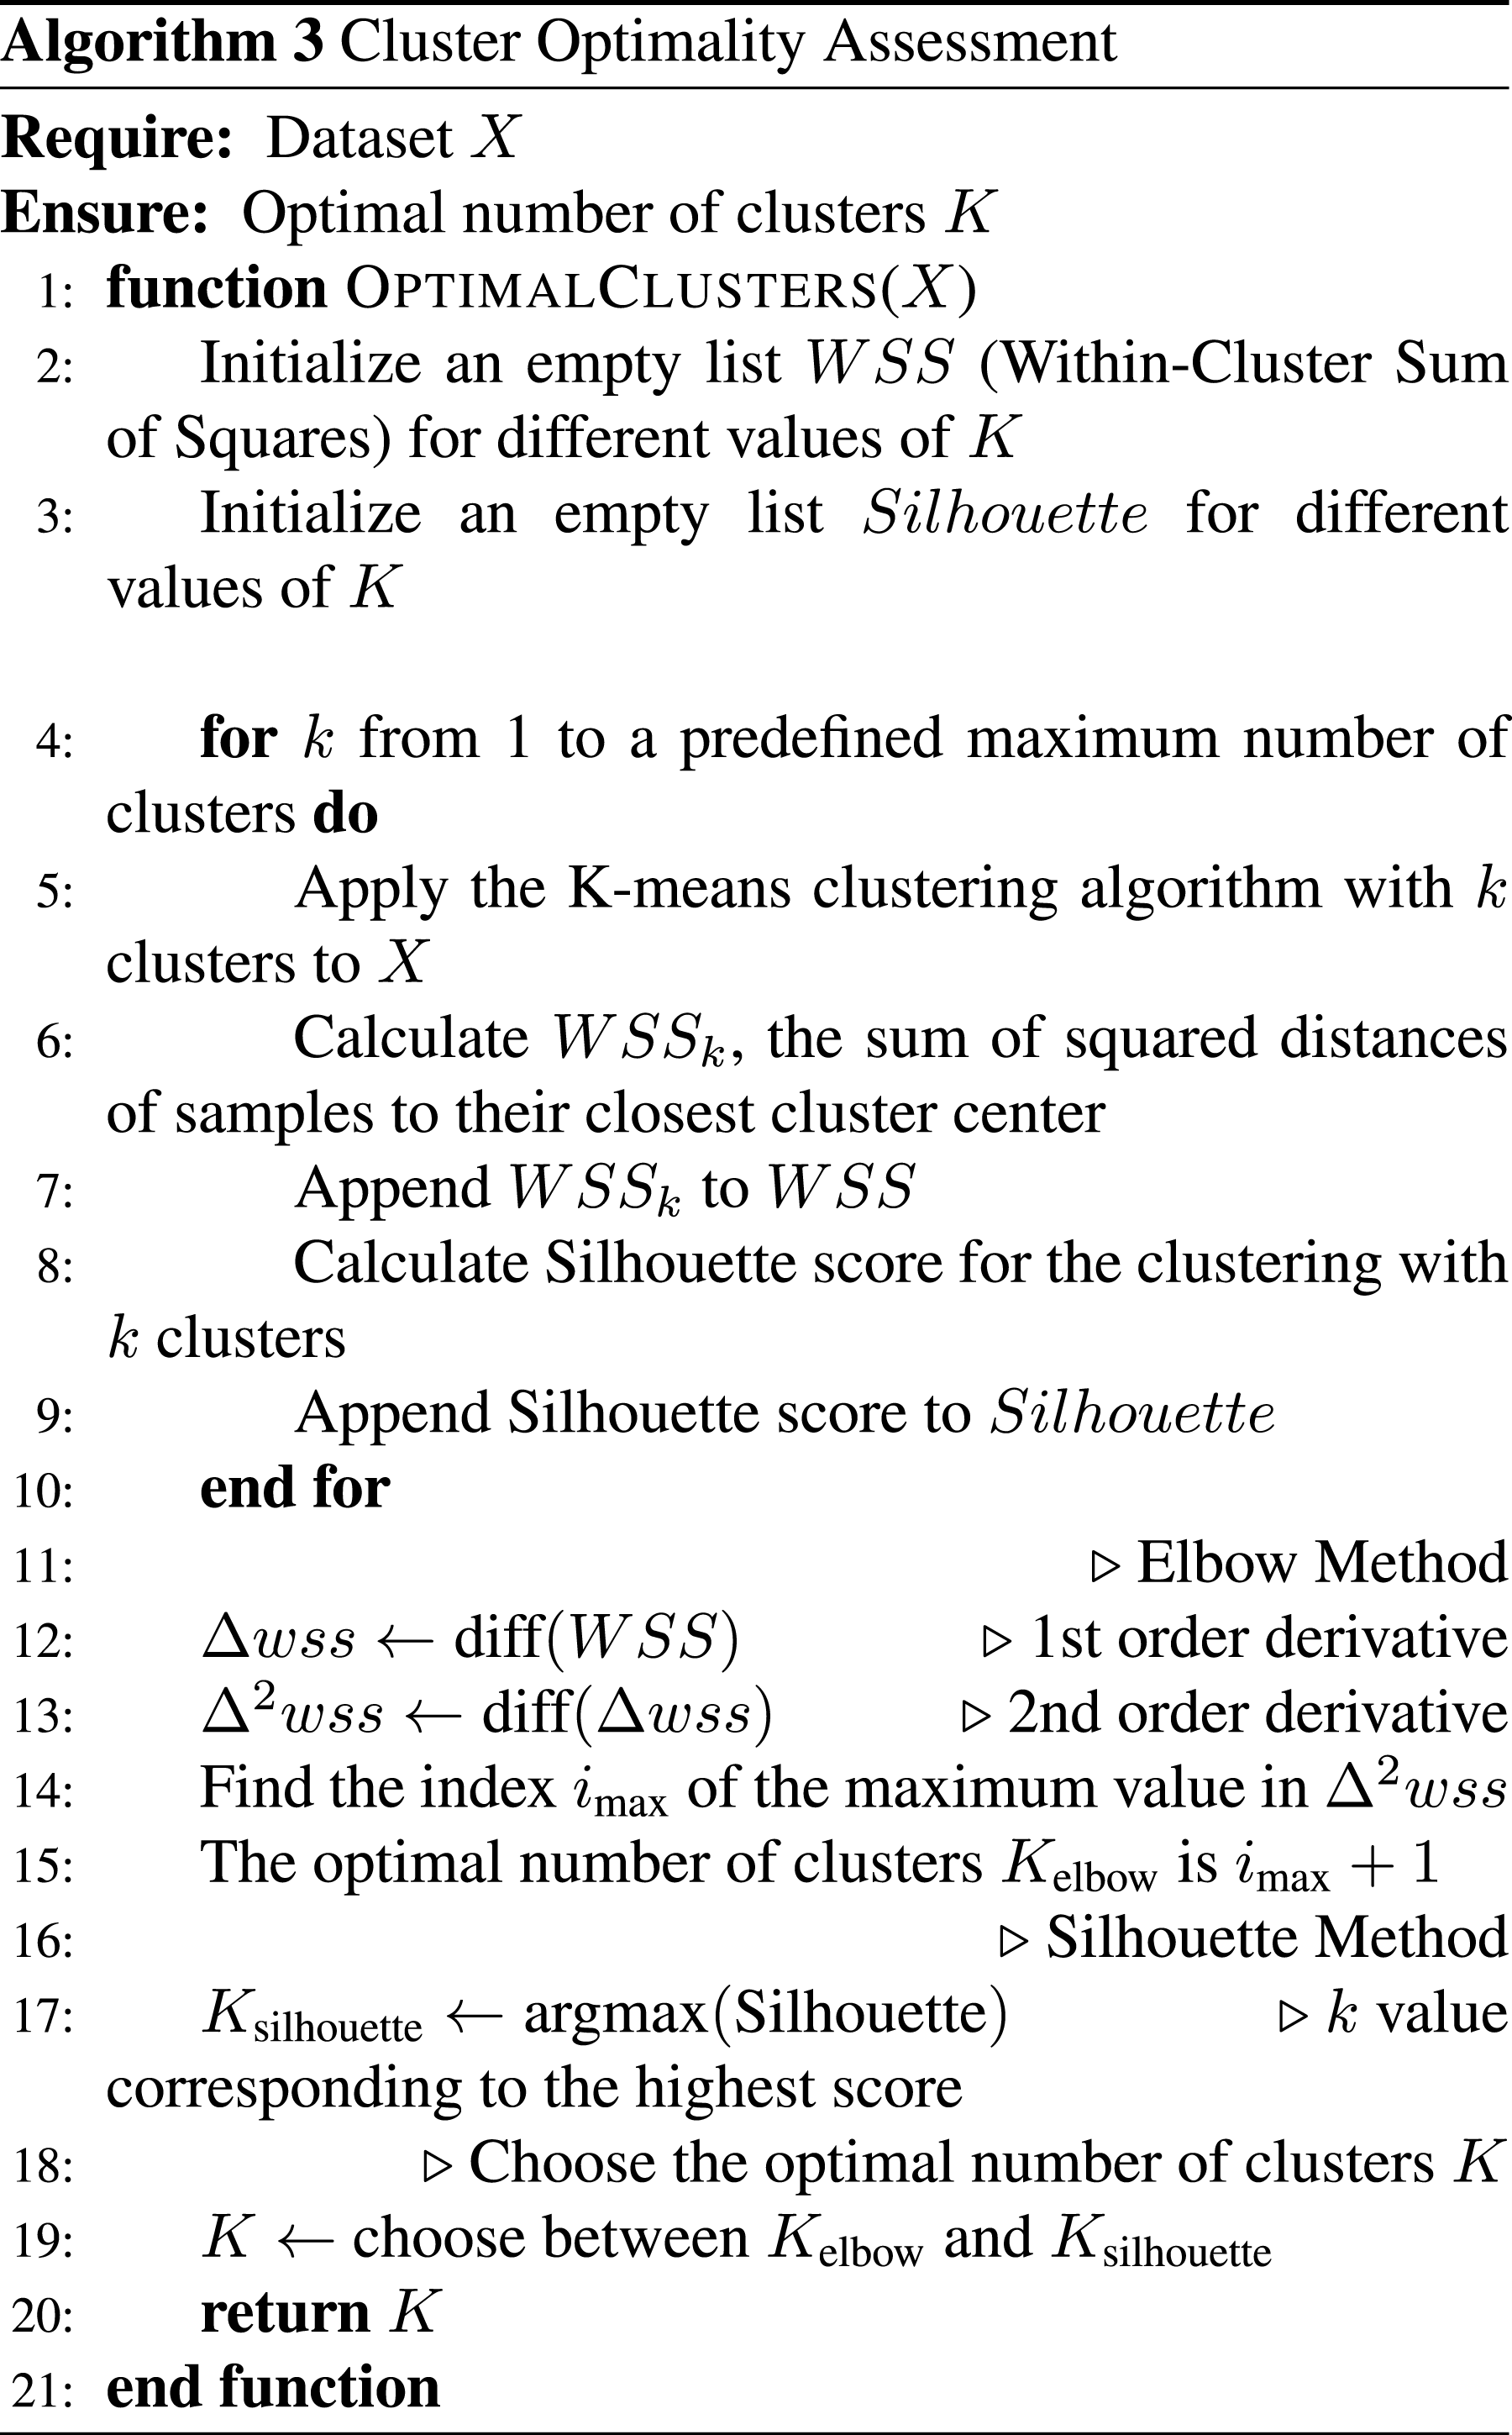
The process of identifying inherent patterns within the dataset takes center stage through cluster analysis. Employing both the elbow method and silhouette analysis, we diligently determine the optimal number of clusters (K), as operationalized in Algorithm 3. Subsequently, the K-means clustering algorithm (as shown in Algorithm 2) is deployed to group similar patterns, fostering a nuanced understanding of the underlying structure of the dengue disease data.
Clustering performance evaluation
A meticulous evaluation of the K-means clustering algorithm was conducted, leveraging multiple validation metrics, including inertia, the Silhouette score, the Calinski-Harabasz index, and the Davies-Bouldin index. The resulting clusters undergo a comprehensive interpretability assessment, providing meaningful insights into the patterns encapsulated within the Dengue dataset.
Labeling dataset
To enhance the richness of our dataset, K-means cluster labels will be incorporated. These labels serve as a reference point, providing a clear representation of the clusters achieved through the intricate clustering process.
Supervised learning and evaluation
As no pre-labeled dengue risk dataset exists for Bangladesh, we used unsupervised clustering to generate class labels based on patterns in key features such as total cases, deaths, and releases. This method enabled us to construct a structured, labeled dataset for training predictive models. The supervised learning step was applied to (i) verify the consistency and quality of the derived labels and (ii) develop models capable of predicting future dengue risk levels using new data. This approach lays the foundation for scalable, real-time risk classification and early warning systems in data-scarce public health contexts. The overall procedures are demonstrated in Algorithm 4.
A strategic division of the labeled dataset into training and testing sets will precede the application of machine learning classifiers. The evaluation of classifier performance is conducted rigorously, utilizing metrics such as accuracy, precision, and recall to provide a nuanced understanding of their efficacy.
Identification of predictive features
The culminating phase of our methodology involves an in-depth exploration to identify predictive features. This analysis aims to uncover the key factors, including cluster labels, that significantly contribute to the accurate prediction of dengue outbreaks, as shown in Algorithm 5.
Clinical framework and ethical considerations
To ensure the clinical relevance and ethical integrity of this study, we have incorporated a structured clinical framework into our methodology. Ethical considerations were addressed by exclusively using publicly available, anonymized data from the Directorate General of Health Services (DGHS), eliminating any direct patient involvement or identifiable personal information. The inclusion criteria focused on daily records of confirmed dengue cases reported by government and private hospitals in Bangladesh between 2019 and 2023. Entries were included if they contained complete information on patient counts, deaths, and recoveries. Records with missing or inconsistent values were excluded to maintain data integrity and accuracy. The study population comprises aggregated daily statistics representing a wide demographic range across urban and rural healthcare facilities, ensuring a broad and representative overview of the dengue-affected population in Bangladesh. This framework supports the integrity and applicability of our hybrid modeling approach.


Experiments and result analysis
This section presents the experimental setup and analyzes the obtained results. The analysis begins with a detailed overview of the experimental configuration, followed by a thorough examination of the results. The goal of this analysis is to offer insights and interpretations that contribute to the overall objectives of the research.
Dataset collection and preparation
Our experimental setup starts with the acquisition and preparation of dengue case information from the Directorate General of Health Services (DGHS) website, which serves as a reliable source for healthcare data in Bangladesh. The data collection process is systematic and involves meticulous manual extraction techniques. This approach ensures the development of a comprehensive and representative dataset. After gathering the information, it is organized into a structured format, providing a solid foundation for future analyses. The step-by-step process is as follows: • Visit the DGHS Website
1
• Navigate to Dengue Section • Identify Relevant Information • Manually Extract Data: – For each relevant piece of information: * Store the contents into a spreadsheet or text document. * Double-check the accuracy of • Ensure Data Accuracy • Organize Data Structure • Document the Extraction Process • Repeat as Needed • Save Data in a Suitable Format
In crafting our dataset, we meticulously organized and structured the features, selecting columns that hold the extracted pertinent information. The chosen features encompass critical details such as ’Year,’ ’Month,’ ’Day,’ ’Patients in Government,’ ’Patients in Private,’ ’Total Death,’ ’Total Release,’ ’Per Day Death,’ ’Per Day Release,’ and ’Total Affected.’ Spanning the years 2019, 2020, 2021, 2022, and 2023, this dataset provides a comprehensive overview of dengue-related information, offering daily insights for each year.
Number of days in each month yearwise: temporal overview of dengue-related records.

The presence of ’0′ in certain months (see Table 1) indicates that, according to the available information from the DGHS website, there were no recorded Dengue-related records for those particular months in the specified years. This lack of information might be due to various factors, such as the absence of reported cases, the unavailability of data, or other reasons that resulted in a dearth of dengue-related records during those specific months. It is essential to consider such gaps in the dataset when interpreting and analyzing the temporal patterns of dengue occurrences.
Exploratory analysis of the dataset
We begin a detailed exploratory study of the data from the dengue case obtained from the DGHS website, based on the careful preparation and collection of the data set described in the previous section. During this analytical stage, we focused on identifying trends and insights within the dataset, which spans the years 2019 through 2023. The key variables are visually represented in Figure 2, which provides a comprehensive view of patient counts in both the government and commercial sectors, total deaths, total releases, and the total number of affected individuals overall. Since every data point is associated with a particular year, it is easier to compare and evaluate trends within these crucial dengue-related data points. The basis refers to our further analysis and interpretation of the dataset, and this visualization facilitates a more sophisticated comprehension of the dataset. Patients’ medical records over the years.
The presented figure (as shown in Figure 2) offers insightful observations regarding dengue cases from 2019 to 2023. Notably, 2023 stands out as the peak year, marked by the highest counts in key variables, including patients in the government sector, patients in the private sector, total deaths, total releases, and total affected individuals. This trend indicates a significant surge in dengue cases during that period. Additionally, a consistent upward trend in dengue cases is evident from 2019 to 2023, indicating a general increase over the specified period. The year 2022 also exhibits heightened figures, particularly in patients admitted to government hospitals, total deaths, and total affected, but these counts are surpassed by those in 2023. Conversely, 2020 and 2021 display relatively lower counts across all variables, indicating potential fluctuations during these years. Furthermore, the figure highlights a consistent difference in the impact of dengue on patients in government and private hospitals, with the latter consistently showing lower counts. These insights lay the groundwork for a deeper exploration, prompting an examination of the factors contributing to the observed patterns in dengue cases throughout this period.
Continuing our exploration of dengue case trends, the subsequent analysis delves into the temporal dynamics of hospital admissions. The graph presented in Figure 3 illustrates the trends in patients admitted to hospitals, with the horizontal axis representing the course of time in days and the vertical axis indicating the number of patients. Notably, the figure reveals that the number of patients admitted to government hospitals surpasses that in private hospitals over a period of days. This visualization enables us to identify patterns and fluctuations in hospital admissions, providing insights into the nuances of dengue cases within specific healthcare sectors. The analysis aims to unveil temporal correlations and variations in patient counts, providing a valuable perspective on the evolving nature of dengue-related hospitalizations. Temporal evolution of hospital admissions for dengue patients over the period.
The analysis, as shown in Figure 4, facilitates a comparison between the daily release and death counts, aiding in the identification of any potential trends or correlations. Analyzing daily release and death statistics through data-driven research reveals interesting patterns across various months. According to Figure 4(a), dengue-related activities or reporting peak during August, October, and September, when daily release counts approach 103,000, 97,011, and 99,000, respectively. November exhibits a similar pattern, with a notable daily release count of 67,282, suggesting the persistence of noteworthy dengue-related incidents. On the other hand, December shows a respectable daily release count of 47,429, even though it does not reach the peaks of the previously stated months. Analysis of daily counts for patient releases and deaths.
Examining daily death counts (Figure 4(b)), October, September, and November stand out with the highest counts at 449, 431, and 398, respectively. This observation aligns with the recorded high release counts during these months, suggesting a potential correlation between the severity of dengue cases and the number of deaths. In August and July, despite notable release counts (356 and 213, respectively), the daily death counts are relatively lower, indicating a potentially lower fatality rate during these months. December, with a notable daily release count, shows a comparatively lower daily death count of 233, suggesting a lower fatality rate relative to the release count. However, these findings contribute to a comprehensive understanding of the temporal variations in dengue factors, shedding light on months of heightened activity and potential correlations between release and death counts.
The multivariate trend analysis presented earlier in this section, as shown in Figure 2, clearly indicates that 2023 was the year with the highest dengue outbreak nationwide. A notable pattern becomes apparent when looking at the monthly statistics of patients or dengue cases for this year (as shown in Figure 5). In September, which appears to be a critical month in the dengue trend for 2023, the data reveals the following: 396 individuals succumbed to dengue-related complications in September; the medical system released 77,621 patients in response to dengue cases during the same month; the number of individuals affected by dengue in September reached 76,775. This month, in particular, showcases a significant impact on healthcare resources, with a high number of deaths, releases, and individuals affected. The detailed monthly breakdown, as provided in the data, contributes to a comprehensive understanding of the dengue situation, emphasizing the importance of targeted interventions and resource allocation during peak periods. Monthly statistics for the year 2023 depict the peak of Dengue activity.
Feature scaling and dimensionality reduction
In this section, we examine the crucial preprocessing procedures of dimensionality reduction and feature scaling. These techniques play a pivotal role in enhancing the performance and interpretability of our dataset, paving the way for more effective analyses and modeling. Feature scaling ensures that all variables contribute equally to the analysis by bringing them to a standardized scale. At the same time, dimensionality reduction techniques help mitigate the curse of dimensionality and enhance computational efficiency. We explore the methods employed, the rationale behind their application, and the impact on the dataset’s overall quality and utility. This section sets the stage for a streamlined and optimized dataset ready for advanced analytics and modeling.
In Section ”Methodology,” we initiated the preprocessing of our dataset by applying min-max normalization for feature scaling. For the correlation analysis presented in Figure 6, we selected seven key features that were later used as input variables in the supervised learning phase: Patients in Government Facilities, Patients in Private Facilities, Total Death, Total Release, Per Day Death, Per Day Release, and Total Affected. These features were chosen due to their relevance for predictive modeling and continuous nature, making them suitable for Pearson correlation analysis. Importantly, the remaining features—Year, Month, Day (temporal identifiers), and Cluster Label (used as a target variable)—were carefully excluded, as they are not suitable for correlation-based visualization, thereby ensuring the integrity of our research process. Correlation analysis among scaled features of the dataset.
The resulting correlation matrix, visualized in the heatmap presented in Figure 6, unveils insightful patterns within the interrelationships among these scaled features. Examining the heatmap, distinct patterns emerge: • There is a strong positive correlation (0.885) between ’Patients in Govt’ and ’Patients in Private,’ indicating a substantial simultaneous increase in the number of patients in both government and private hospitals. • There is an almost perfect positive correlation (0.999) between ’Total Death’ and ’Total Release,’ signifying a closely intertwined relationship between the total number of deaths and releases. • There is a robust positive correlation (0.998) between ’Total Death’ and ’Total Affected,’ suggesting a tendency for the total number of deaths to rise alongside the overall number of affected individuals. • There is a moderately positive correlation (0.635) between ’Patients in Govt’ and ’Total Affected,’ implying a moderate association between the number of patients in government hospitals and the overall number of affected individuals.
These identified patterns contribute to our understanding of the complex interactions between key dataset features, providing valuable insights for subsequent analyses and modeling endeavors. The heatmap serves as a visual aid, unraveling the complexities within the dataset and facilitating more informed decision-making processes.
After adjusting feature scaling, we proceeded with dimensionality reduction using Principal Component Analysis (PCA). Consider a dataset

Clustering analysis and evaluation
In this section, we explored the crucial phase of clustering analysis, utilizing the insights gained from feature scaling and dimensionality reduction. Employing clustering algorithms, we aim to uncover inherent patterns and groupings within the dengue-related dataset. Furthermore, we assess the performance of the chosen clustering approach, shedding light on its efficacy in capturing meaningful structures within the data. Additionally, we labeled the dataset by adding a feature using the cluster label, enhancing interpretability. In this study, K-means clustering was employed to uncover hidden patterns in dengue-related cases across multiple years. The goal was to identify natural groupings in the data—such as periods of high and low outbreak intensity—based on clinical and epidemiological features. K-means was selected due to its simplicity, scalability, and effectiveness at separating compact, spherical clusters in normalized datasets. 40
We employed the elbow method to determine the optimal number of clusters (k) before applying the k-means clustering algorithm. The elbow method involves running k-means clustering on the dataset for a range of values of k and then plotting the sum of squared distances from each point to its assigned center against k. The resulting curve typically resembles an arm, and the ”elbow” of the curve indicates the optimal number of clusters where the rate of decrease in the sum of squared distances slows down.
The graph in Figure 7 illustrates the elbow point identified when the k-means clustering algorithm was applied to our target dataset. The x-axis represents the range of k values from 1 to 11, and the y-axis shows the Within-Cluster Sum of Squares (WCSS) or distortion scores. WCSS is a measure of the compactness of clusters, reflecting the sum of squared distances between each data point and its assigned cluster center. As k increases, the WCSS generally decreases, illustrating improved clustering within smaller, more compact groups. In the figure, we also observe that the optimal elbow occurs around k = 2. The associated WCSS value is 76.59, suggesting that these values represent the optimal number of clusters for the given dengue disease dataset. This information guides the subsequent application of k-means clustering, ensuring that the chosen k captures the most meaningful structures within the data. Elbow method illustrating the optimal number of clusters for the Dengue cases dataset using k-means clustering.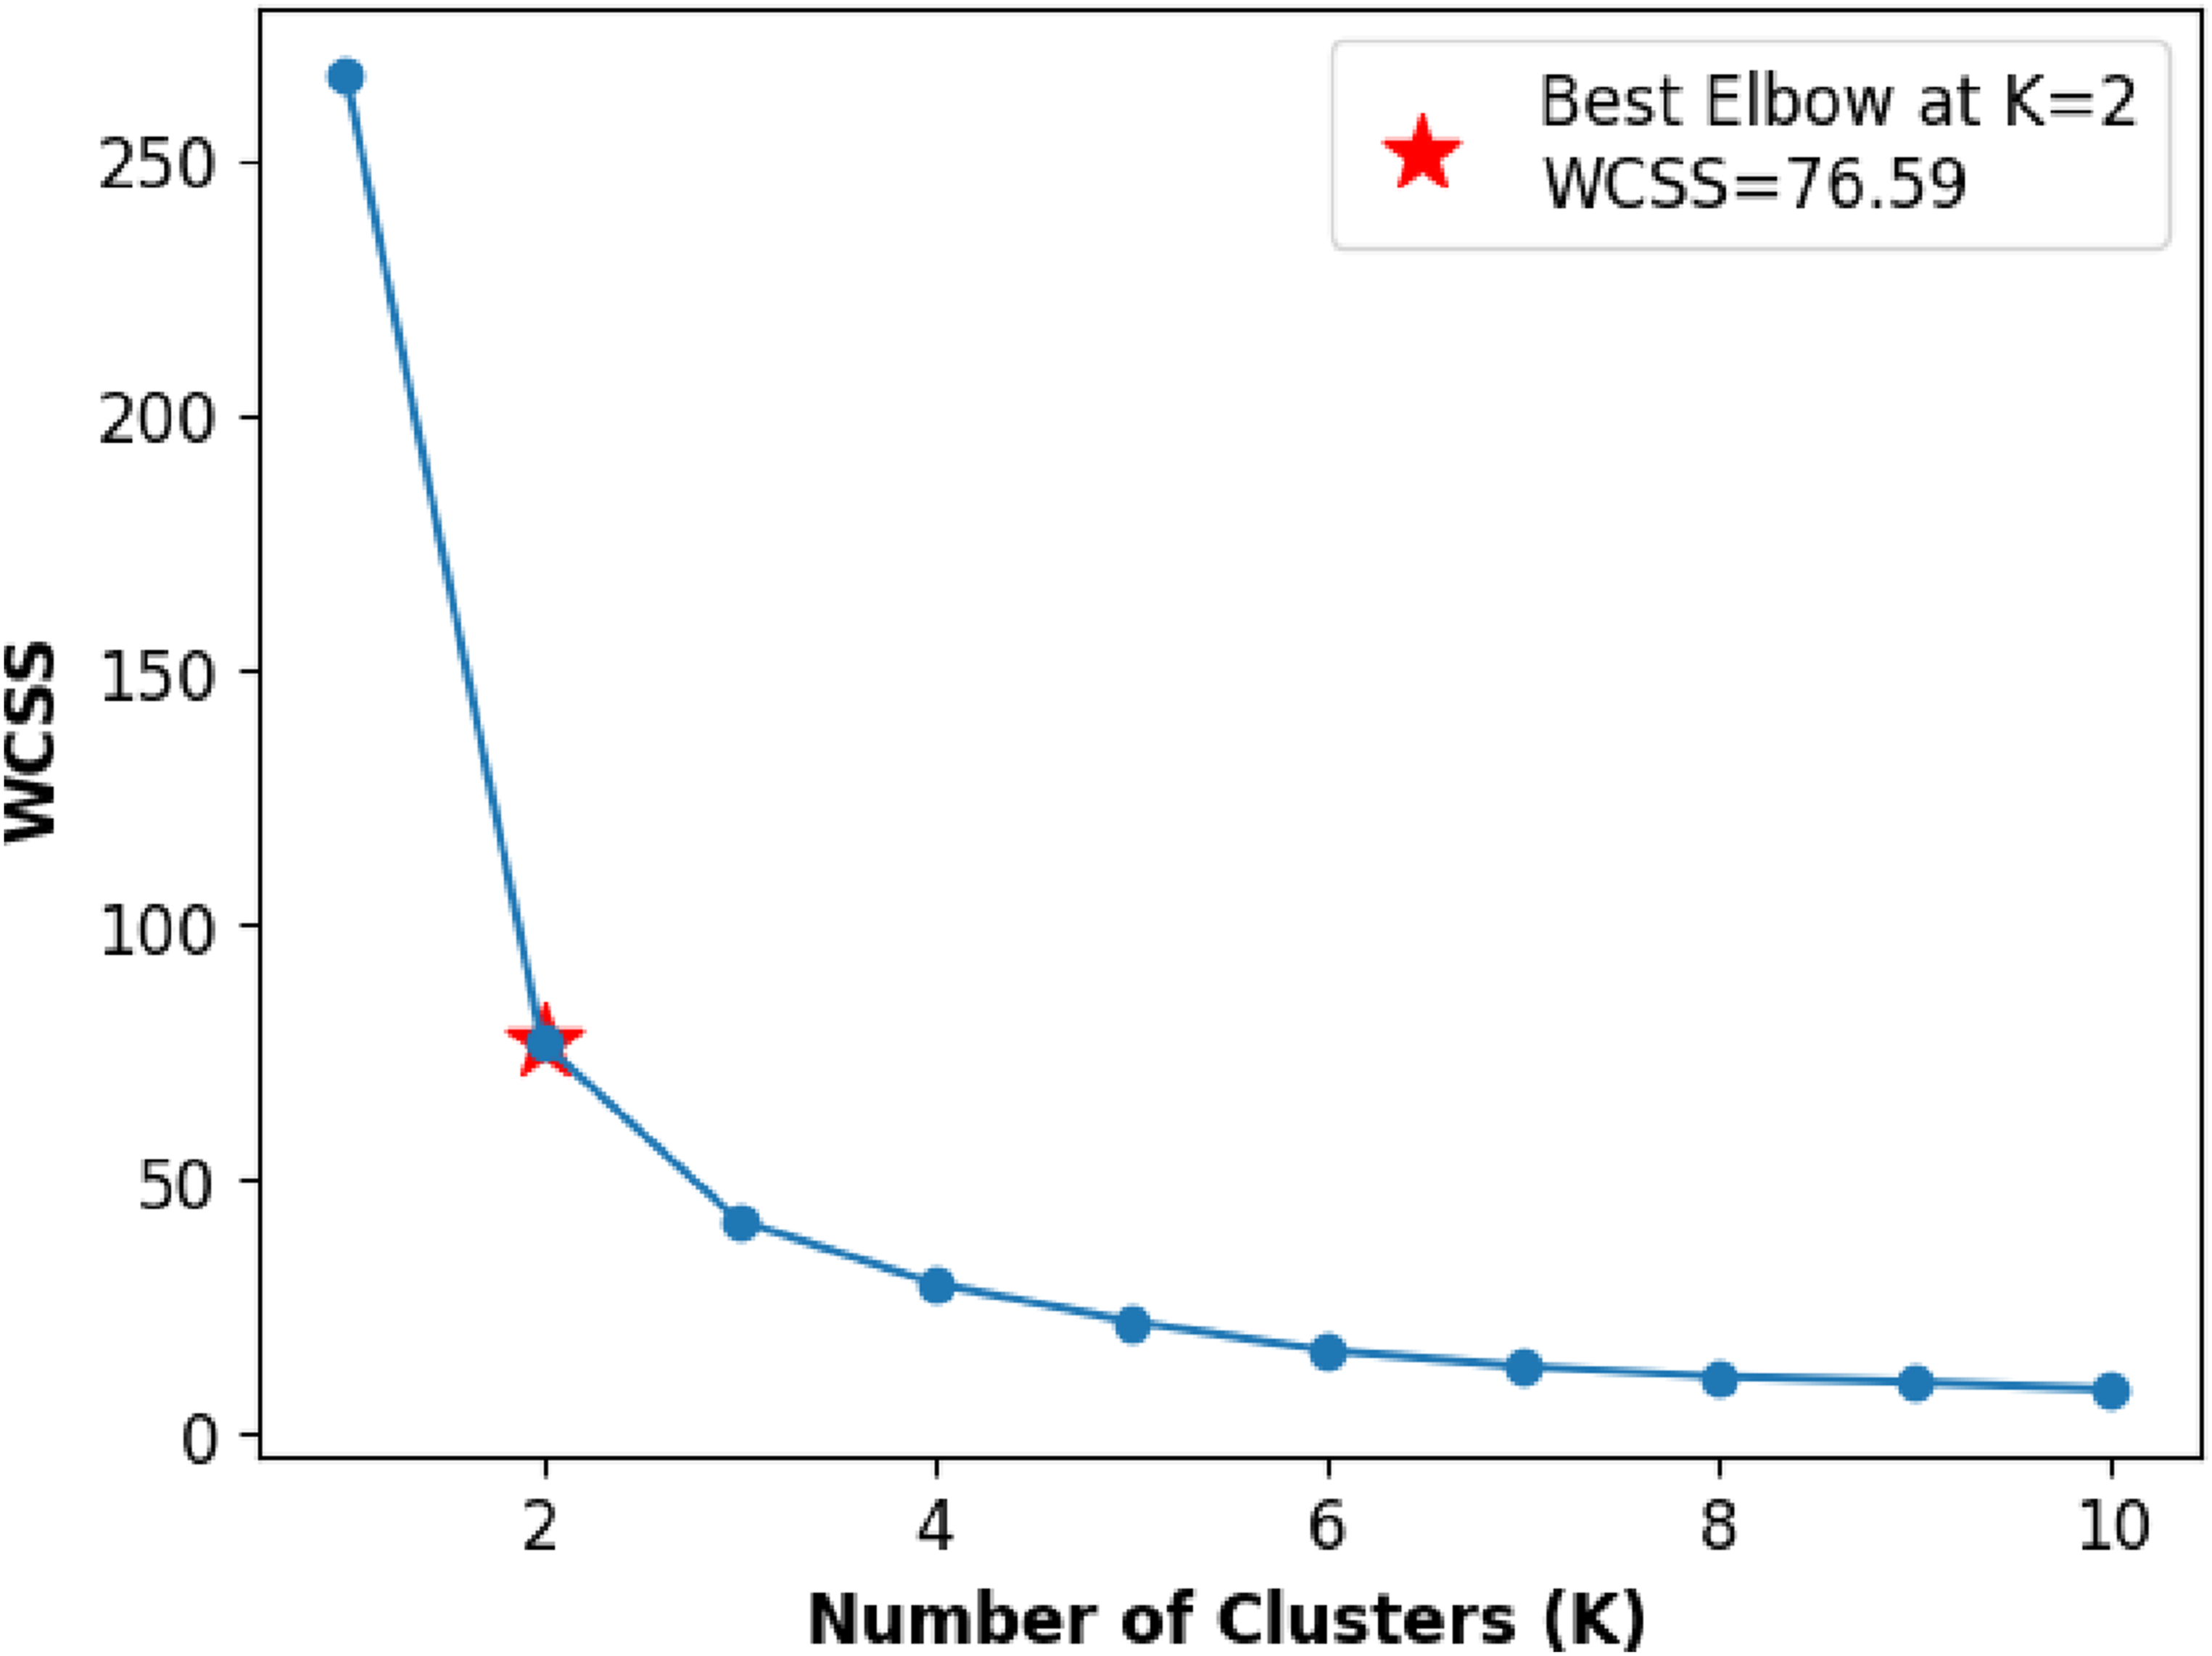
Furthermore, we employed the Silhouette Score Method to validate the optimal selection of k values in the K-means clustering algorithm, as illustrated in Figure 8. We selected a range of k values from 2 to 11 and observed that the highest silhouette score, 0.763, was achieved at k = 2, despite some fluctuation in scores for different k values. Silhouette score method illustrating the optimal number of clusters using k-means clustering.
After determining the optimal number of clusters, we performed experiments using the final preprocessed dataset, as shown in Figure 9. Cluster 1 contains 738 data points, while Cluster 2 has 161. In Figure 9(a), the clustered data is shown in a two-dimensional space using Principal Component Analysis (PCA), and Figure 9(b) shows the decision boundaries in the same 2D space. We used PCA to reduce the number of features and make the data easier to visualize while retaining most of the important information. The first principal component (PC1) is mostly influenced by ’Total Affected,’ ’Total Death,’ and ’Total Release,’ which represent the overall severity of the outbreak. The second principal component (PC2) is more affected by ’Per Day Death’ and ’Per Day Release,’ which show how the situation changes daily. This PCA projection helps us see how the two clusters are separated. Cluster 1 appears more compact, whereas Cluster 2 is more spread out, indicating that it has greater variation within the group. Visualization of clustered data points and decision boundaries after determining the optimal number of clusters.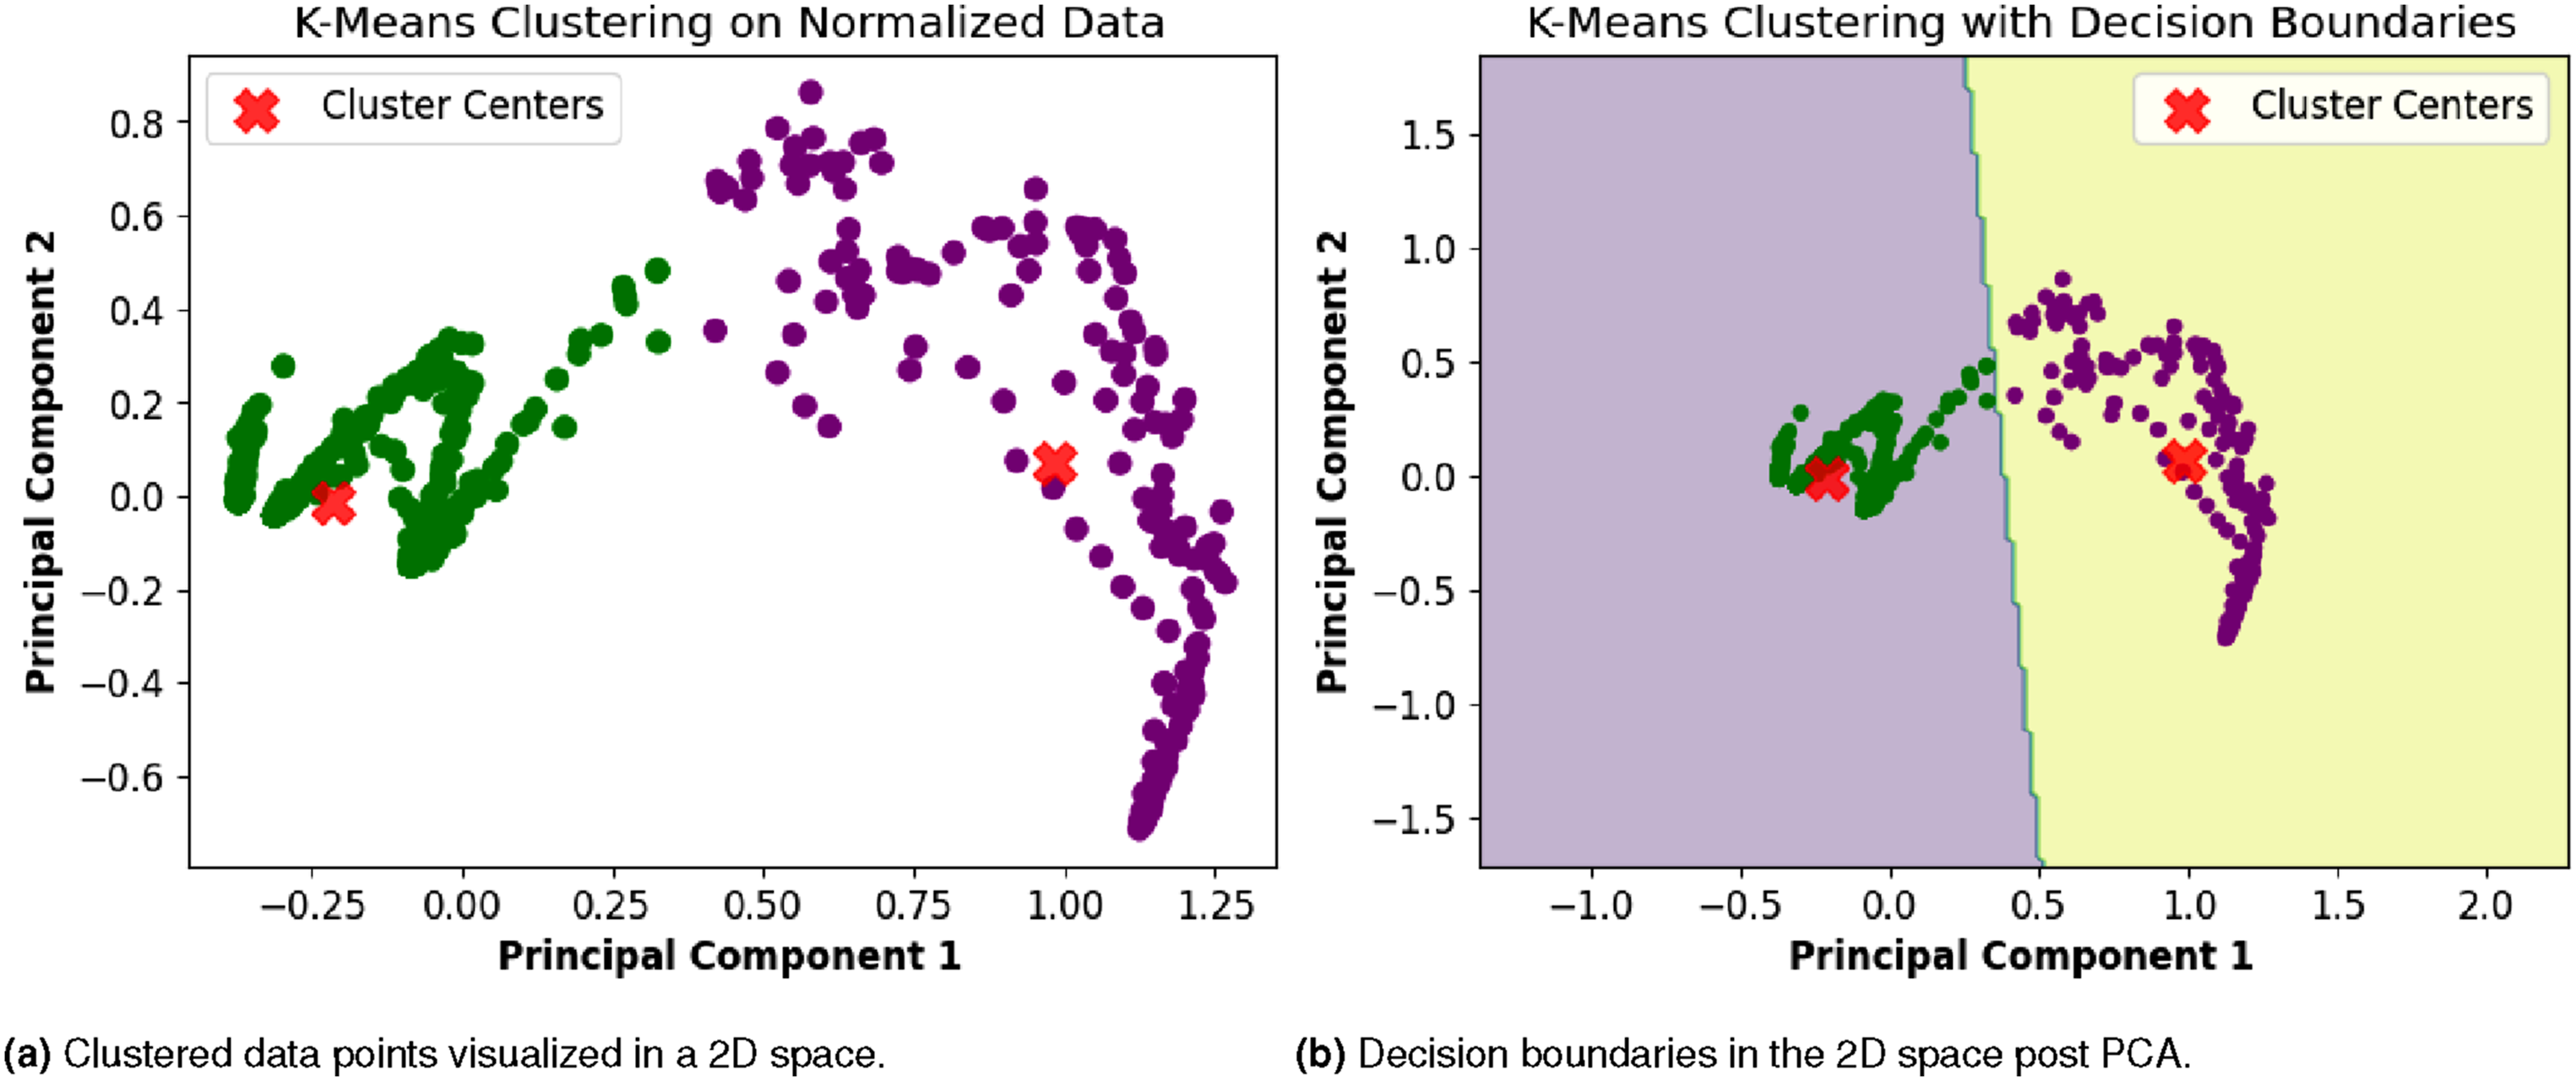
Further insights were drawn from the clustering results: the strong correlation within Cluster 1 suggests a more cohesive grouping of data points, indicating a potentially homogeneous subgroup within the dataset. On the other hand, the scattered nature of data points in Cluster 2 suggests a higher degree of variability or heterogeneity within this cluster. These findings provide valuable information for interpreting the characteristics and patterns within each cluster, facilitating a deeper understanding of the underlying structures in the data.
Performance metrics for K-means clustering.

As mentioned earlier in this section, we enhanced the dataset by adding cluster labels to make it suitable for supervised learning. After careful observation, we identified data points in Cluster 0 as representing low-risk dengue trends and Cluster 1 as indicating high-risk trends. The presence of these dengue risk patterns is visualized across the entire dataset in Figure 10. In this figure, the vertical axis represents the days of each month (1 to 31), and the horizontal axis spans 5 years, encompassing 60 months. Blank or white cells indicate dates when no medical records were available from the DGHS web source. A closer look at the figure reveals that the period from the last week of July to November in 2023 was the peak season for high dengue risk compared to other years. This detailed visualization provides valuable insight into the temporal distribution of dengue risk across the dataset. Visualizing dengue risk trends over 5 years, highlighting peak high-risk and low-risk seasons.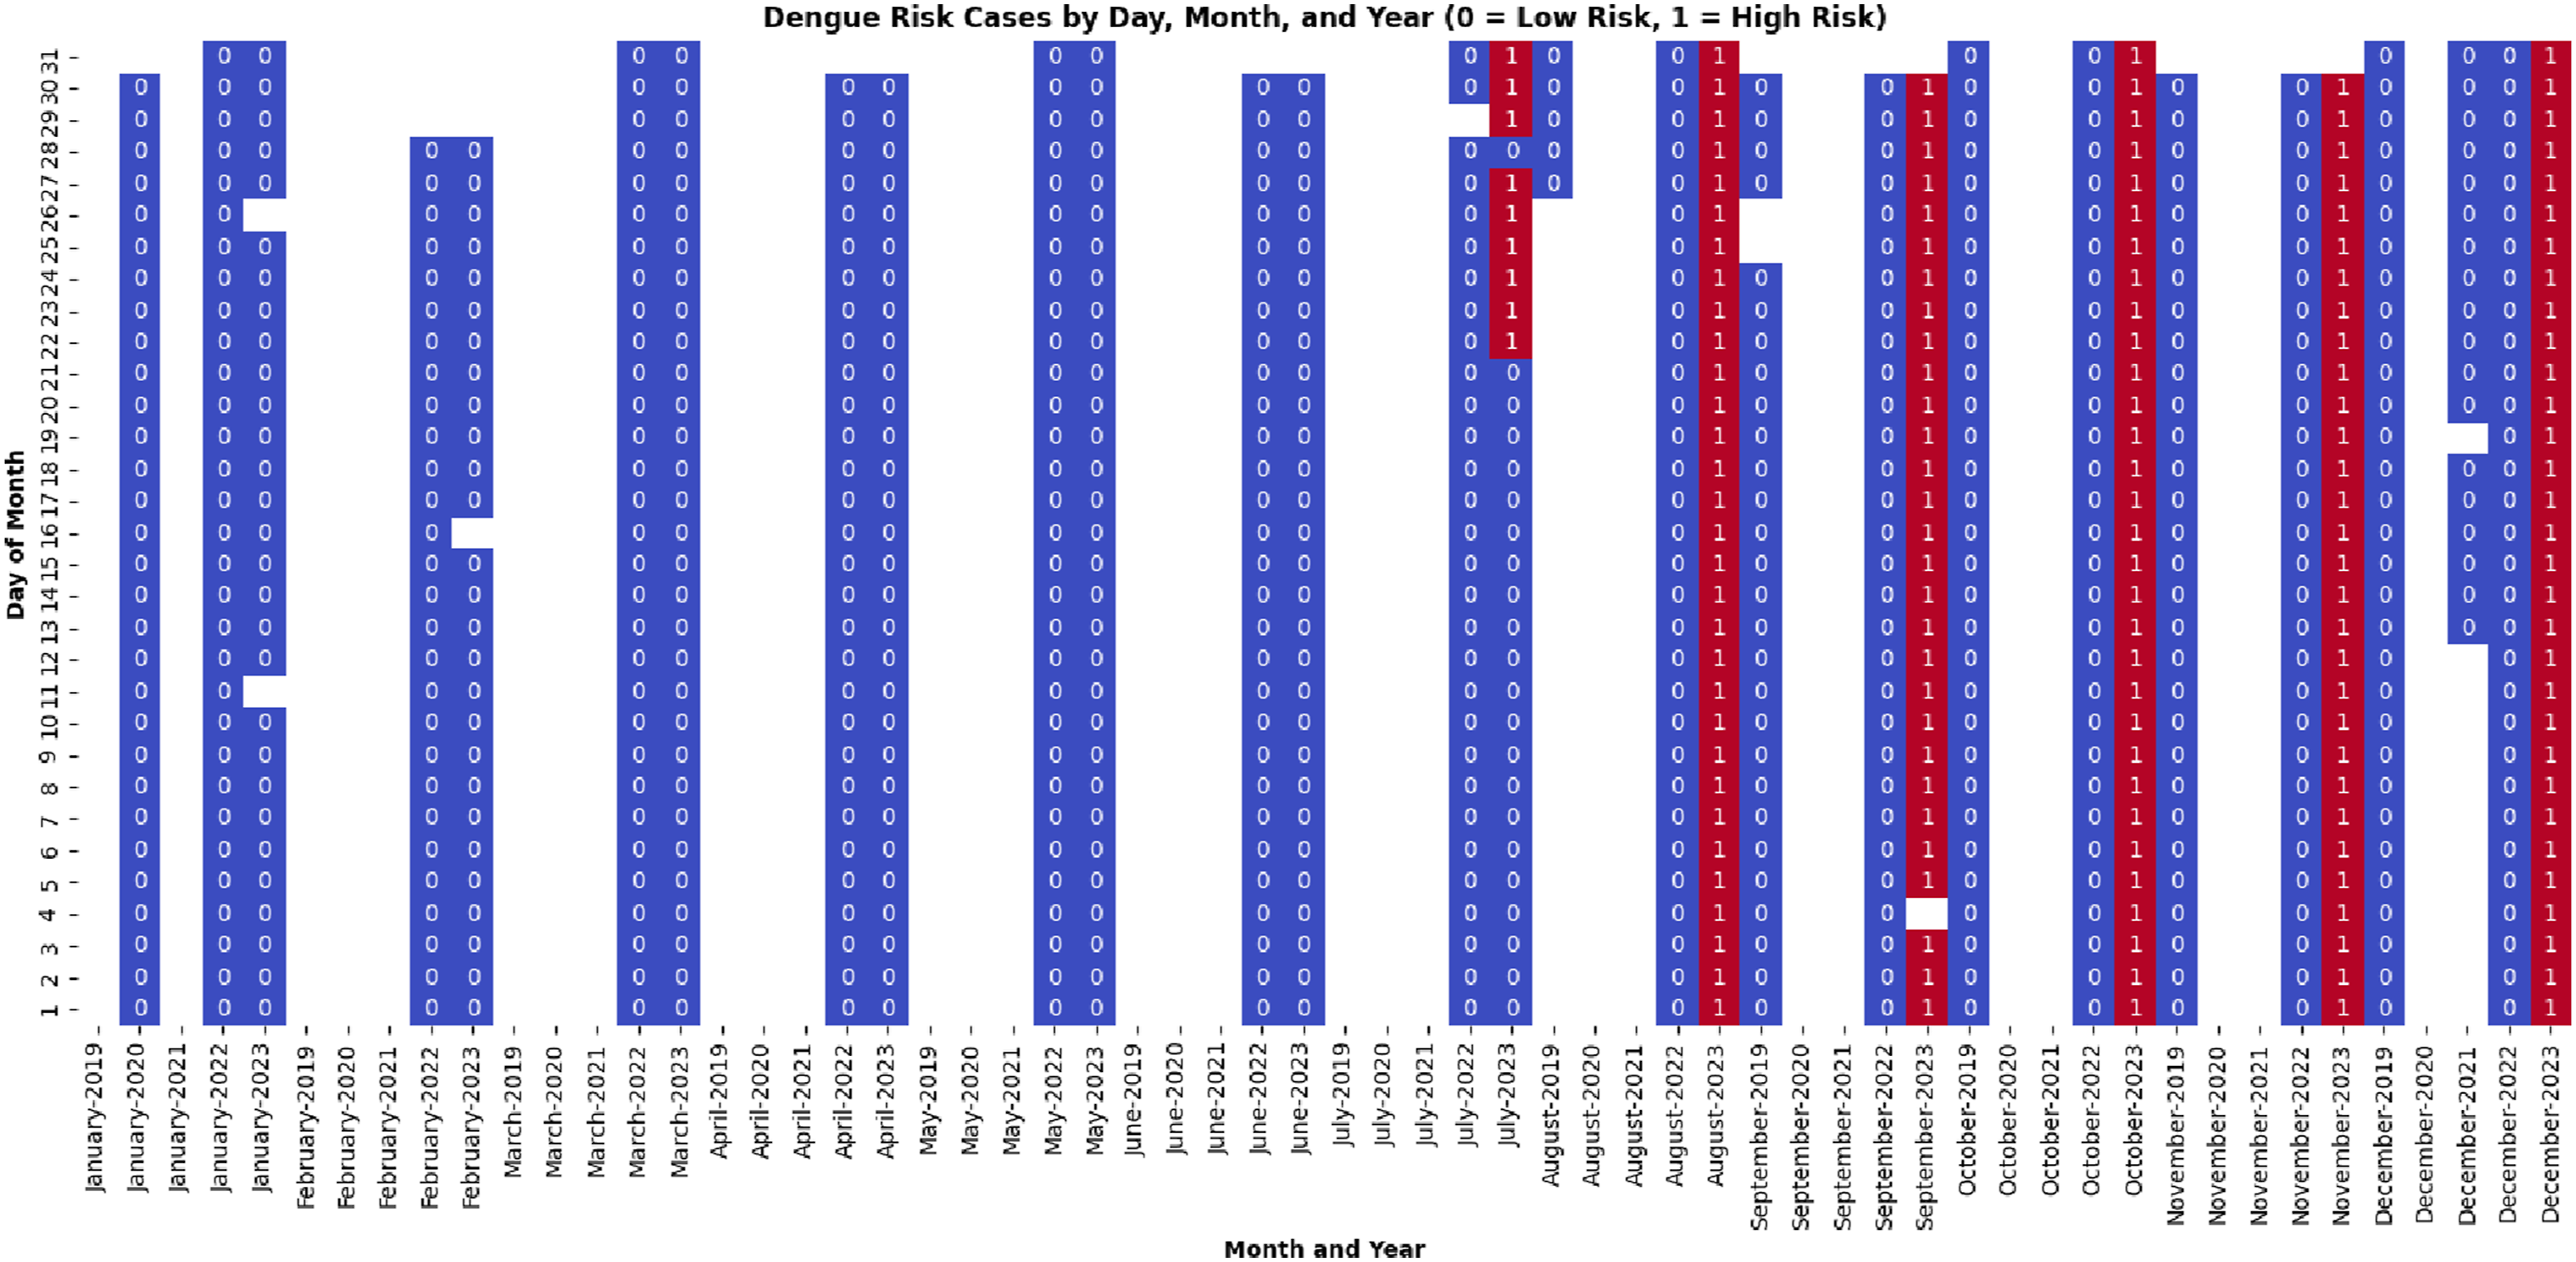
It is important to mention that one of our objectives was to analyze dengue risk patterns across months over multiple years rather than to detect intra-annual seasonal trends within a single year. Therefore, we applied min-max normalization (as shown in Algorithm 1) across the entire dataset to preserve the relative magnitudes between years. This scaling enabled us to compare risk levels across the same months in different years (e.g., August 2022 and August 2023), which would not have been possible with year-wise normalization.
Identifying features through supervised learning
In this section, we first evaluate our dataset using supervised machine learning approaches and then identify the most significant features in the dataset. Additionally, we demonstrate the effectiveness of employing clustering and classification, using a hybrid approach to conduct our research.
As the dataset comprises 11 features—(1) Year, (2) Month, (3) Day, (4) Patients in Government Facilities, (5) Patients in Private Facilities, (6) Total Death, (7) Total Release, (8) Per Day Death, (9) Per Day Release, (10) Total Affected, and (11) Cluster Label (generated during clustering)—we excluded three temporal features (Year, Month, and Day) from the supervised learning phase, as they hold no predictive value for classification purposes. We used six traditional classifiers: Naive Bayes (NB), DT, RF, Support Vector Machine (SVM), KNN, and LR. These classifiers were chosen because they work well and are recommended for datasets with few samples. 41 The filtered dataset was used to train the models along with k-fold (5-fold) cross-validation and train-test splitting (random 80:20).
Supervised learning results.


Confusion matrix for RF classifier (train-test split).
K-fold cross-validation results.

Our final analysis aims to identify predictive features within the dataset. For this purpose, we utilized the feature importance scores obtained from a tree-based model, specifically RF. The extracted features, as depicted in Figure 12, visually represent the importance of various features, and the accompanying data provide the corresponding importance scores. Specifically, the features were ranked based on their impact on the model’s predictive performance. The feature importance is as follows: ’Total affected’ with a score of 0.318, ’Total death’ with 0.258, ’Total release’ with 0.208, ’Per day release’ with 0.098, ’Patients in government facilities’ with 0.085, ’Per day death’ with 0.033, and ’Patients in private facilities’ with a minimal contribution of 0.0004. These scores provide valuable insights into the relative importance of each feature in predicting the target variable, helping us understand the key drivers within the dataset. Feature importance.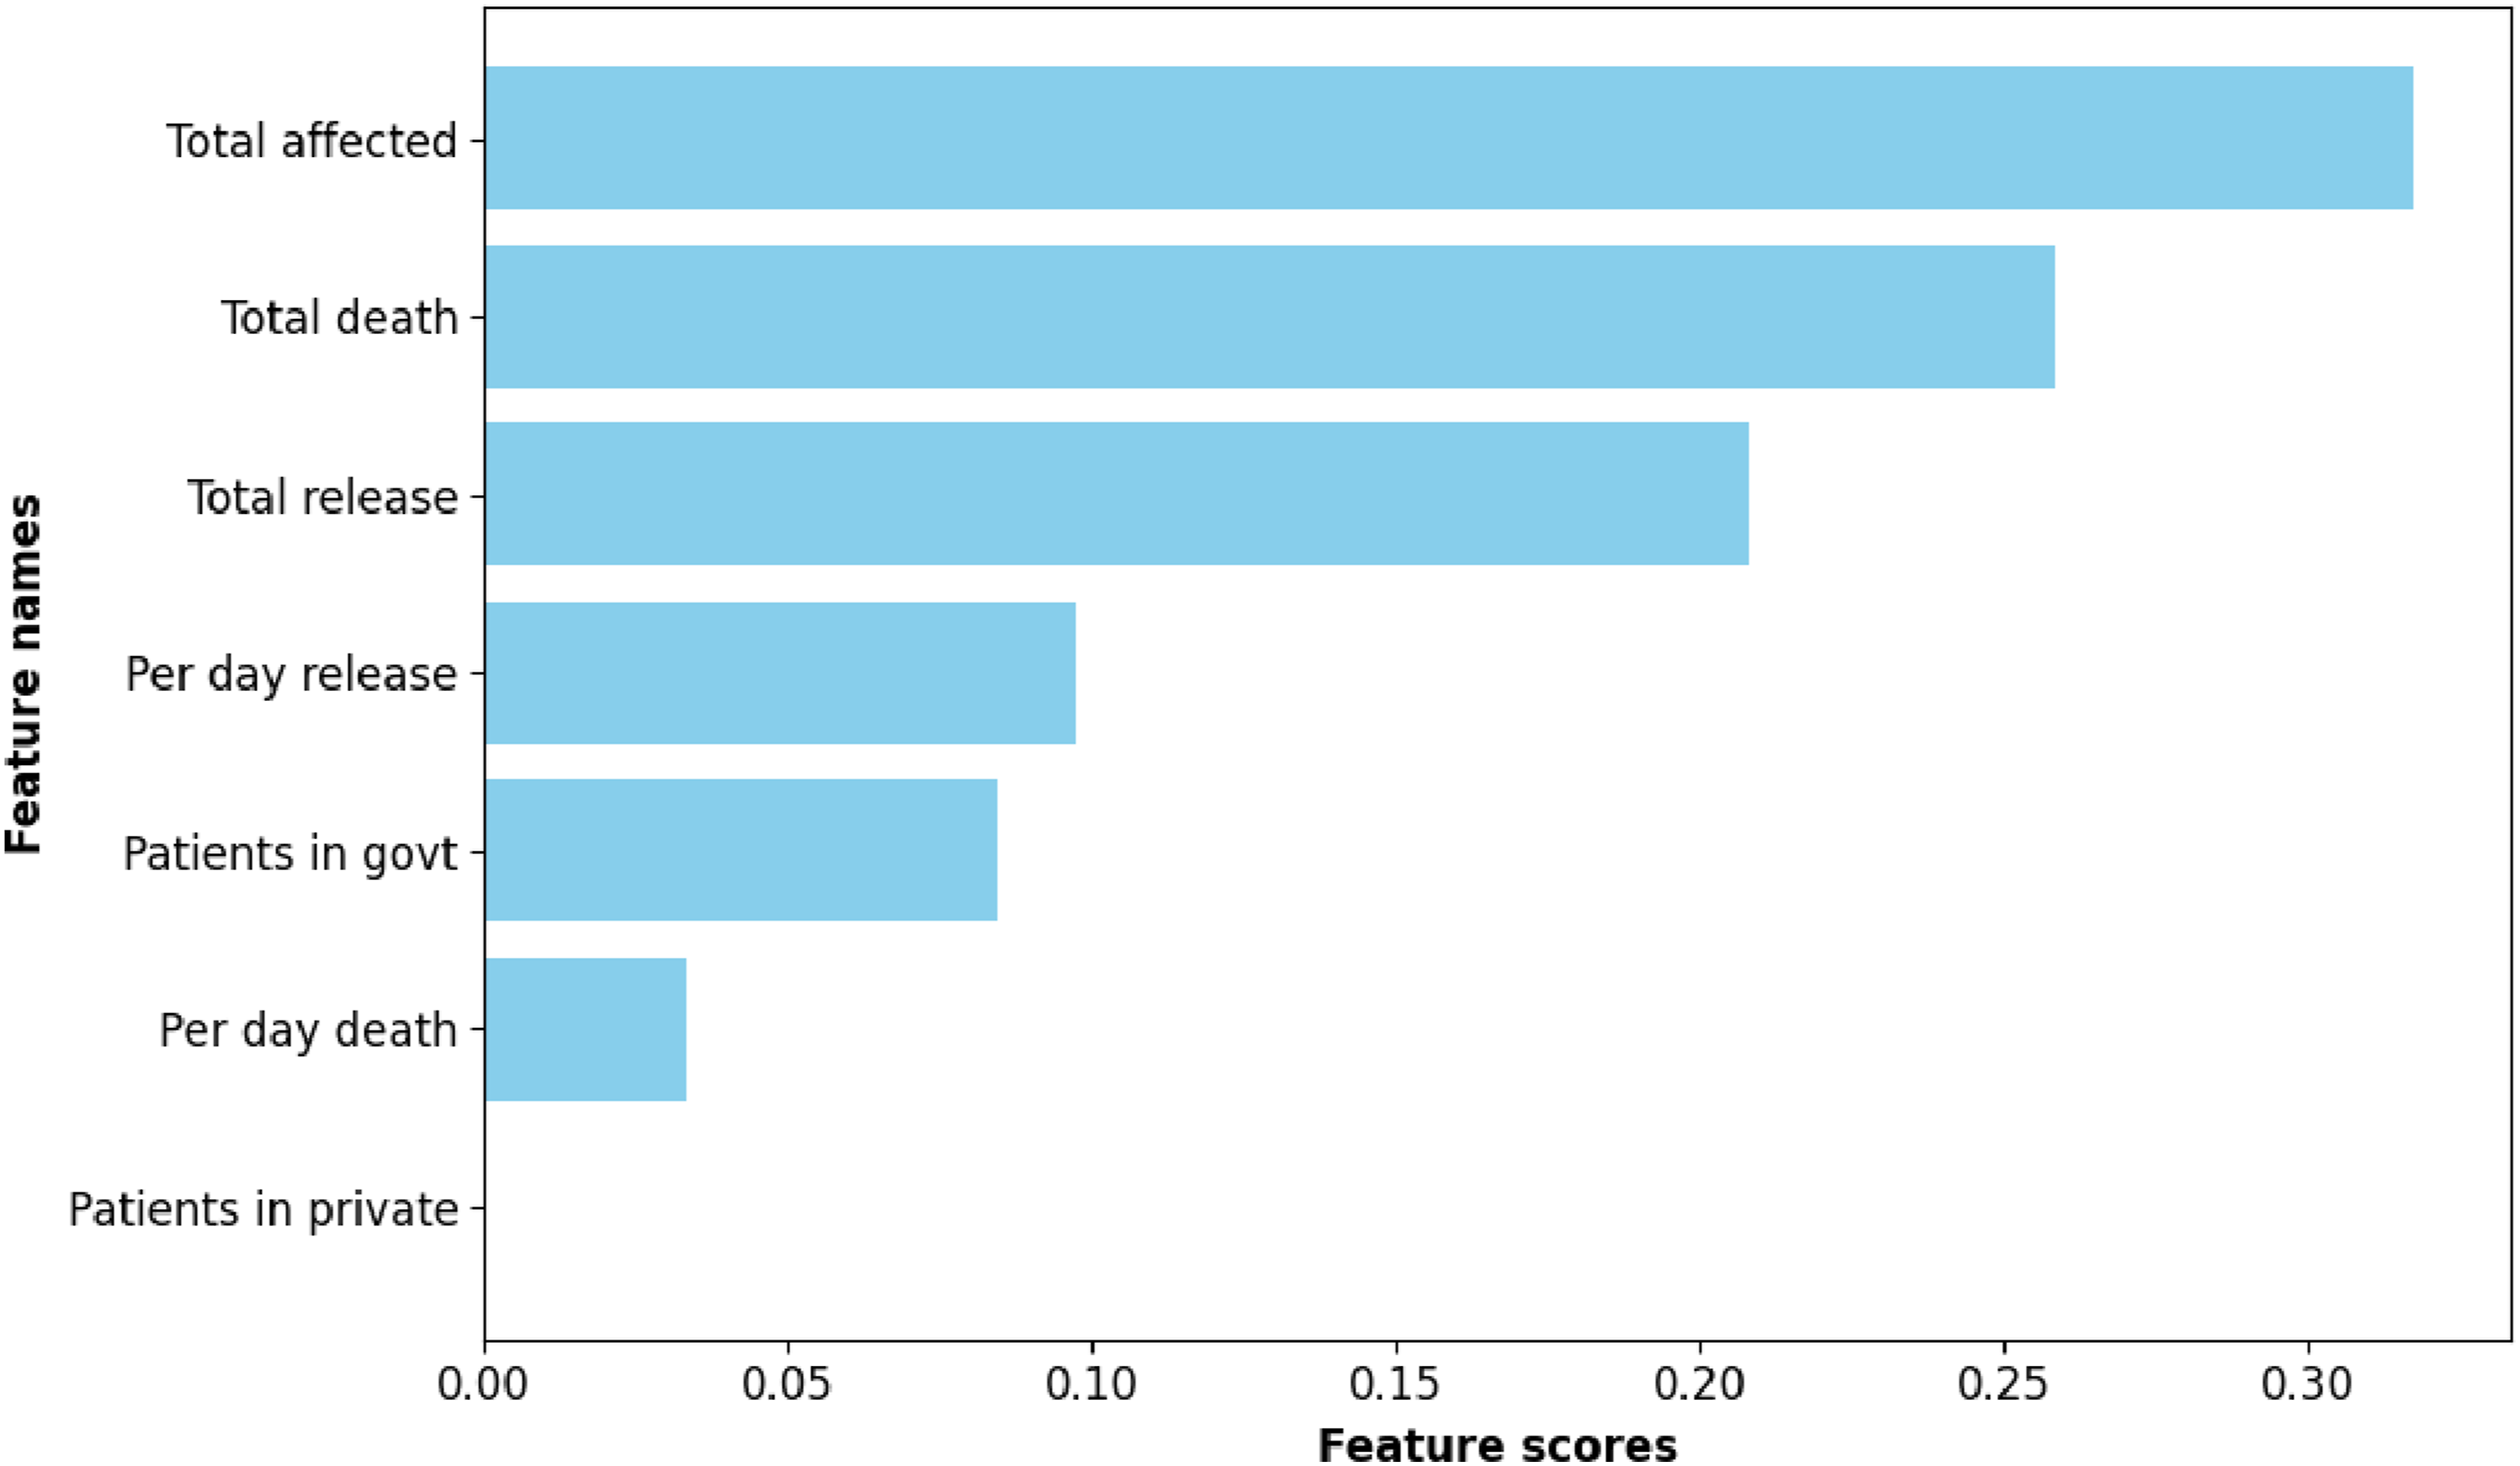
Discussion
The integration of clustering and classification techniques in our research has proven to be a highly effective and synergistic approach, bringing about a more profound understanding of the intricate patterns within the Dengue cases dataset. The utilization of clustering, specifically employing the k-means algorithm, played a crucial role in uncovering inherent structures and groupings within the data. The identified clusters not only served as distinct subgroups but also laid the groundwork for subsequent analyses, providing a foundation for a more nuanced exploration of dengue trends.
The optimal number of clusters, determined through the elbow method and silhouette score, was pivotal in ensuring that the clusters represented meaningful and well-defined structures. Visualizing the clustered data points revealed clear distinctions between different patterns, allowing for the identification of cohesive groups within the dataset. This initial clustering phase, therefore, sets the stage for a more focused and targeted analysis. Since no labeled dengue risk dataset exists in Bangladesh, clustering provided a data-driven way to define meaningful risk categories. These cluster-derived labels were then used to train predictive models, enabling future classification of dengue risk based on new, unlabeled data.
Subsequently, the incorporation of supervised learning classifiers, such as DT, RF, KNN, and LR, into the clustered dataset validated and extended the patterns identified during the clustering phase. The high accuracy, precision, recall, and F1 scores obtained from these classifiers underscored their effectiveness in accurately predicting dengue risk trends within the identified clusters. This two-step process ensured a robust and comprehensive analysis, leveraging the strengths of both clustering and classification methodologies.
Moreover, the feature importance analysis derived from the RF classifier shed light on the critical variables influencing dengue risk. This detailed understanding of feature importance not only validated the relevance of key variables but also provided actionable insights for prioritizing factors that significantly contribute to the occurrence and severity of dengue cases.
While this hybrid approach offers valuable insights, it has some limitations. First, the labels generated through clustering reflect internal patterns within the data but lack external validation. As a result, classification performance reflects internal consistency rather than accurate ground-truth accuracy. Second, we applied global normalization across the dataset rather than normalizing within each year, which may cause high-incidence years, such as 2023, to disproportionately influence the clustering outcome. Future work could explore year-wise normalization and external validation using epidemiological ground truth to enhance the robustness of findings.
In essence, the hybrid approach combining clustering and classification techniques has not only improved predictive accuracy but also provided a holistic and interpretable view of dengue-related data. This integrated methodology offers a scalable framework for future research, public health planning, and targeted interventions to mitigate the impact of dengue outbreaks. Unlike previous studies that relied on predefined thresholds or univariate analysis, our approach leverages unsupervised and supervised learning to dynamically uncover risk patterns using multivariate features.
Implications of the research
The implications of this research for dengue disease pattern analysis, based on the analyzed dataset, are multifaceted and carry significant relevance for public health, epidemiology, and healthcare planning. The key implications include: (1) Early Detection and Intervention: The clustering and classification approaches employed in this research enable the identification of distinct patterns and trends in dengue cases. Early detection of these patterns can be crucial for public health authorities to implement timely interventions. By recognizing high-risk clusters early, authorities can deploy resources, conduct targeted awareness campaigns, and implement preventive measures to curb the spread of dengue. (2) Resource Allocation and Capacity Planning: Understanding the temporal and spatial dynamics of dengue cases, as revealed through the analysis, allows for more effective resource allocation and capacity planning. Health facilities in regions identified as high-risk clusters can be better prepared to handle potential surges in dengue-related admissions, ensuring adequate medical resources, staffing, and treatment facilities are in place. (3) Targeted Public Health Campaigns: The detailed analysis of dengue risk trends over time enables the design of targeted public health campaigns. Authorities can focus on specific months or seasons identified as high-risk periods to educate the public about preventive measures, symptoms, and the importance of seeking medical attention promptly. This targeted approach can enhance public awareness and adherence to preventive practices. (4) Identification of Contributing Factors: The feature importance analysis provides insights into the variables that significantly contribute to dengue risk. This information is instrumental in identifying the contributing factors and understanding their impact on disease transmission. Such knowledge can inform public health policies and interventions, allowing for the development of strategies that address the specific factors influencing dengue outbreaks. (5) Adaptive Strategies for Different Regions: Clustering analysis allows for the identification of distinct patterns in different regions. This regional variation can inform the development of adaptive strategies tailored to the specific characteristics of each cluster. Authorities can implement region-specific interventions, taking into account local environmental, socioeconomic, and healthcare factors that contribute to dengue transmission. (6) Data-Driven Decision Making: The comprehensive analysis presented in this research provides a data-driven foundation for decision-making. Public health officials can rely on the identified patterns and trends to make informed decisions about resource allocation, intervention strategies, and healthcare planning. This shift towards evidence-based decision-making enhances the effectiveness of public health initiatives. (7) Research and Policy Impact: The research findings contribute to a broader understanding of dengue disease patterns and can influence policy formulation. The identified patterns and factors can serve as valuable inputs for future research studies, guiding researchers and policymakers in developing strategies to mitigate the impact of dengue outbreaks.
In summary, the significance of this research lies in its capacity to revolutionize the prevention and monitoring of dengue. By employing a hybrid methodology that seamlessly integrates clustering and classification techniques, the study offers a proactive approach to disease management. The accurate prediction of dengue outbreaks, identification of key risk factors, and establishment of adaptable strategies empower public health authorities with valuable tools for timely interventions. This research not only enhances the precision of dengue surveillance but also provides a versatile framework applicable to diverse geographical regions. Ultimately, the findings contribute to a more effective and data-driven approach to global efforts aimed at preventing and monitoring dengue outbreaks.
Conclusion
This study provides a comprehensive analysis of dengue disease patterns in Bangladesh by employing a hybrid approach that combines unsupervised and supervised techniques. We utilized clustering to identify risk classes from unlabeled data, followed by classification to validate and predict risk levels (low risk vs high risk), offering a hybrid method for risk prediction in data-scarce public health settings. The study also demonstrates the conversion of unlabeled records into a structured and labeled dataset for dengue risk prognosis. The experimental results reveal two optimal clusters or class labels characterized by low inertia and high silhouette scores. Moreover, the supervised learning models—including DT, RF, KNN, and LR—consistently perform well, surpassing 0.99 in accuracy, precision, recall, and F1 scores. The results also highlight the peak season for dengue, emphasizing the months of August to October. Ultimately, this research enhances our understanding of dengue dynamics and provides a reliable tool for disease surveillance and control. Future work will incorporate environmental factors and patient medical records to improve dengue risk prediction.
Footnotes
Acknowledgements
I would like to express my gratitude to the Department of Computer Science and Engineering at Jagannath University for providing us with the necessary laboratory facilities to conduct the research presented in this article.
Ethical considerations
Author contributions
Funding
The author(s) received no financial support for the research, authorship, and/or publication of this article.
Declaration of conflicting interests
The author(s) declared no potential conflicts of interest with respect to the research, authorship, and/or publication of this article.
Data Availability Statement
The datasets used and/or analyzed during the current study will be made available upon request.