
Abstract
Emergency department overcrowding is an increasing issue impacting patients, staff and quality of care, resulting in poor patient and system outcomes. In order to facilitate better management of emergency department resources, a patient admission predictive tool was developed and implemented. Evaluation of the tool’s accuracy and efficacy was complemented with a qualitative component that explicated the experiences of users and its impact upon their management strategies, and is the focus of this article. Semi-structured interviews were conducted with 15 pertinent users, including bed managers, after-hours managers, specialty department heads, nurse unit managers and hospital executives. Analysis realised dynamics of accuracy, facilitating communication and enabling group decision-making. Users generally welcomed the enhanced potential to predict and plan following the incorporation of the patient admission predictive tool into their daily and weekly decision-making processes. They offered astute feedback with regard to their responses when faced with issues of capacity and communication. Participants reported an growing confidence in making informed decisions in a cultural context that is continually moving from reactive to proactive. This information will inform further patient admission predictive tool development specifically and implementation processes generally.
Keywords
Introduction
Emergency department (ED) overcrowding is recognised as an increasing, international problem 1 that results in adverse effects upon patients and staff alike,2 –4 and upon the quality of care delivered.5–8 ED crowding has been linked to staff stress, 1 decreased staff satisfaction and retention, 2 and prolonged inpatient length of stay.2,3 Access block has been linked to increases in ED and hospital length of stay (LoS), ambulance diversion, morbidity and mortality.1,3 By no means, an ED-only issue, ED crowding and subsequent bed block are symptoms of hospital-wide problems moderated by efficacy of patient flow, availability of bed stock, surgery waiting lists and staff allocation. Such issues are, however, outside the ED staff’s control, requiring a whole of hospital management approach. 5 Overcrowding in the ED is a manifestation of an overtaxed health system 6 in which contributory causes can become enculturated as the status quo. This is particularly so in a setting that is both chaotic and unpredictable, such as ED, which is often considered by the community as the doorway to the healthcare system.
Being able to accurately forecast the numbers of patients likely to present and be admitted to hospital via the ED would facilitate patient flow management. 9 In the quest for strategies to address the common mismatch between supply and demand for ED services, we developed a patient admission prediction tool (PAPT). The PAPT technology is the embodiment of a prediction algorithm and data display, enabling historical health data to be used to generate forecasts of future ED and inpatient bed demand. The system uses the data as a basis to forecast patient presentations, admissions and discharges. It identifies data that match the day type (Sunday, Monday, etc., public holidays, days before and after public holidays) in historical data in a 4-week window centred on the day of interest, and forecasts are generated for daily, 4-hourly and hourly time intervals. Users have the ability to generate custom forecasts based on unit speciality (e.g. cardiac, paediatric) and elective/emergency status for any date and forecast horizon of interest. Forecasts are presented graphically in a web-based application as time plots for the current day and for the week ahead, and can also be extracted as text (Figures 1 and 2). With a mean absolute percentage error (MAPE) for daily presentations of approximately 7 per cent; for daily admissions, 11 per cent and for monthly admissions, 2 per cent, 10 the PAPT displays an accuracy that compares well with similar predictive models11–13 which demonstrate MAPEs ranging from 5 to 17 per cent, varying according to technique used, and amount and duration of the test data.
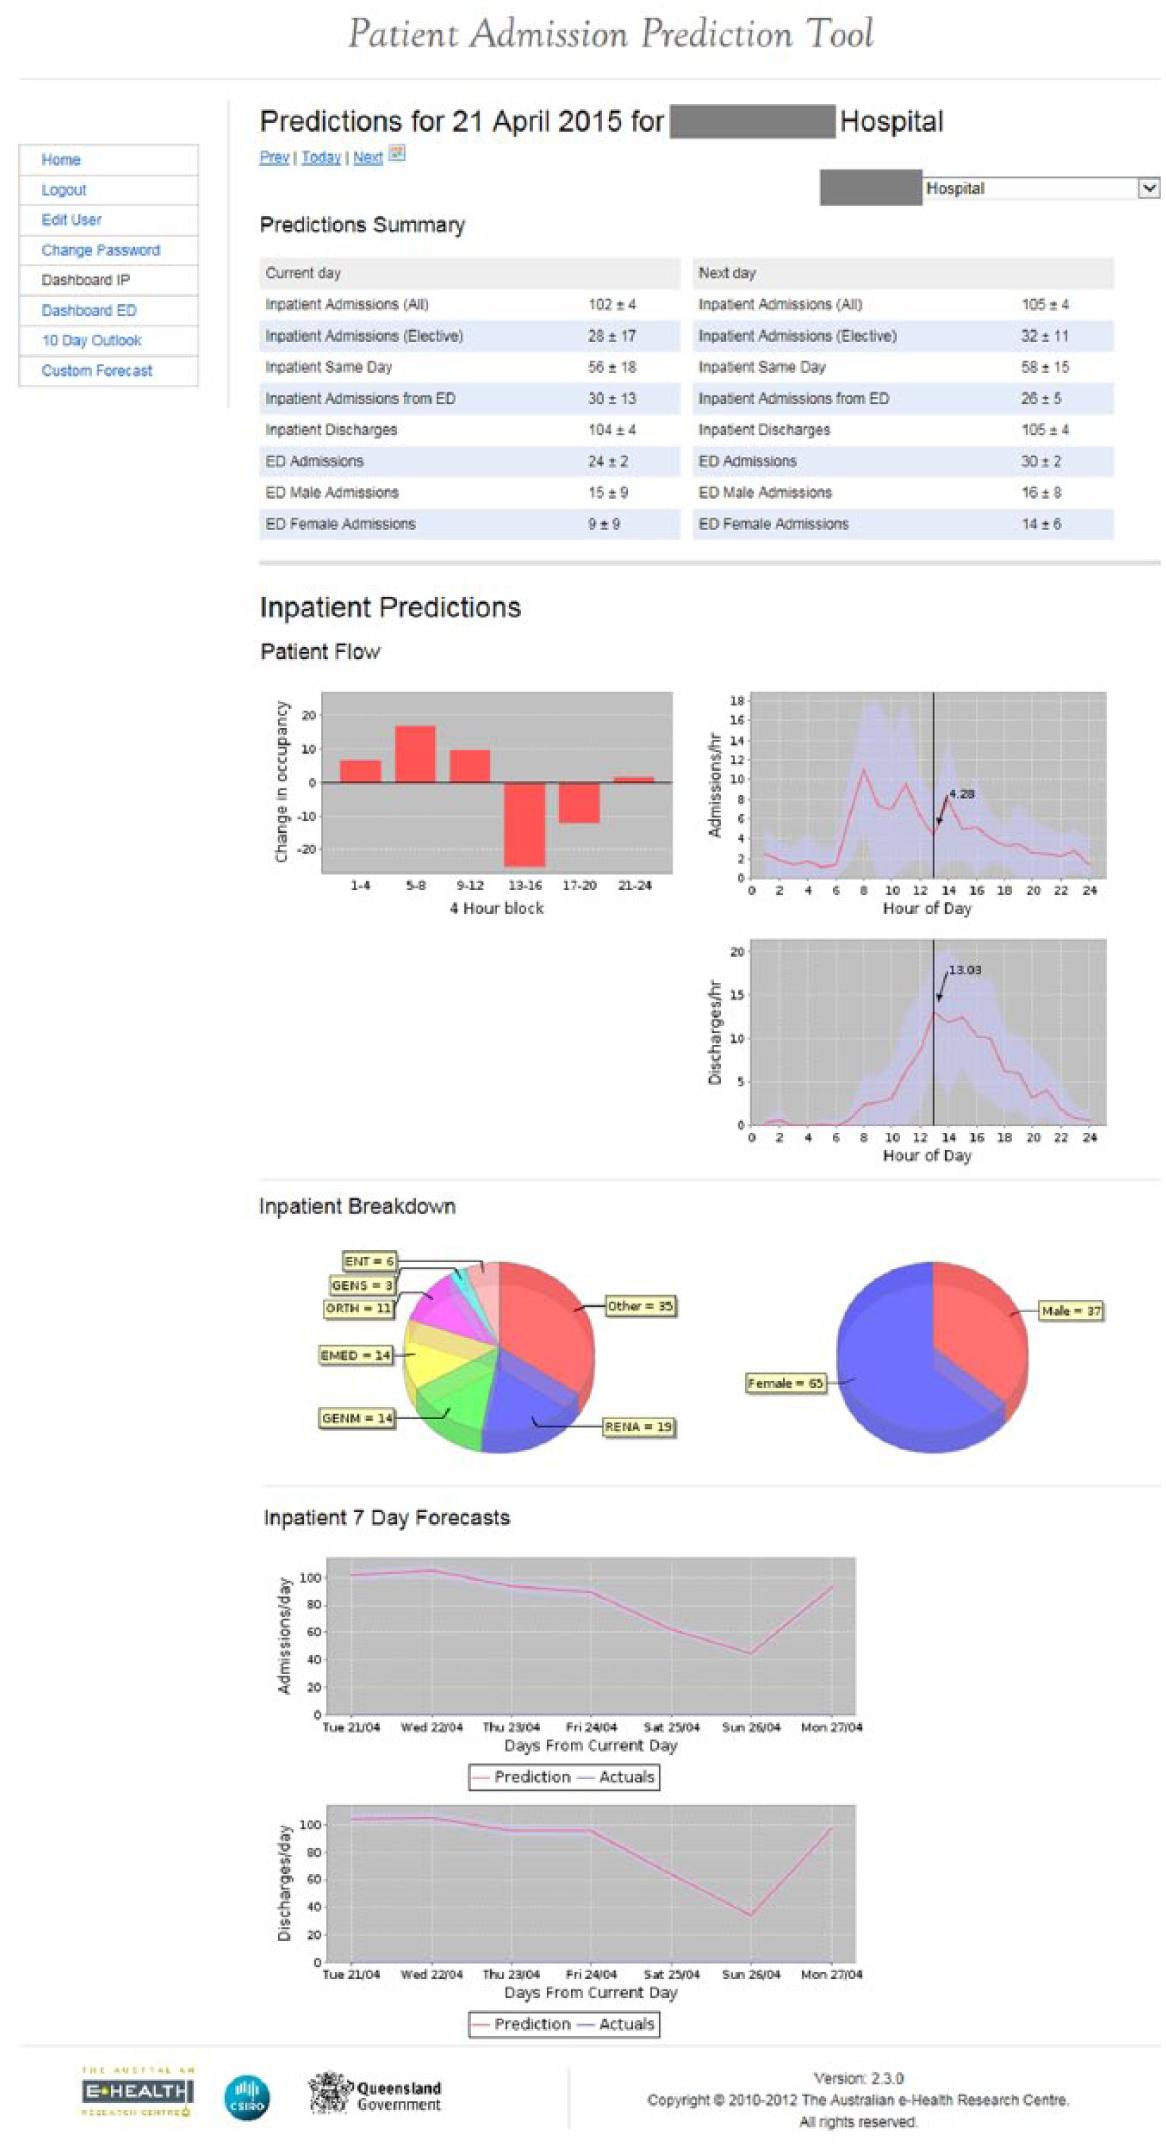
Screenshot of inpatient dashboard, where columns indicate net patient flow (horizontal axis is 4-hourly time blocks across the day; values above the line are net patient admissions, values below are net patient discharges).
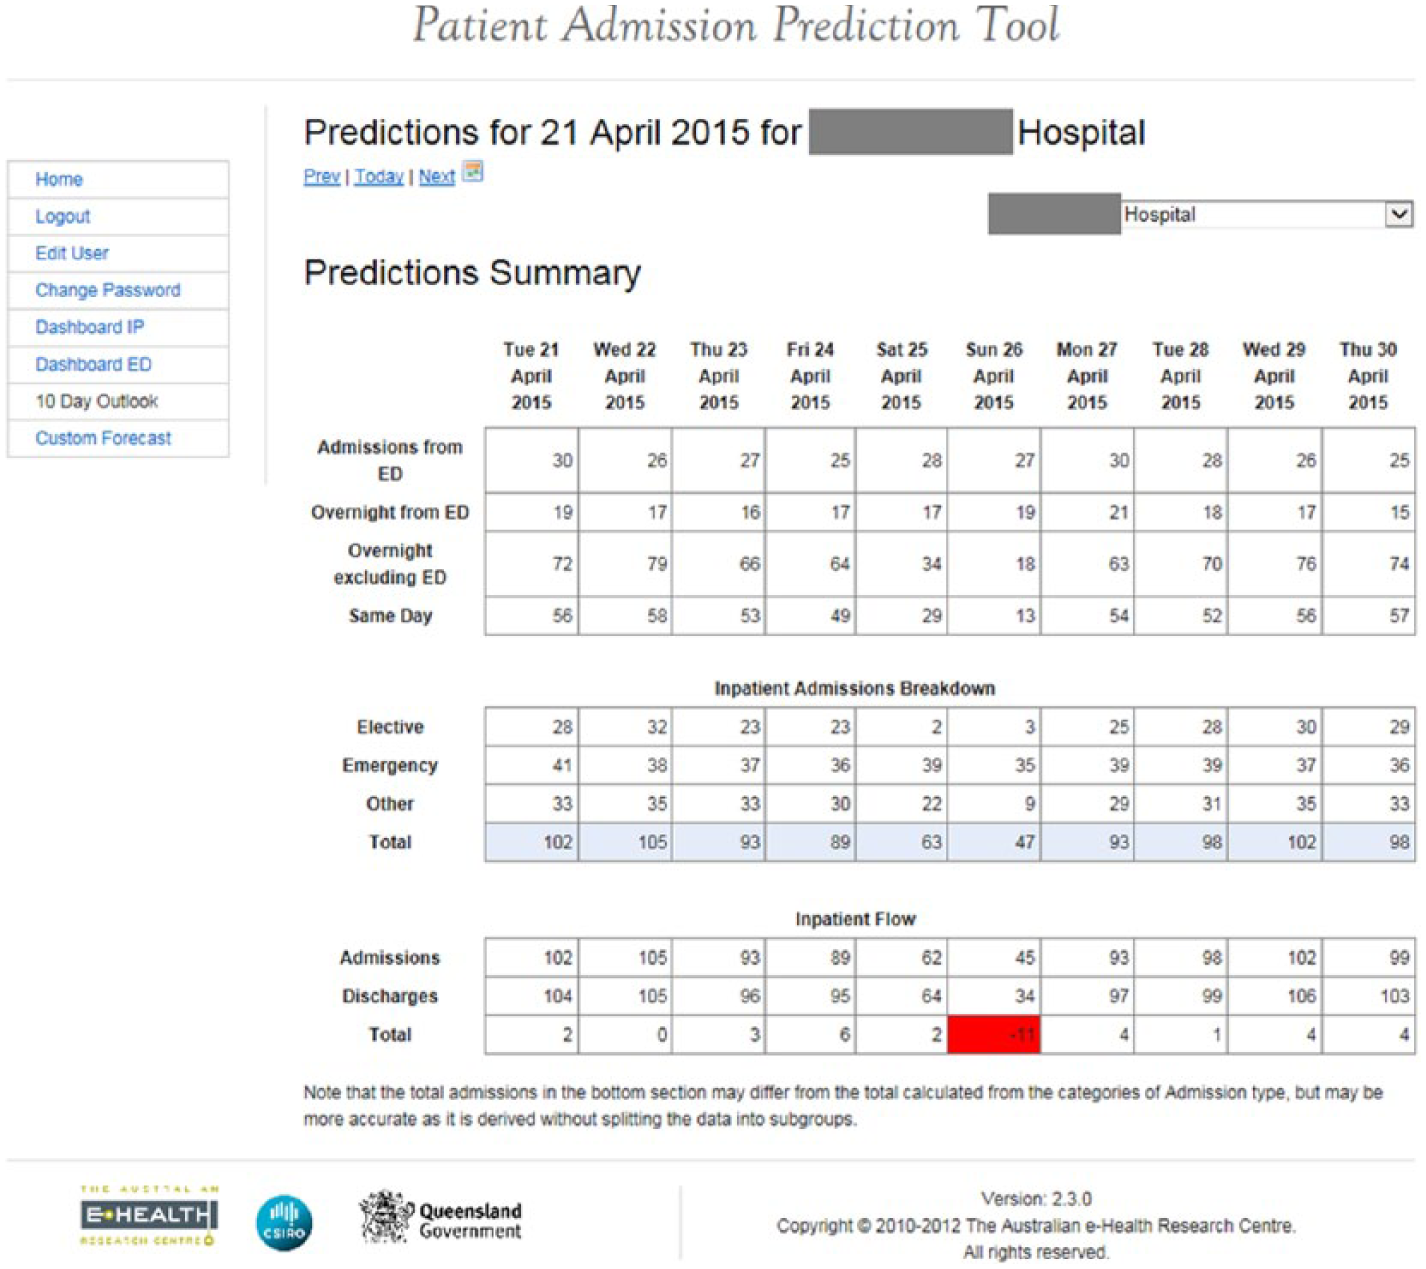
Screenshot of Predicted 10 day outlook, where the bottom line indicates net patient flow.
A user of PAPT can answer a variety of important questions such as ‘What patients are expected through the ED say next Tuesday afternoon from 3 p.m.–4 p.m.?’ Having such information can assist those dealing with bed allocation and staffing resources, and facilitates efficient patient flow. 10
While there has been an increased use of information communication technology (ICT) to augment patient care, there have also been concomitant unforeseen challenges in its incorporation into an increasingly convoluted environment.14–16 The issue of user engagement, for example, is increasingly recognised as being integral to any innovative implementation process; however, it is often neglected and challenging to elicit. 17 Ojiako and Maguire 18 advocate a process that is a balance between the delivery of an innovative service or product and user concordance, imbued with an awareness that unidirectional communication may be masquerading as a consultative process. They recommend that any increase in time be invested in the process plan rather than in product production to ensure an efficacious uptake.
Often in the attempt to find solutions, the technological side of a programme can run ahead of its social one. Harrop et al. 17 write of the imperative for an ICT solution to flow with the rhythm of its users’ work, its full functionality being reliant on its being embedded in their cultural and clinical milieu, with those designing these solutions needing to be cognisant of that environment. Such an approach to system design will be adopted by those who take an overall view of the organisation as a living, evolving system 19 in which parts make up a rigorous whole. This dynamic is fostered through a sense of partnership and interprofessional dialogue. Thus, rather than defaulting to the propensity to focus on personnel issues as a cursor for maladapted innovations, system developers should work with potential users. Failure to understand and harness the humanness of the cultural context can foster failed implementation. 20 Coiera and Hovenga 21 warn that ICT implementation can run ahead of the intended users, and recommend it be integrated with existing daily workflows.
Prior to the development of PAPT, potential users contributed to the initial consultations that informed and moderated the process. 22 Pre-requisites requested by end-users included availability, reliability and relevance via a process of implementation that ensured PAPT was incorporated, validated, defined and timely. They described their current context as one of latent crisis in which cancellations of elective surgery and communication within such strategic negotiations were troubling issues to participants. With this basis elucidated, participants then proceeded to depict their expectations of a predictive tool and its potential for impacting efficiency and forward planning, delivering an overall organisational view with suggested strategies based around these factors of availability, reliability and relevance. A number of participants volunteered advice for implementation of the novel solution into practice. For several, this was almost with a sense of pleading, having experienced previous ill-advised ‘dump and run’ implementations. Thus, ‘appropriate, effective initial launch, stepwise introduction, utilisation of clinician colleagues, and ample instructions for use’ 22 (p. 313) were considered imperative to the Tool’s receptivity. Participants also informed the context into which the PAPT would be implemented, trialled and subsequently evaluated.
Following the 12 months of implementation, the utility of the Tool was evaluated at two study sites by:
A quantitative, multi-site prospective, comparative (before and after) evaluation of the Tool’s impact on patient flow
A qualitative consultation that utilised semi-structured interviews with users of the Tool: as presented in this article
While the quantitative evaluation demonstrated that embedding a PAPT in patient flow management processes benefited bed and staff management, it was equally important to identify how those users had integrated it into practice. Consequently, the final qualitative consultative process has meant a more comprehensive evaluation of the Tool’s efficacy by delivering insight into the communication and strategies that evolved.
The research questions that guided this part of the evaluation processes were: Given the almost prescriptive nature of the initial participants’ requiremnts and recommendations, how did PAPT and its implementation process meet their requirements and expectations, and how did they incorporate it into practice?
Method
This qualitative component of the evaluation was executed utilising a Naturalistic Inquiry. 23 Given that the aim was to evaluate the efficacy of PAPT from the users’ perspectives, a qualitative descriptive methodology was clearly indicated to explore and elucidate both the experience of the participants and the social environment in which they and PAPT operate. This method not only delivered the requisite insight but also continued to foster the sense of involvement and ownership in the project that had been initiated in the preliminary consultations. 22 Thematic content analysis of the data utilising Van Manen’s 24 phenomenological framework of analysis was employed in order to consider the consensus of issues and patterns of disparity in the responses of the different informants.
Setting
The study sites were two hospitals in South East Queensland, Australia, having diverse demographics. Hospital A is one of the busiest EDs in Queensland, situated among one other public and three private hospitals (with EDs) that together service a large itinerant and tourist population (~514,000). The contrasting regional site, Hospital B, caters for a conversely stable population (~155,000), which is also served by one other private hospital (with ED). Both facilities see and treat children and adults. Hospital A has an annual ED census of approximately 65,000 and Hospital B 50,000.
Participants
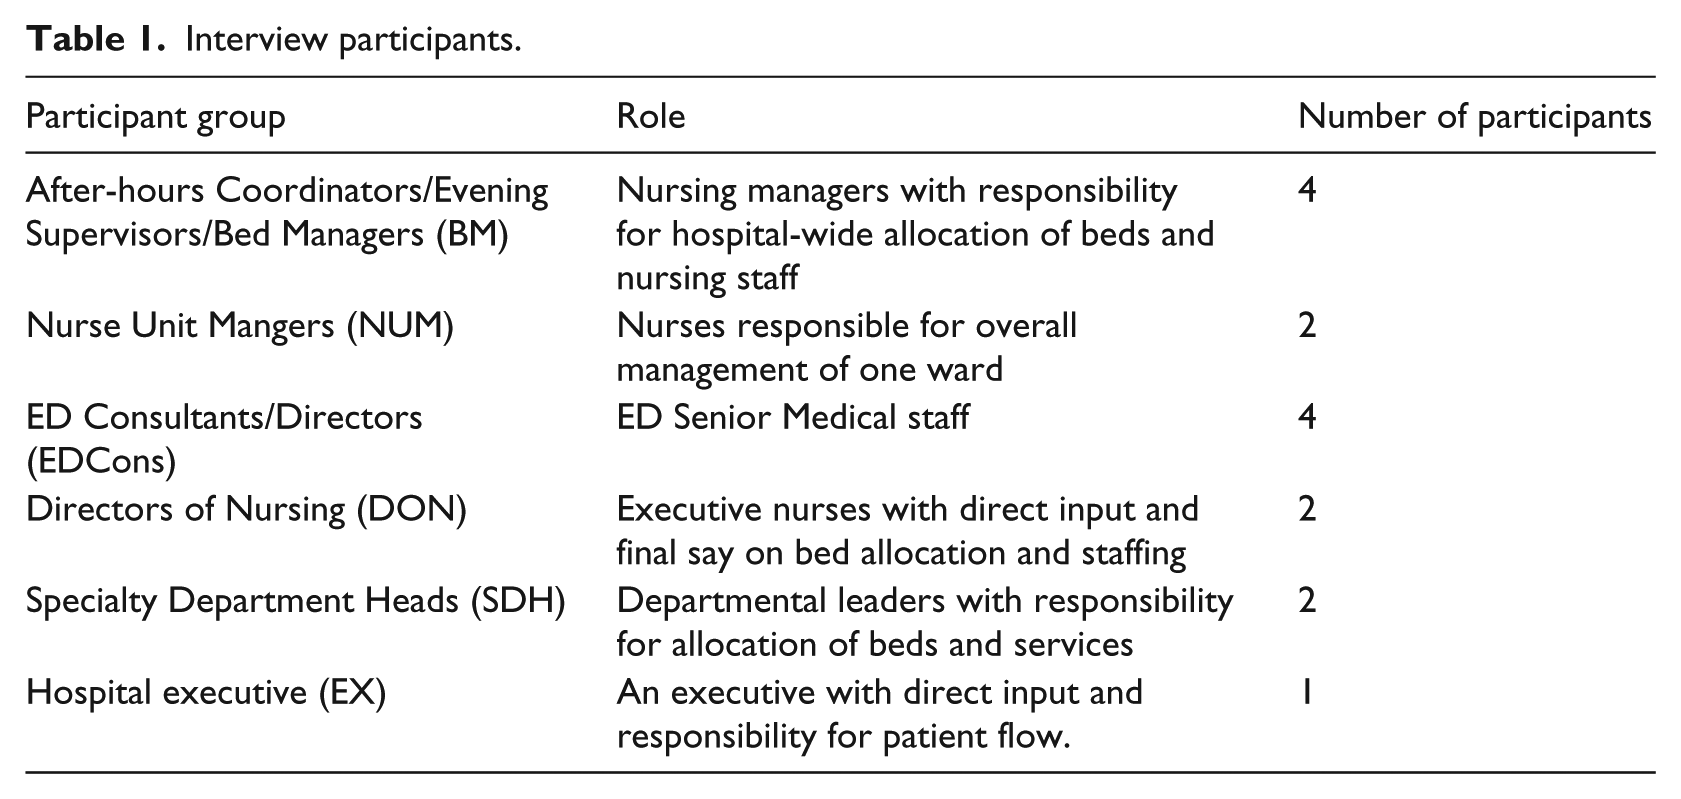
Fifteen participants (Table 1) were purposively selected according to their use of PAPT and their organisational role, which paralleled the participants in the pre-development user consultations 22 in which participants were ‘purposively selected in order to build a comprehensive depiction of the situation under examination and to achieve maximum variation’ (p. 308). They included four after-hours Coordinators/Evening Supervisors/Bed Managers (BM), two Nurse Unit Mangers (NUM), four ED Consultants/Directors (EDCons), two Directors of Nursing (DON), two Specialty Department Heads (SDH) and one Hospital executive (EX).
Interview participants.
Ethical considerations
Ethical approval for the study was obtained from the Human Research Ethics Committees of the participating hospitals and the authors’ universities.
Design data collection
Staff had to meet the following inclusion criteria to be invited to participate in the study: working at one of the evaluation sites in either bed management, or as a clinical department director or executive role during the evaluation period. The study team identified 15 potential participants who were contacted via an email that included an attached Information Sheet and Consent Form. This was followed up by a subsequent email to arrange a convenient time for interview.
Data collection was via semi-structured, conversational style, audio-recorded individual interviews. This rendered greater flexibility and availability than focus groups in a cohort of participants who would be difficult to co-ordinate to be in the same place at the same time.
The semi-structured interviews featured questions around the issues of the users’:
Initial response when asked about the Tool
Observations of impact on system processes or work
Barriers to its use, such as perceived inaccuracies, or a preference to rely on one’s own judgment
Comments on features such as: content, accuracy, format, ease of use or timeliness
Data analysis
Participants and their workplace were de-identified by the use of pseudonyms. The audio recordings of the interviews were transcribed verbatim, and analysed by thematic content analysis according to Van Manen’s 24 framework. Thus, the transcripts were read and reread in light of the research question to synthesise common topics and to disclose the recurrent themes. These were grouped together to reveal the overarching themes.
Results
Initial response
By asking the participants what came to mind when first mentioning the Tool, the interviewer aimed to capture their initial response, a first impression giving a sense of the value and utility with which they endowed it. Such statements revealed a variety of comments infused with enthusiasm, reticence or, in one case, frustration. However, this BM’s was a fairly typical response: Well, I guess … yeah, it conjures up thoughts to me of a good thing. Something that we need, and something that we obviously need to continue to develop…a bit of a guide rather than a definitive decision making tool. So it’s sort of like a bit of an indicator for me. (BM1)
Analysis of the participants’ responses revealed themes of facilitating communication, enabling group decision-making and accuracy. These will now be discussed.
Facilitating communication
Participants alluded to a sense of awareness, first, as a consciousness of the Tool itself, which reportedly extended to all organisational levels, including the fact that ‘there wouldn’t be a member of the executive who wouldn’t know what PAPT is, which I think is probably pretty significant’ (EX1). Meanwhile, for several others, the Tool signified awareness of the current and impending hospital situation of ED crowding and bed status to which it rendered insight. One DON nominated it as ‘an awareness flag for me’ (DON1), which was at times a red flag of warning and at others a lifesavers’ ensign of red and yellow. Another participant expressed, ‘Now it’s just another thing to tell me how bad it’s gonna be. So we’ve got an idea of the lay of the land’ (BM1), and the stark reality.
A natural progression for those who were thus aware of the predicted numbers was the notion of their now being connected both to the system and to others. This was facilitated by the resultant network of communication that evolved through the novel bringing together of people as they accessed the Tool and then communicated regarding its predictions. This saw people who were not always in contact now focussed and speaking: ‘Actually it’s done a huge amount. It’s brought people together looking at something together, which helps everybody head towards the same goal. It’s focussed people. Lot of different people that wouldn’t necessarily have got together’ (BM3).
Thus connected, they could then focus on the current status of patient numbers and beds. As a result, they could proceed to formulate group decisions as they ‘discussed how you were going to manage the situation’ (BM2) in a potential two-way communication wherein there is both the receiving and supplying of information. From a management point of view, this is seen as ‘providing that information in a way that assists management to understand our demand, with a view to smoothing some of that capacity’ (EX1).
Enabling group decision-making
Thus informed, management can be Putting in place some responsive strategies to mitigate the risk arising from a mismatch between demand and supply. On a weekly basis in terms of flow. And then on a more, on a less regular basis looking at using PAPT for predicting triggers for some additional flow strategy such as for winter. (EX1)
While being connected means a variety of expansive views for those in management, for those closer to the coalface and dealing on an hour-by-hour basis, the generation of weekly predictions can seem enough to deal with: ‘I use it usually on a weekly basis. Print off usually at the start of the week, and have a look at what’s predicted for that week’ (BM2), the perception of these print-offs being seen as shorter by some, but a week seeming a long time for others who were juggling hourly.
Whatever the timeframe, it is within this context of established connection and communication that one respondent revealed his resultant confidence to then ask for help: ‘The Tool’s given me an option to put the data out there to all the executives and NUMs and say: Look, this is what the day looks like. Help me if you can’ (BM4).
Thus, attuned to the system, they attuned to each other.
Investing the Tool with more qualities than just prediction, significant though that might be, several respondents had observed features that they had not envisaged. Beyond the anticipated finite ICT qualities, participants spoke of personal and social spinoffs from a Tool that seemingly enhanced self, systemic and social flow. For one BM came the personal assurance that ‘It’s given me a voice’ (BM2), a particularly empowering comment in view of the previous system in which BMs reported feeling isolated, unsupported and responsible for decisions without a commensurate sense of authority. 22
Accuracy
It was noteworthy that discussion around accuracy of numbers and confidence varied: ‘There would be some days that they’d say: “Oh it’s pretty accurate today”. And other days that just was off the mark’ (BM3). However, confidence did not appear to be diminished as a result. It would seem that the connections around the Tool combined with its placement alongside other systems rendered an acceptable confidence level with most participants who were not dismissive, but accommodating: ‘I think it is quite accurate. Often the days when it does show that we’re going to be quite busy and difficult, they invariably are’ (BM4).
This issue was further enunciated by one DON as being ‘just another source of information’ reminiscent of the weather: If the weather forecast says it’s going to be huge storms tomorrow, I’ll act more definitively on that information. If I get a PAPT report I will search for a whole lot of other sources of information to confirm what PAPT might be saying. So I don’t give PAPT the same level of confidence that I do in the weather station, mainly because the weather station report’s had years of experience and lots of resources supporting it and I can rely on its predictive tools better than I can on PAPT … because PAPT is still a developing system. So I use it as a flag, but I will seek other sources of information before I make a choice or a decision. (DON1)
It was this incorporation of the Tool with ‘other sources of information’ (DON1) in the DADS [daily admissions and discharges report] and WADS [weekly admissions and discharges report] reports that rendered confidence and utility for the managers and decision-makers in this study. They realised that ‘If you could come up with a thing that is 100 per cent accurate, you wouldn’t have to work another day in your life. Sell it. You could also pick the lotto numbers’ (BM3).
Assurance for several participants went beyond confidence in numerical accuracy, albeit an assumed and essential commodity. It was further derived from the initial communication with others, expressed by this Patient Flow Manager: But then if I look at that week or fortnightly planner and see something there that doesn’t look right, then I’m listening out for who is doing what, who is reacting or responding to that. And just being self-assured that someone’s worrying about it. (BM4)
And possibly confidence is a matter of trusting those who are smarter. One participant was not so sure that the numbers do not lie, but he assumed he could trust the people who had delivered the Tool to him: ‘And maybe confidence is just because they’re smart. I don’t know how they factor that in, but surely – they’re smart people’ (NUM1).
Proactive
As interviewees moved on from their deliberations over accuracy, it was often with visible zeal that they then discussed the actions that they could initiate in response to the Tool’s latest predictions, combined with their feelings of being assured and of having communicated with others. This process is moderated by the confidence placed first in the Tool itself and second in the people trusted to be responding to such directives. That that response could be thus ‘more proactive rather than reactive’ (BM3) was a key characteristic desired and extolled by many participants: ‘The big improvement there is that you were actually pre warning people and not really pinging them off at the last minute … proactive staffing, management about booking’ (BM3).
One medical officer conveyed his confidence in the accuracy of the Tool and on the power of the proactive response: There’s three or four days where it’s saying it’s going to be negative and bad, we can use that data to implement strategies to maybe lessen it. Put an extra bed cleaner on to help the flow of patients getting through. Notify doctors early that this day, we’re going to need discharges so be prepared to get in early and do your rounds and scripts so that we don’t get bed block. So from that point of view it’s fantastic that we can look at it and go: ‘Oh great, we’re going to be short on these three days’. Let’s do something now, rather than waiting to see how we go. (ED Cons 1)
The hospital executives charged with the responsibility of the overall view appreciated the ‘intelligence, as distinct from data’ (EX1), and being able to ‘Take the previous, make it the future’ (EX1). Thus prepared, they convened a long-term predictive planning meeting: ‘We look at the PAP Tool and the trends over the week, the days that we’re going to be short, and try and put strategies in place to manage that, in the long term’ (EX1).
Anticipation of both the facilitating and the long-term aspects of the Tool were considered ‘handy’ by one BM in being able to ‘look 10 days ahead and see what your estimated flow through ED would be, and then look at your elective bookings and modify them to be capable to take the day cases rather than manipulate the admissions’ (BM4), handy in this instance spoke of being commonplace, at hand and used frequently.
However, in some cases, despite best intentions: The reality is that you can’t always achieve that. You can have the data that shows you you’re gonna be in the shit, but if nothing happens you just sail into it. The challenge is to act ahead of time. (BM4)
Even with the defined objective of seeking to be proactive, some participants found this change in focus and manner of service delivery was hampered by colleagues whose reactive response was actually to remain safe, and for them that secure juncture was where ‘predictable’ fitted their vocabulary. ‘It’s very much fire fighting’, lamented one bed manager (BM2). All the predictions in the world will not fix a system wherein some players still preferred to ‘rather be knee jerk than proactive’ (BM2).
Implementation
It is appropriate at this stage to consider the implementation process via consultation, collaboration and leadership, and particularly the human factors therein.
How it has played out in this instance, from the view of these participants, displays a progression of commitment, champion and culture.
Commitment
There has been an implicit sense of ownership of the Tool and participation in the evaluative process, which, as far as the interviews went, saw respondents making scant time readily available and being prepared with aforethought. This was probably a response to the initial user consultations which engendered an early foundational sense of ownership by inclusion. We gave it to them at the start, not at the finish. Implementation – like patient discharge – would seem to be a process that is optimally instigated at the beginning. Maintenance of the research field and the participants in particular has involved a deliberate two-way exchange leaving entrée for subsequent iterations and implementations.
Early-engaged users have likewise gone through their own process: from initially being intrigued by the concept and interested in the Tool’s development, contributing to its formulation, to being well acquainted with it and keen to offer feedback in the form of critique and suggestions. Generally, they were supportive in seeing it go from experimental to utilitarian.
Champion
Clearly a key strategy in the implementation process, confirmed in the feedback, has been the designating of onsite champions. They were spoken of with noticeable regularity particularly by participants at one of the sites with sentiments such as ‘She’s [the champion] doing a very good job getting it off the ground, communicating the idea behind the Tool and how we could apply it’ (SDH1).
Having a tangible presence of a champion who could respond to queries on the spot with explanations, who could encourage participation and, importantly, who is a familiar face evoked the sense of partnership in a greater way: ‘A lot of people who are difficult to get on board, she probably had a lot of difficult conversations around that’ (BM4).
However, undoubtedly, a carefully metered withdrawal of the champion’s role is advisable in order to maintain momentum because: When she tried to draw back from the meeting to allow other people to pick up the momentum, the further back she stepped, the more momentum it lost. No ideas were coming out of it. And those that were put forward weren’t enacted. (BM3)
This may have been a loss of momentum or conversely an incorporation of the Tool into the system in a different way. It may possibly have been a transitional time where users assumed the responsibility for themselves and utilised the Tool in an increasingly covert manner that no longer required the previous meeting format that had evidently run its course.
Culture
Considering the unforeseen weight given to cultural context pre-Tool development, it should be no surprise that the discourse around such issues would continue into the subsequent reflective interviews feedback. On the question of culture, the interviews rendered new insights into the cultural context in which the Tool was implemented, one in which users spoke of ‘those higher up’. The vantage point from up there presented the necessity for, and expectation of, the most accurate overall view. Knowledge and information in a system in which ‘all of the execs have heard of it’ (EX1) certainly facilitated the incorporation of the Tool. While all levels/departments were working towards the same goal of efficacious patient flow and efficient use of available resources (staff, beds, etc.), it was in the practicalities of modus operandi that misinterpretation ensued and common goals sometimes eluded.
This was exemplified at one of the sites in the strategy of the executive walk round. By no means a promenade nor meet-and-greet, it was, on the one hand, viewed as follows by the executives who instigated it as proactive and positive: Implemented in response to a crisis point, but there started to be some backlash. I was hearing from team members that every time they would see executive would be in this negative, punitive … ‘You’re hiding beds’. We’d never say that, but that’s why I moved toward a weekly meeting with the executive and the nursing directors where we’d use the PAPT information with the DADs [daily admissions and discharges report] to say, well actually, let’s not wait until Friday. Let’s have a look at what we’re likely to be experiencing over the next seven days and put in place some proactive strategies to deal with it. (EX1)
But at another level, the walk round was interpreted as: Intimidating for staff on the wards. You get a bunch of executives walking around. Sometimes they listen to what the staff are saying … They get back and report there’s five beds on this ward …Well there’s not five beds ready. There’s five beds coming up. They look: Why’s that bed empty there? Well that patient’s down having x-ray. Who’s the person sitting in the chair next to it? It’s an intimidation process. Doesn’t build any bridges, let’s say that. (BM1)
Misinterpretation seemed also to extend to the actual availability of beds, their visual status not always being an accurate interpretation. Bridging that institutional divide of personnel levels can commonly be fraught with diffidence and distrust on all levels. It can uncover the messy interface where goals may be common but expectations and abilities might not. The Tool reportedly brought together people who were usually operationally disparate, facilitating further dialogue that rendered a looking together with, rather than at, the other. The Tool can predict numbers and alerts for impending overload, but the reaction to that will always require engagement in a human interaction.
Response to patient flow can call for a change in one’s professional practice, or, conversely, the examination of the practice of others. Such was the notion expressed by one executive that the use of the Tool ‘for nursing is viewed as an opt in’ (EX1), while for this BM: Medical doctors just go: ‘Yeah, right’. Registrars and residents won’t discharge anyone until the consultant said yes or no. Depends on what time they come in the day. It’s a big issue. Surgical, they generally get rid of all their patients early in the morning, because if they don’t get rid of patients, they don’t get theatre time. (BM1)
This was a question of compliance and culture.
Comments – on features such as content, accuracy, format, ease of use or timeliness
An important component in ICT evaluation is users’ interaction with the interface. Participants had varying preferences, some favouring the numerical readouts, while others had a penchant for pie charts. Generally ease of access for those utilising the Tool in the online form was positive. One exception to this was the BM for whom computer access was obviously a challenge and an interaction that did not come with ease: ‘I have trouble with my typing’ (BM1). For this user, as for others, the incorporation of the Tool’s predictions into the reports of DADs and WADs has delivered the information in a timely and functional format, being integrated with other strategic information to deliver a whole-of-system view.
Accurateness and confidence are usually considered finite. However, users had often negotiated their own level of confidence by balancing the Tool’s predictions with their own judgement born of past experience with numbers displayed in interacting operating systems, thus placing the Tool within the cache of instruments at their disposal.
Discussion
The concepts of accuracy and reliability were touted as vital in the original consultations 22 pre-Tool development. They have been enhanced by further features that neither participants nor researchers envisaged: those somewhat esoteric qualities of having a voice, a flag to raise and a feeling of being heard within a group of people who have been brought together assembled to consider the latest predictions.
Given the influence exerted by context upon successful implementation, this has necessitated negotiation of the Tool’s place within the organisation. This process has been enhanced by uptake at all organisational levels, facilitated by the dialogue between those levels, as participants have conferred. The fact that misunderstanding can occur such as described about executive workarounds reveals the potential pitfalls that may not always be anticipated but can become points for reconsideration in an evolving context.
The role of leadership in any implementation is emphasised in the literature and certainly featured in this study. Although subject to misconnection and assumption of intent on occasion, the outworking has been a reported drawing together and dialogue to achieve a common goal of efficient patient flow, a strategic outcome in this study given that, according to Wikstrom and Dellve, 25 ‘discourse and strategic communication provide the framework for leadership–employee interaction’, while Pines et al. 15 invest leaders with the critical power to make or break an implementation altogether.
There is the valid assumption that all the users wished to see the utopian smooth flow of patients through a system that is maximising its resources. How users perceived their role within that system that modified their engagement on a continuum from a business-as-usual reactive stance to a proactive one born of not only seeing the numbers, but having made connections with others, attuned and felt confident and assured to take action.
While user engagement can be difficult to garner, 17 by involving potential users throughout, and specifically via in-depth, personal consultations at the initial phase and completing that cycle with seeking their feedback at the end, we have utilised this methodology to be privy to the contextual factors such as interpersonal networks and expectations, qualities that can both directly influence the uptake of a new intervention and indeed be predictors of the efficacy of that process. 26
Hospitals and public health agencies are in need of tools to efficiently and effectively allocate resources to manage operations. Patient information systems now contain millions of captured patient records. Innovative analysis of this presents significant big data challenges but offers the opportunity to deliver enhanced patient flow and operational benefits to the process. Real time prediction of demand for hospital beds may be made possible by leveraging information contained in these datasets.
In this current milieu of technological imperative and pursuit of all things ICT, quantified and digitised, there still remains the necessary human factor of the one who initiates and drives and interacts with it. This is the user for whom the notion of a ‘crystal ball’ (NUM1) at times may be equally appealing, and who possibly supersedes such Tools and ICT programmes by virtue of being the go-between who has the ultimate choice to use or not. They are invested with unmeasurable yet observable intuition, whereby the certainty of numbers are first examined in philosophical debate regarding their finiteness and, second, subconsciously incorporated as a springboard into intuitive levels of practice. 27
Strengths and limitations
A key strength of this project is the process by which we engaged users in both the development and evaluation of PAPT. As a result, this article gives candid insider feedback on PAPT efficacy that is complementary to the quantitative evaluation, rather than the observations of an outsider. By way of limitations, the study involved a small sample of 15 participants who work in the health service of one Australian state. Furthermore, evaluation was undertaken at two sites within that health service, with its distinctive parameters, so generalisation of results to other locations cannot be assumed. However, the sites were expressly chosen due to their contrasting geographic and staffing characteristics, allowing for evaluation of PAPT utilisation in these two diverse settings.
Further research is indicated to establish whether the findings are applicable to other settings beyond the study sites (such as rural or remote) and the Australian context. A logical progression would be the trial of PAPT in similar healthcare systems having comparable modus operandi, targets and financial imperatives, such as the United Kingdom. 17 Additional research to identify frequency of use by users who have had the Tool made available and to determine how users utilise predictive bed information in their daily operations would serve to enhance the current dialogue on ED crowding and patient flow.
Conclusion
Participants in this study found a voice, drew upon the finite numbers of the Predictive Tool, enmeshing them in their evolving interpersonal networks. They have delivered feedback that will inform subsequent Tool refinement and, as a consequence, potentially impact clinical practice as a result of enhanced system flow and delivery of more efficacious patent care. Participants also revealed the necessity of effective consultation, collaboration and leadership in the not always exacting science of implementation and practice innovation. Their ongoing investment was summed up by one participant: ‘The biggest question I have was around the evaluation, and I’d be interested, just very interested in seeing that information’ (BM1).
Footnotes
Declaration of conflicting interests
The author(s) declared no potential conflicts of interest with respect to the research, authorship, and/or publication of this article.
Funding
The author(s) disclosed receipt of the following financial support for the research, authorship, and/or publication of this article: This study was partially supported by a grant from the Queensland Emergency Medicine Research Foundation.