
Abstract
Issues in epidemiology are truly multidisciplinary, requiring knowledge from diverse disciplines such as sociology, medicine, biology, geography and information science. Such inherent complexity has led to a challenge in developing decision support systems for epidemic information management, especially when data are from heterogeneous origins. In order to achieve a solution, an integrative framework is proposed. The Semantic Web is introduced in the context of enriching meaningful and machine-readable descriptions of epidemiological data. Software agents are utilised to achieve automation in semantic discovery, composition of data and process services. The objective is to enhance the performance in information retrieval in a dynamic decision-making environment while concealing technical complexity from inexperienced users. We illustrate how a prototype system can be developed by considering an epidemiology management scenario in which spatio-temporal analysis is undertaken of a specified epidemic.
Keywords
Introduction
Environmental epidemiology is concerned with the spatio-temporal dynamics of epidemics.1–3 Such studies can provide preventive strategies for decision-makers by revealing key determinants underpinning the spatial and temporal patterns of an epidemic. Spatial decision support systems (SDSS) have become increasingly important in the management of risk in such domains. 4 SDSS can be defined as software programmes that seek to assist decision-makers in the generation and evaluation of alternate solutions to spatial problems through the integration of spatial data and geo-processing models. 5 Their popularity has in part been driven by the ease of use of commercial geographical information systems (GIS) and their increasing functionality. The better management of epidemiological information generally requires systems capable of managing spatio-temporal data.6–11 While the benefit and utility of SDSSs are well known, two problems have hindered their more widespread use in health risk management. First, current methods for epidemiology are complex and are used by relatively few technical experts. 12 This problem arises from a lack of familiarity of geospatial techniques among decision-makers. 13 Essentially health decision-makers want SDSS to provide strategic information without having to learn the technical details of the system. 14 Second, discovering data and processes (or models) capable of supporting the anticipated analysis requires us to address significant interoperability issues. 15 Epidemiological applications are made complex because they often involve many sub-tasks which require diverse types of data (e.g. on different types of diseases, from different publishers and in different formats) and processing (e.g. data conversion, analysis and mechanism-based modelling).16,17 They rarely comply with any standards and lack detailed description of both the data and the functionalities and parameter requirements of the processes. This results in a general inability for one dataset or process to interoperate with another.
In this article, we propose a Multi-Agent-based, SEmantic-driven (MASE) approach to help ameliorate the problems outlined above. As to the first problem, a multi-agent approach is ideal for concealing technical complexity from inexperienced users. In a multi-agent-based system, agents are autonomous and can engage in flexible interactions. Autonomy means that they are able to decide for themselves when and which actions they should perform. This enables them to modify the modelling environment without human intervention.16,17 Flexibility in interaction means that agents can make decisions at run time rather than design time, so that they can respond to changes in their environment. 18 As to the second problem, the Semantic Web technologies provide novel approaches to sharing and integrating geospatial data from different service providers. 19 Within the Semantic Web framework, ontologies are used to help represent the conceptualisations underpinning the data and processes. They enable a formal and logical view of knowledge by using a set of shared and explicit vocabularies. When using ontologies to describe data or processes, the semantics of their contents (i.e. metadata and process functionality) become machine readable and understandable. 20
In the remainder of the article, we start by illustrating a sample case that uses MASE to support decision-making in environmental epidemiology management. Then, the development of a prototype system is detailed, including the workflow design for the software system and the ontology base construction that provided the semantic support. Finally, after testing the system with two scenarios, the results are presented and critiqued.
An example use case
Consider a scenario in which a government officer wants to analyse last year’s outbreak of dengue fever, hoping that the analysis will provide information of the epidemic’s spatial and temporal patterns or clusters. Such analysis can be used to help decision-makers allocate funds and resources for the coming years. The officer may have limited knowledge of relevant spatio-temporal analysis techniques and therefore seek the services of a GIS consultant. The consultant will undertake the analysis having first ascertained the availability of data and software. The available data may need to be converted into appropriate formats suitable for the intended software. In this instance, let us suppose that the following data (Table 1) and processes (Table 2) are available in a web accessible registry. After obtaining these suggestions from the GIS consultant, the officer may encounter the following problems or inconveniences: (1) he or she would have to repeat the search procedure to locate required processes (models) and data, (2) the keyword-based search may either miss the required information or retrieve large amounts of data that have little relevance, (3) the poor descriptions of data and processes would make it difficult for the officer to comprehend and select appropriate data, (4) the retrieved data may not be in an acceptable data format and (5) the officer would not know how many future data conversions are needed prior to data analysis.
Data details.
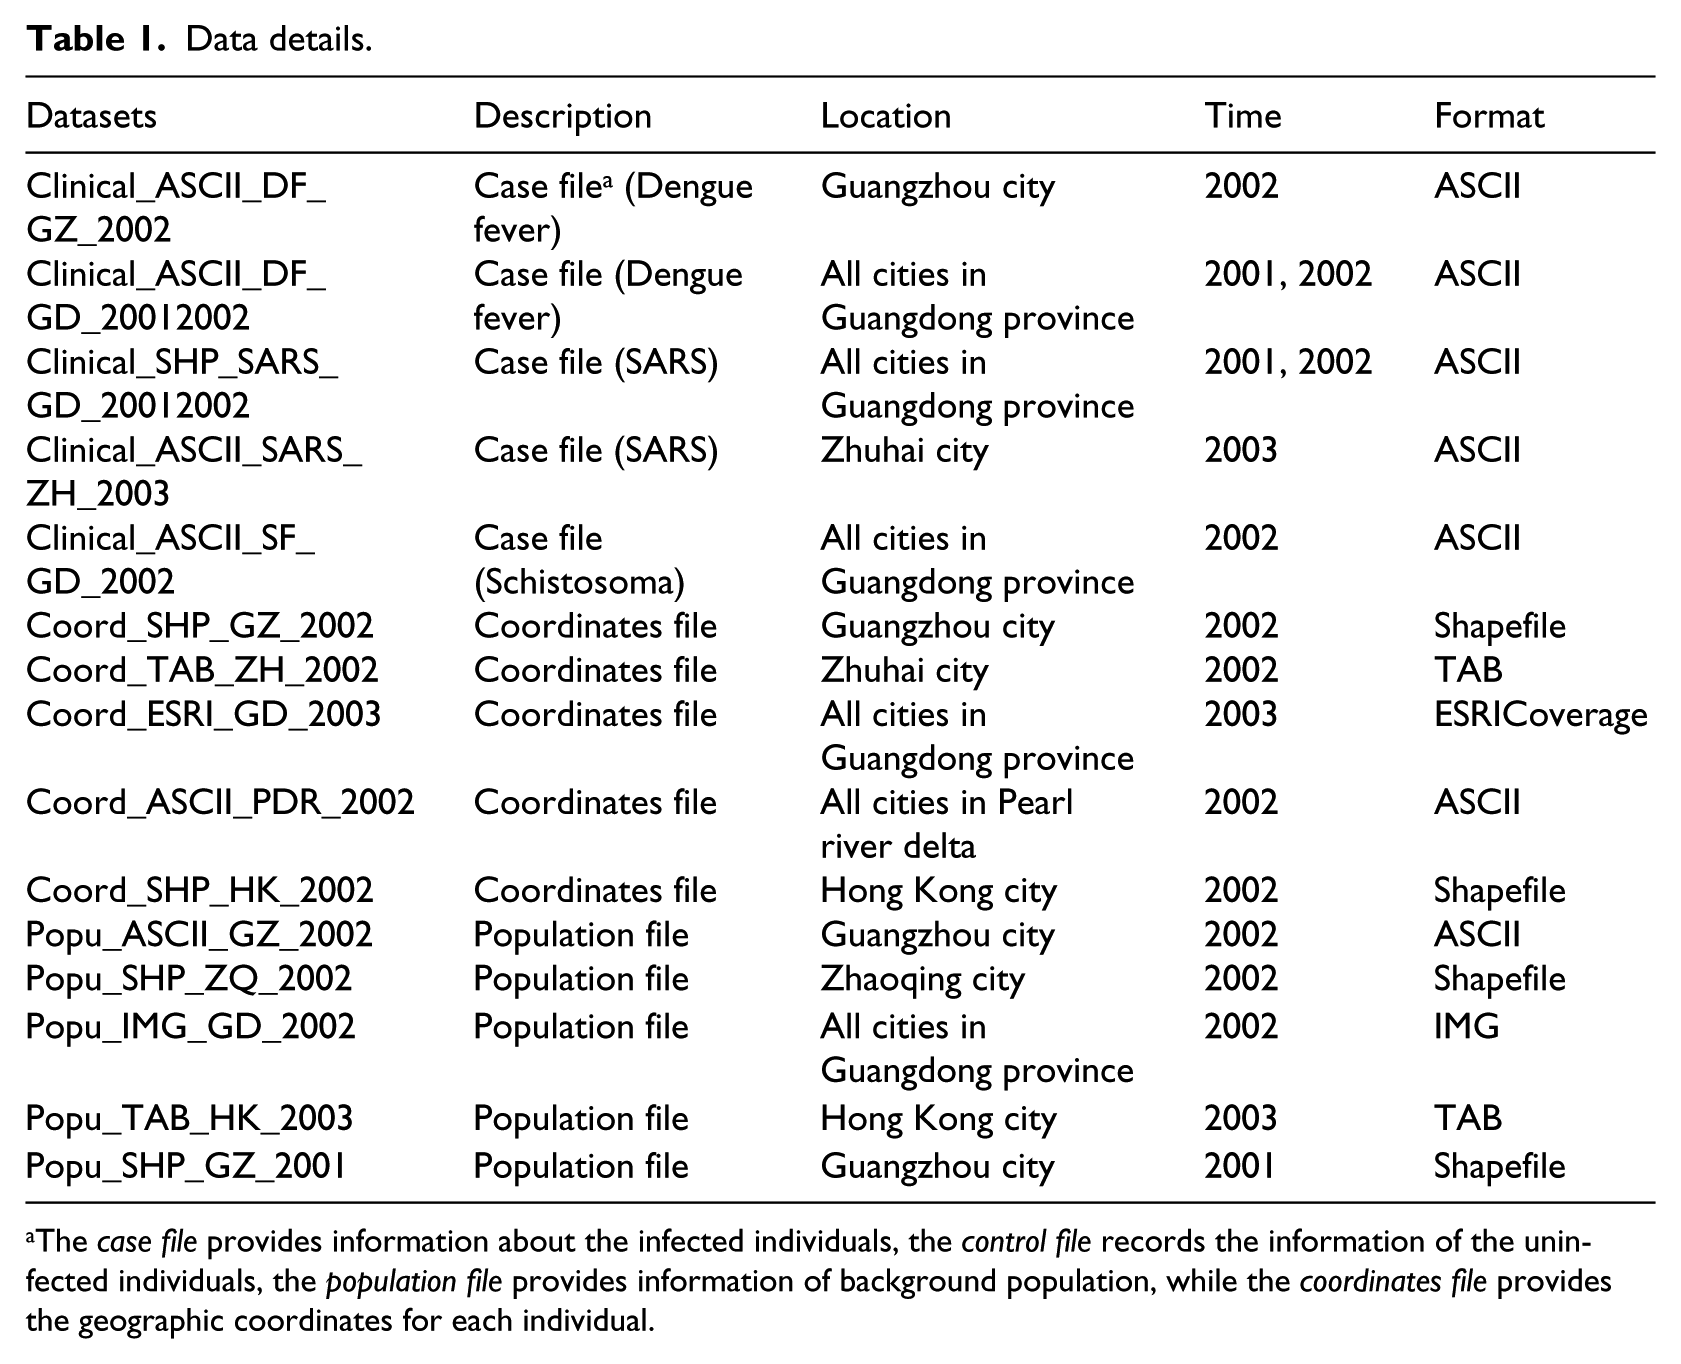
The case file provides information about the infected individuals, the control file records the information of the uninfected individuals, the population file provides information of background population, while the coordinates file provides the geographic coordinates for each individual.
Service details.
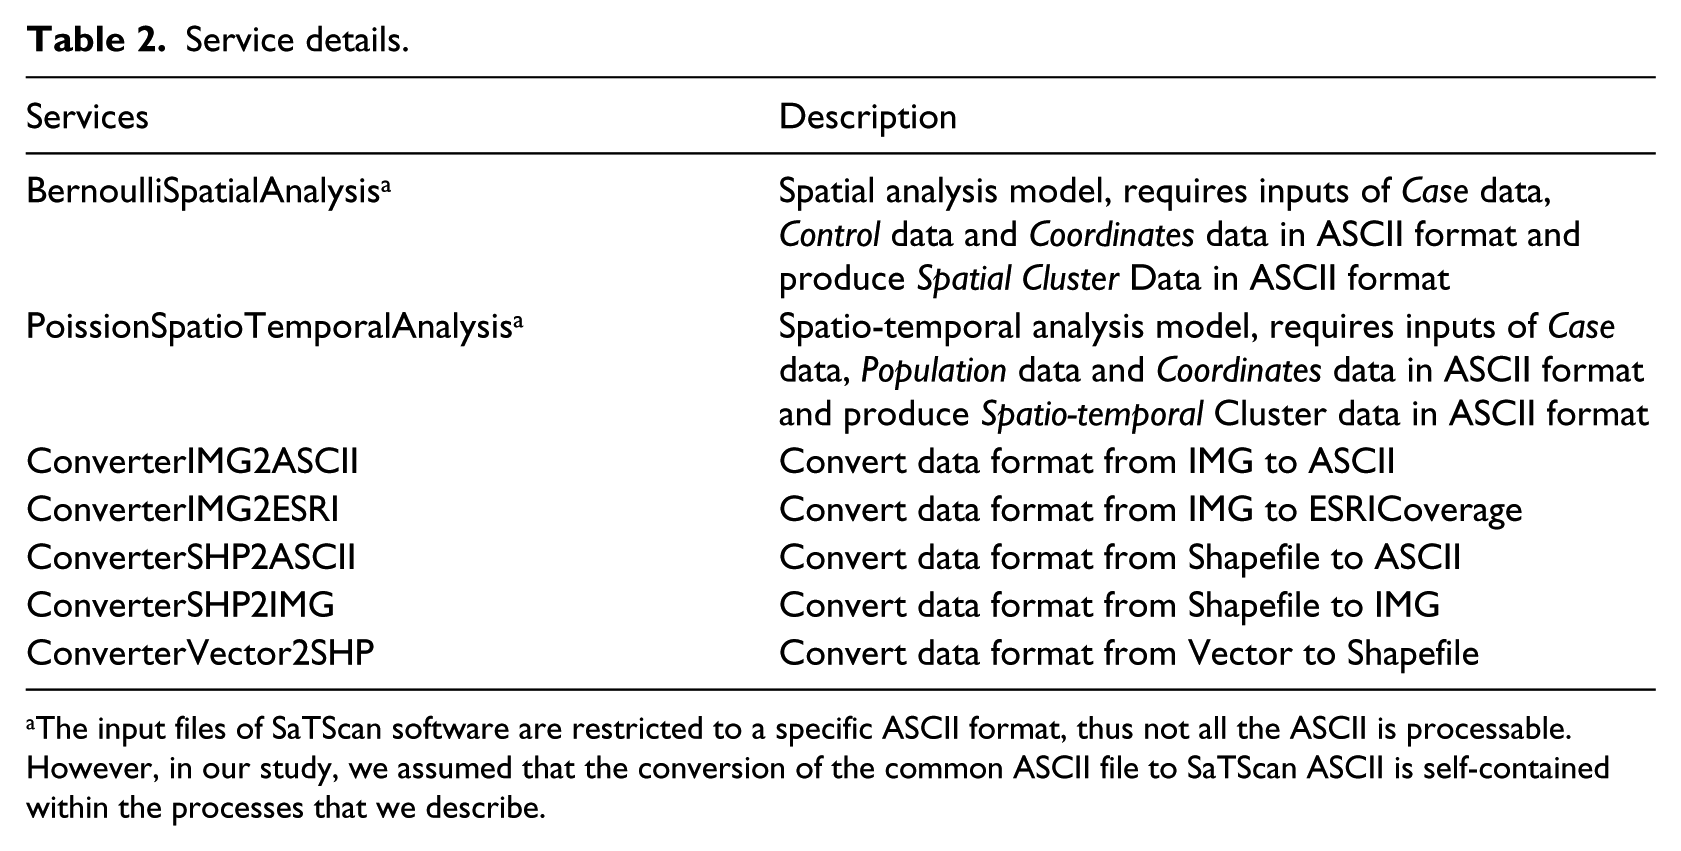
The input files of SaTScan software are restricted to a specific ASCII format, thus not all the ASCII is processable. However, in our study, we assumed that the conversion of the common ASCII file to SaTScan ASCII is self-contained within the processes that we describe.
Let us imagine the role of the application system: the officer needs to select the specific epidemic type, spatial extent and temporal span. The expectation would be that the system would provide informative information on (1) specific relevant datasets, (2) processes and (3) general workflows. This time-saving process would seek to guide the officer towards a solution. The overall ambition of the system is threefold: (1) to assist the officer in discovering suitable data and processes sourced over the Web, (2) to generate alternative plans to integrate retrieved data and processes for problem-solving and (3) to provide a user-friendly interface and generate easy-to-understand outputs.
Development of an application system
We can envisage the MASE system of comprising two layers: (1) a software layer, including a graphical user interface (GUI) and software agents for analysing semantics; and (2) a semantic layer – online accessible registry storing or cataloguing the semantic description files of available datasets and services.
Software layer: workflow design
Foundations of Intelligent Physical Agents (FIPA; http://www.fipa.org/) were used for constructing the software system. The sequence diagram in Figure 1 shows the general workflow of the system. The sequence of events of the system is as follows:
System start-up: When starting the system, MASE agents are automatically created and activated (service discovery agent, composition planning agent and agent behaviours).
User specification: A subset of the expert’s knowledge was embedded within the system, so that users only need to select their epidemic type, location and time span. This information is then passed to the MASE agent.
Automated decision support: When the MASE agent receives the message about the user’s specification, it uses this information to generate query files for each kind of data and process. The MASE agent saves these query files and requests the service discovery agent to start semantic service discovery in order to (1) locate the Semantic Web Services on the user’s behalf and (2) prepare the discovered services for ‘service composition’ (i.e. the process of creating step-by-step service chains through composition of a set of interoperable web services). When the service discovery agent finishes the work, a MASE agent will refresh the user interface with results of the discovered service(s). The composition planning agent will (1) check the consistency of data exchanged between semantic services, (2) identify whether all the requirements are fulfilled when a new service is ‘chained’ and (3) generate output files of the ‘composition plans’ (i.e. descriptive files of chained discovered services that will fulfil the user’s requirements). After the MASE agent is informed of the final results by the composition planning agent, it will refresh the user interface again to show the results. Issues of Semantic Web Service discovery and composition have been extensively researched.21–23 In this study, the methods used for semantic service discovery have been adapted from the Lutz 24 study. The planning methods for service composition are based on Klusch et al.’s 21 study. Codes and algorithms are detailed online. 25
Illustrative output: The user then receives a list of those web services that are suitable and available for the required data and processes as well as composition plans (in graphical form) illustrating how these discovered services could be composited to generate desired outcomes for decision-makers.
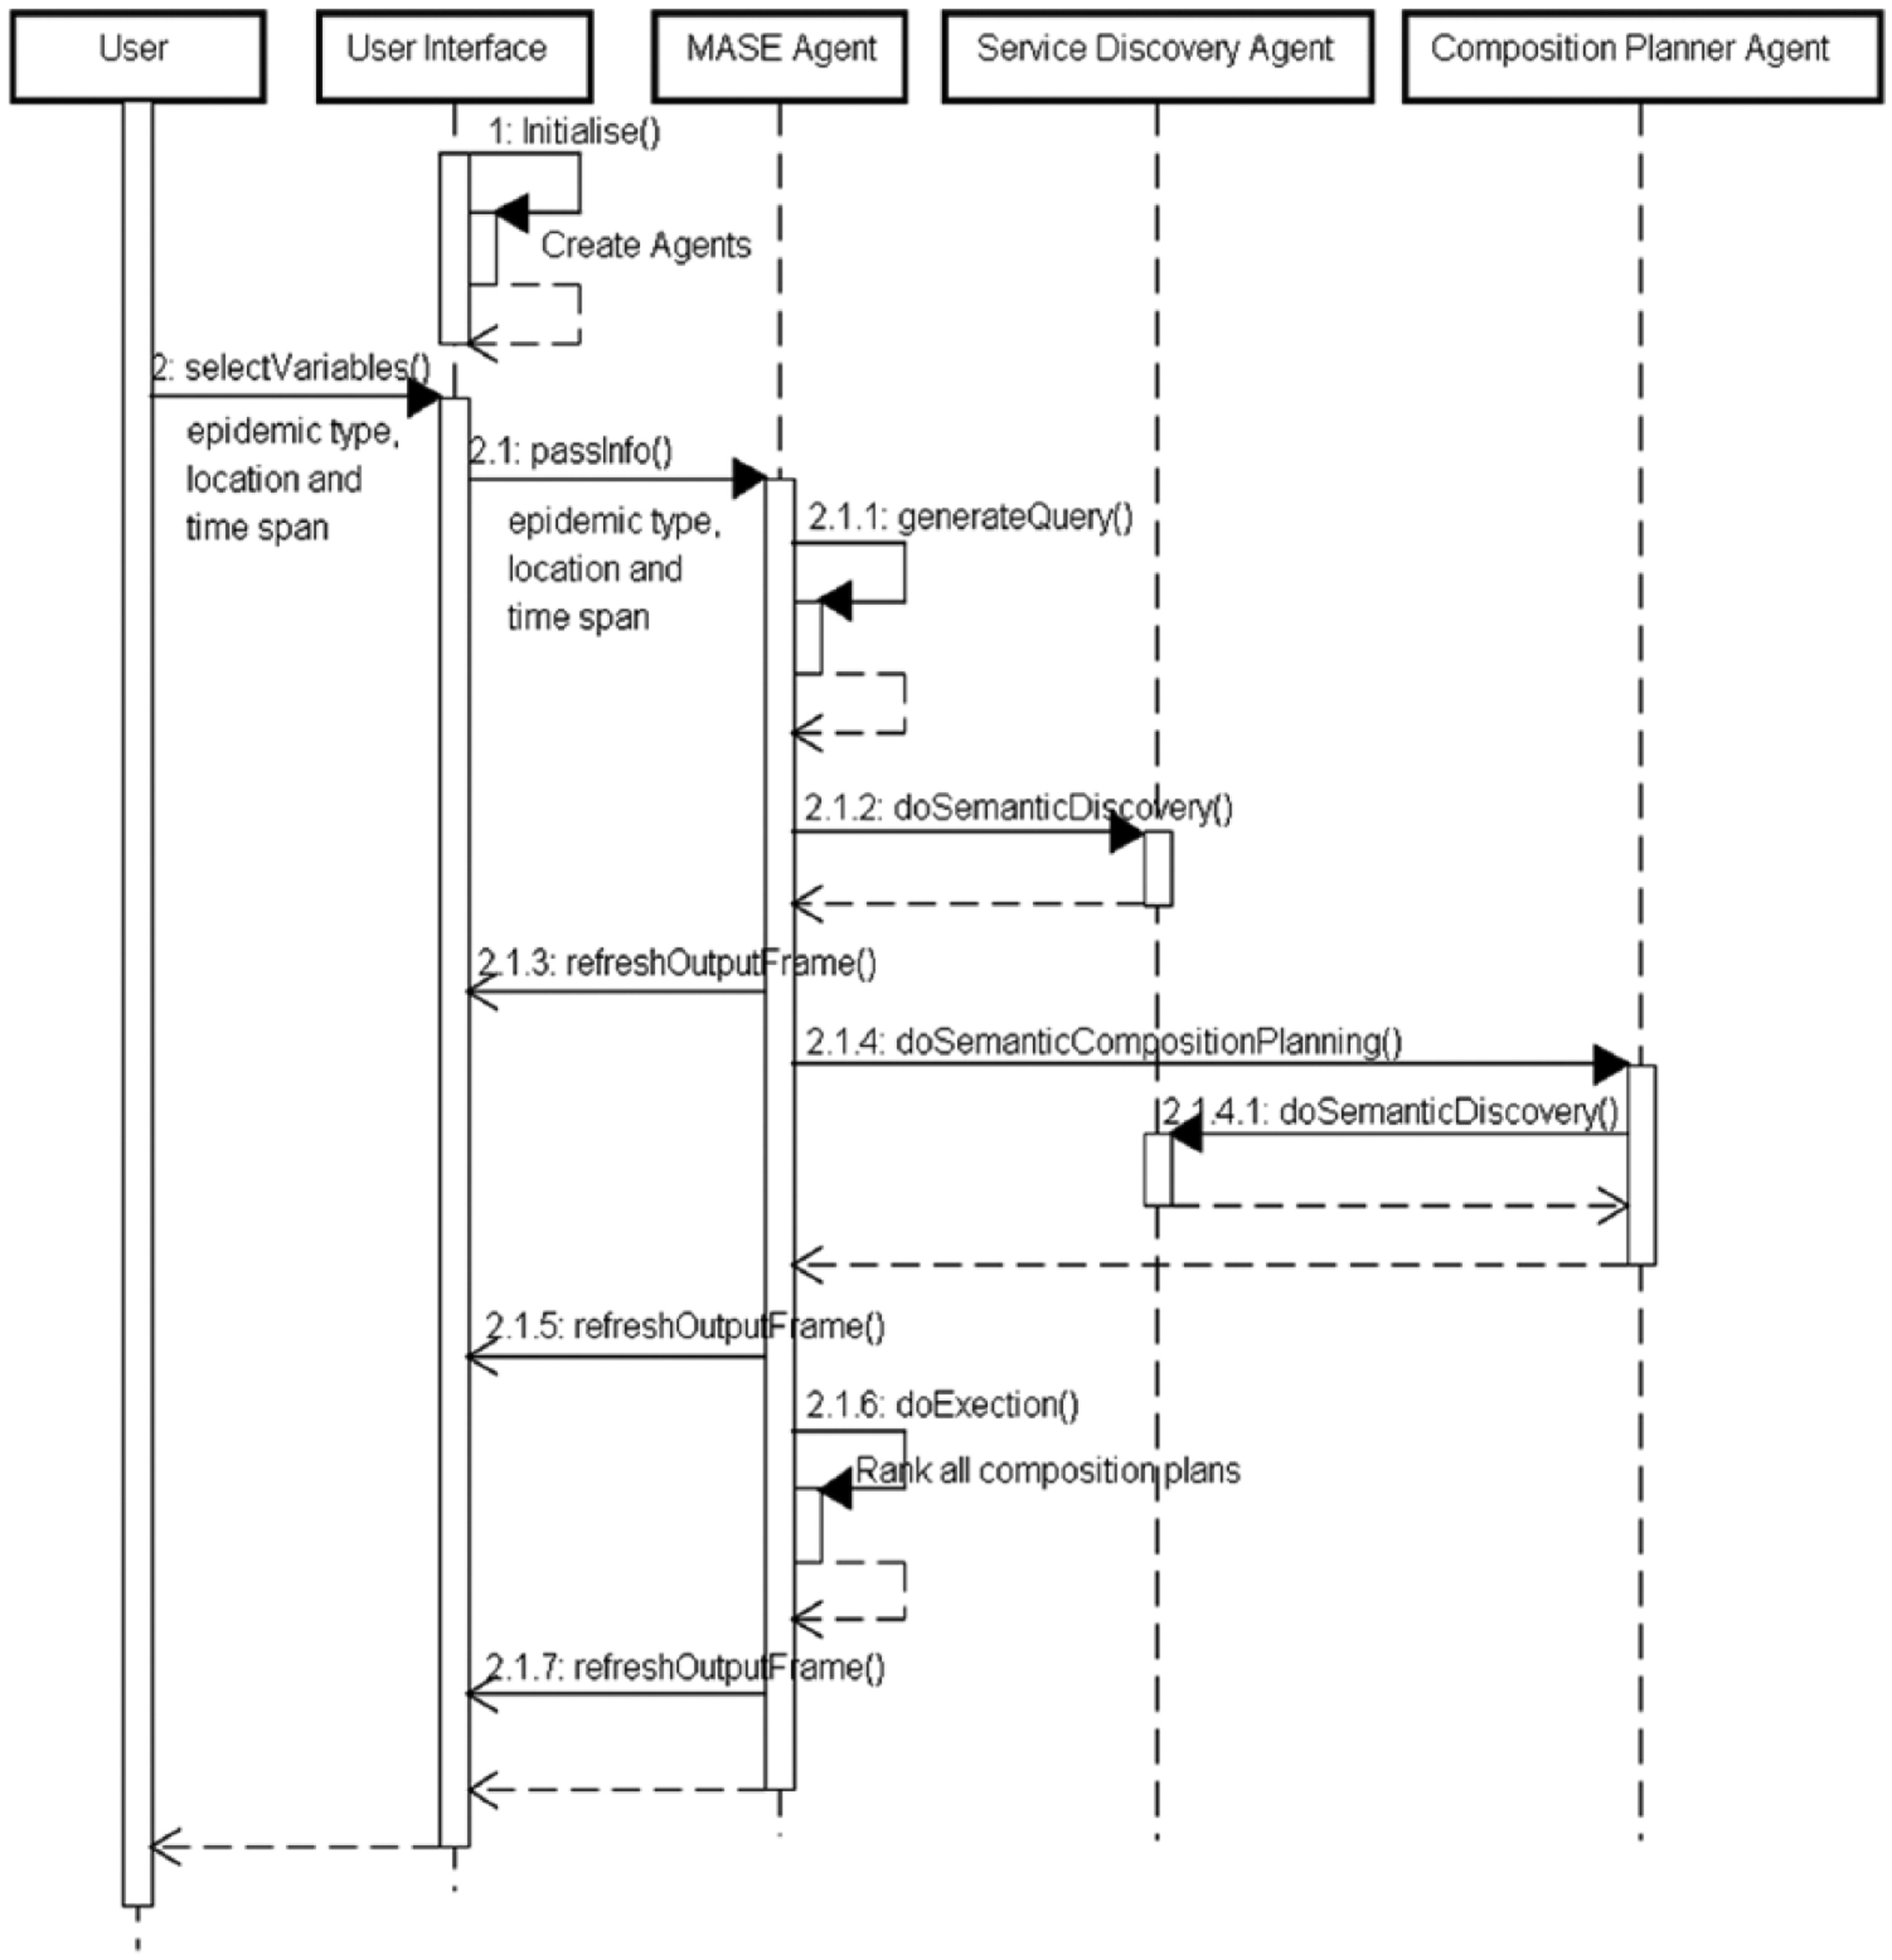
MASE prototype system flowchart.
Semantic layer: ontology base construction
The ontology base has two components: (1) ontologies that provide vocabularies and application ontologies that describe individual datasets or service sources and (2) registries/repositories in which providers can publish their Web Services’ profiles. Ontologies are represented by the web ontology language (OWL) 26 using the software Protégé 27 in order to be machine readable. We first produced OWL ontologies for annotating all the datasets in Table 1 and the services in Table 2. Then, OWL-S (http://www.w3.org/Submission/OWL-S/) service descriptions were published by referring characteristics of a web service profile (i.e. input, output and service types) to OWL individuals of dataset and service types 28 .
In the application system, three ontologies were produced: (1) a ‘Dataset Ontology’ describing the common properties of a dataset relevant to epidemiology management (e.g. the spatio-temporal extent, projection information, data model), (2) a ‘Service Ontology’ for the types of epidemiological process a GIS service can do (e.g. spatial analysis, data processing) and (3) a ‘Spatio-temporal Ontology’ used for simple spatial and temporal reasoning. Based on these semantics, a dataset or a service can be described as an instance (or an individual of OWL class), that is, the ground-level component of an ontology. Finally, a Semantic Web Service can be published by using a number of instances of the dataset ontology for the input/output specification and one instance of service ontology to describe the type of tasks that can be done.
Ontologies for dataset and service semantics
By abstracting searchable online ontologies and literatures, 29 we created two simplified ontologies: ‘Service’ and ‘Dataset’. These are used to describe several general concepts in the domain of GIS web service and epidemiology data management. This is displayed in Figure 2, where an entity type denotes a concept, a line refers to a relationship and P refers to the cardinality constraint. In OWL, concepts are represented as classes. Relationships between those classes can be taxonomic or non-taxonomic. A taxonomic relation is a parent–child relation between OWL classes. A non-taxonomic relationship that usually links a domain class to a range class is represented as an OWL property. In Figure 2, they are indicated by a solid line (with a black spot pointing to the subclass) and a dashed line (with a diamond pointing to the domain class and a black spot pointing to the range class) respectively. Thus, Figure 2 shows how these concepts were organised differently for dataset and service semantics. In the ‘Dataset’ ontology, the ‘Epidemiological Dataset’ class conceptualises common types of datasets used in epidemiology management. It has two properties: ‘hasRecordablePhenomenon’ and ‘hasRecordableType’ that respectively link to the range classes of ‘Epidemiological Phenomenon’ and ‘Epidemic Types’. Common ‘Epidemiological Phenomenon’ can be the location and time span of an epidemic, that is, ‘Ep_Location’ and ‘Ep_TimeSpan’ classes. ‘Epidemiological Dataset’ is a subset of ‘Spatio-temporal Dataset’, which has a property: ‘Data Format’. This property can be applied to ‘Epidemiological Dataset’ because of the parent–child relation. In the ‘Service’ ontology, we included the service types of several GIS processes in data management and analysis.
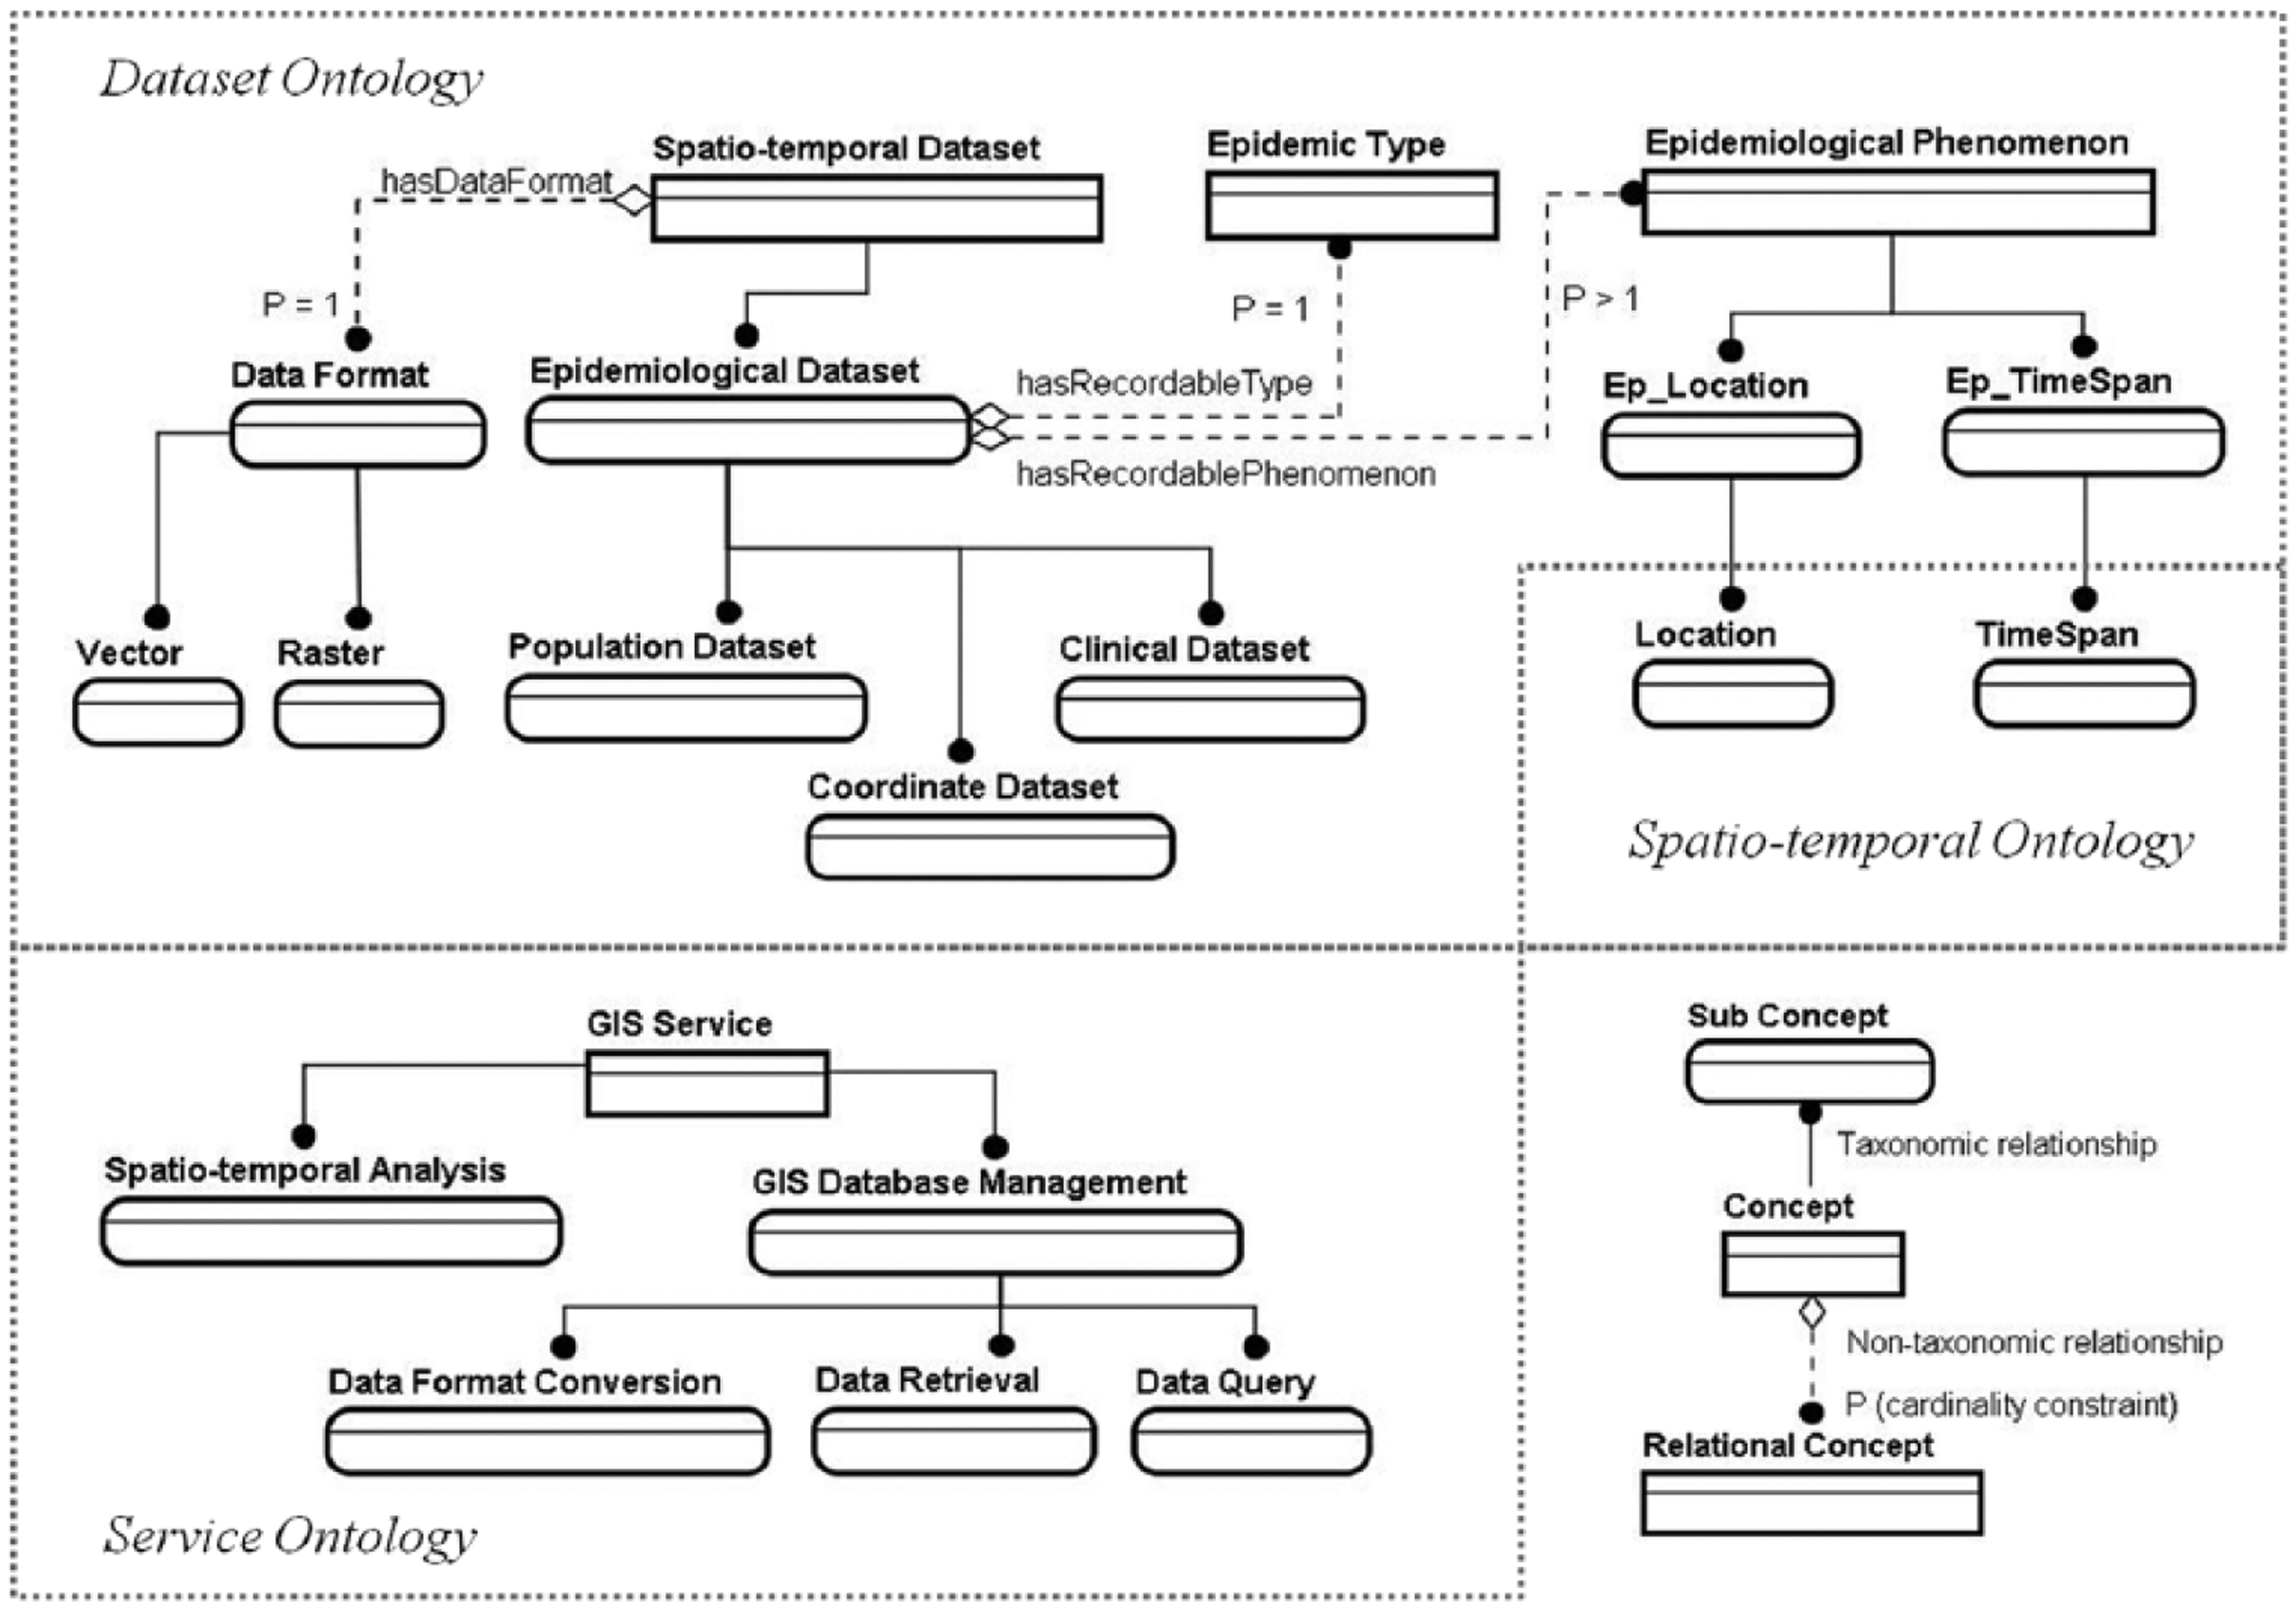
ER schematic representation of ontologies and their relationships.
Ontology for simple spatial and temporal reasoning
In our study, we attempted to use simple ‘part–whole’ (non-taxonomic) relationships to add spatial and temporal semantics to the geospatial data. For the use case, we conceptualised the spatial and temporal information as ‘Location’ and ‘TimeSpan’ classes in the ‘Spatio-Temporal’ ontology. These two classes were also set as the subsets of ‘Ep_Location’ and ‘Ep_TimeSpan’ classes in the ‘Dataset’ ontology. Based on Table 1, we have the following two sets to reason with – a set of spatial classes (Locations) and a set of temporal classes (TimeSpans):
Location = {Pearl River Delta, Guangdong Province, Guangzhou, Zhuhai, Hongkong, Zhaoqing}
TimeSpan = {Year 2001, Year 2002, Year 2003, Years20012002}
Their relationships were built based on map and time charts. The ontological developments of each set are presented in Figures 3 and 4, respectively. In the application system, a simple reasoning scheme was developed for the MASE agent when generating data queries. For example, if the user specifies interests in a ‘part’ region (e.g. ‘Guangzhou’), the datasets recorded for the ‘whole’ region (e.g. ‘Pearl River Delta’, ‘Guangdong Province’) are also considered useful. As a result, regions of ‘Guangzhou’, ‘Pearl River Delta’ and ‘Guangdong Province’ would be all included in any data queries.
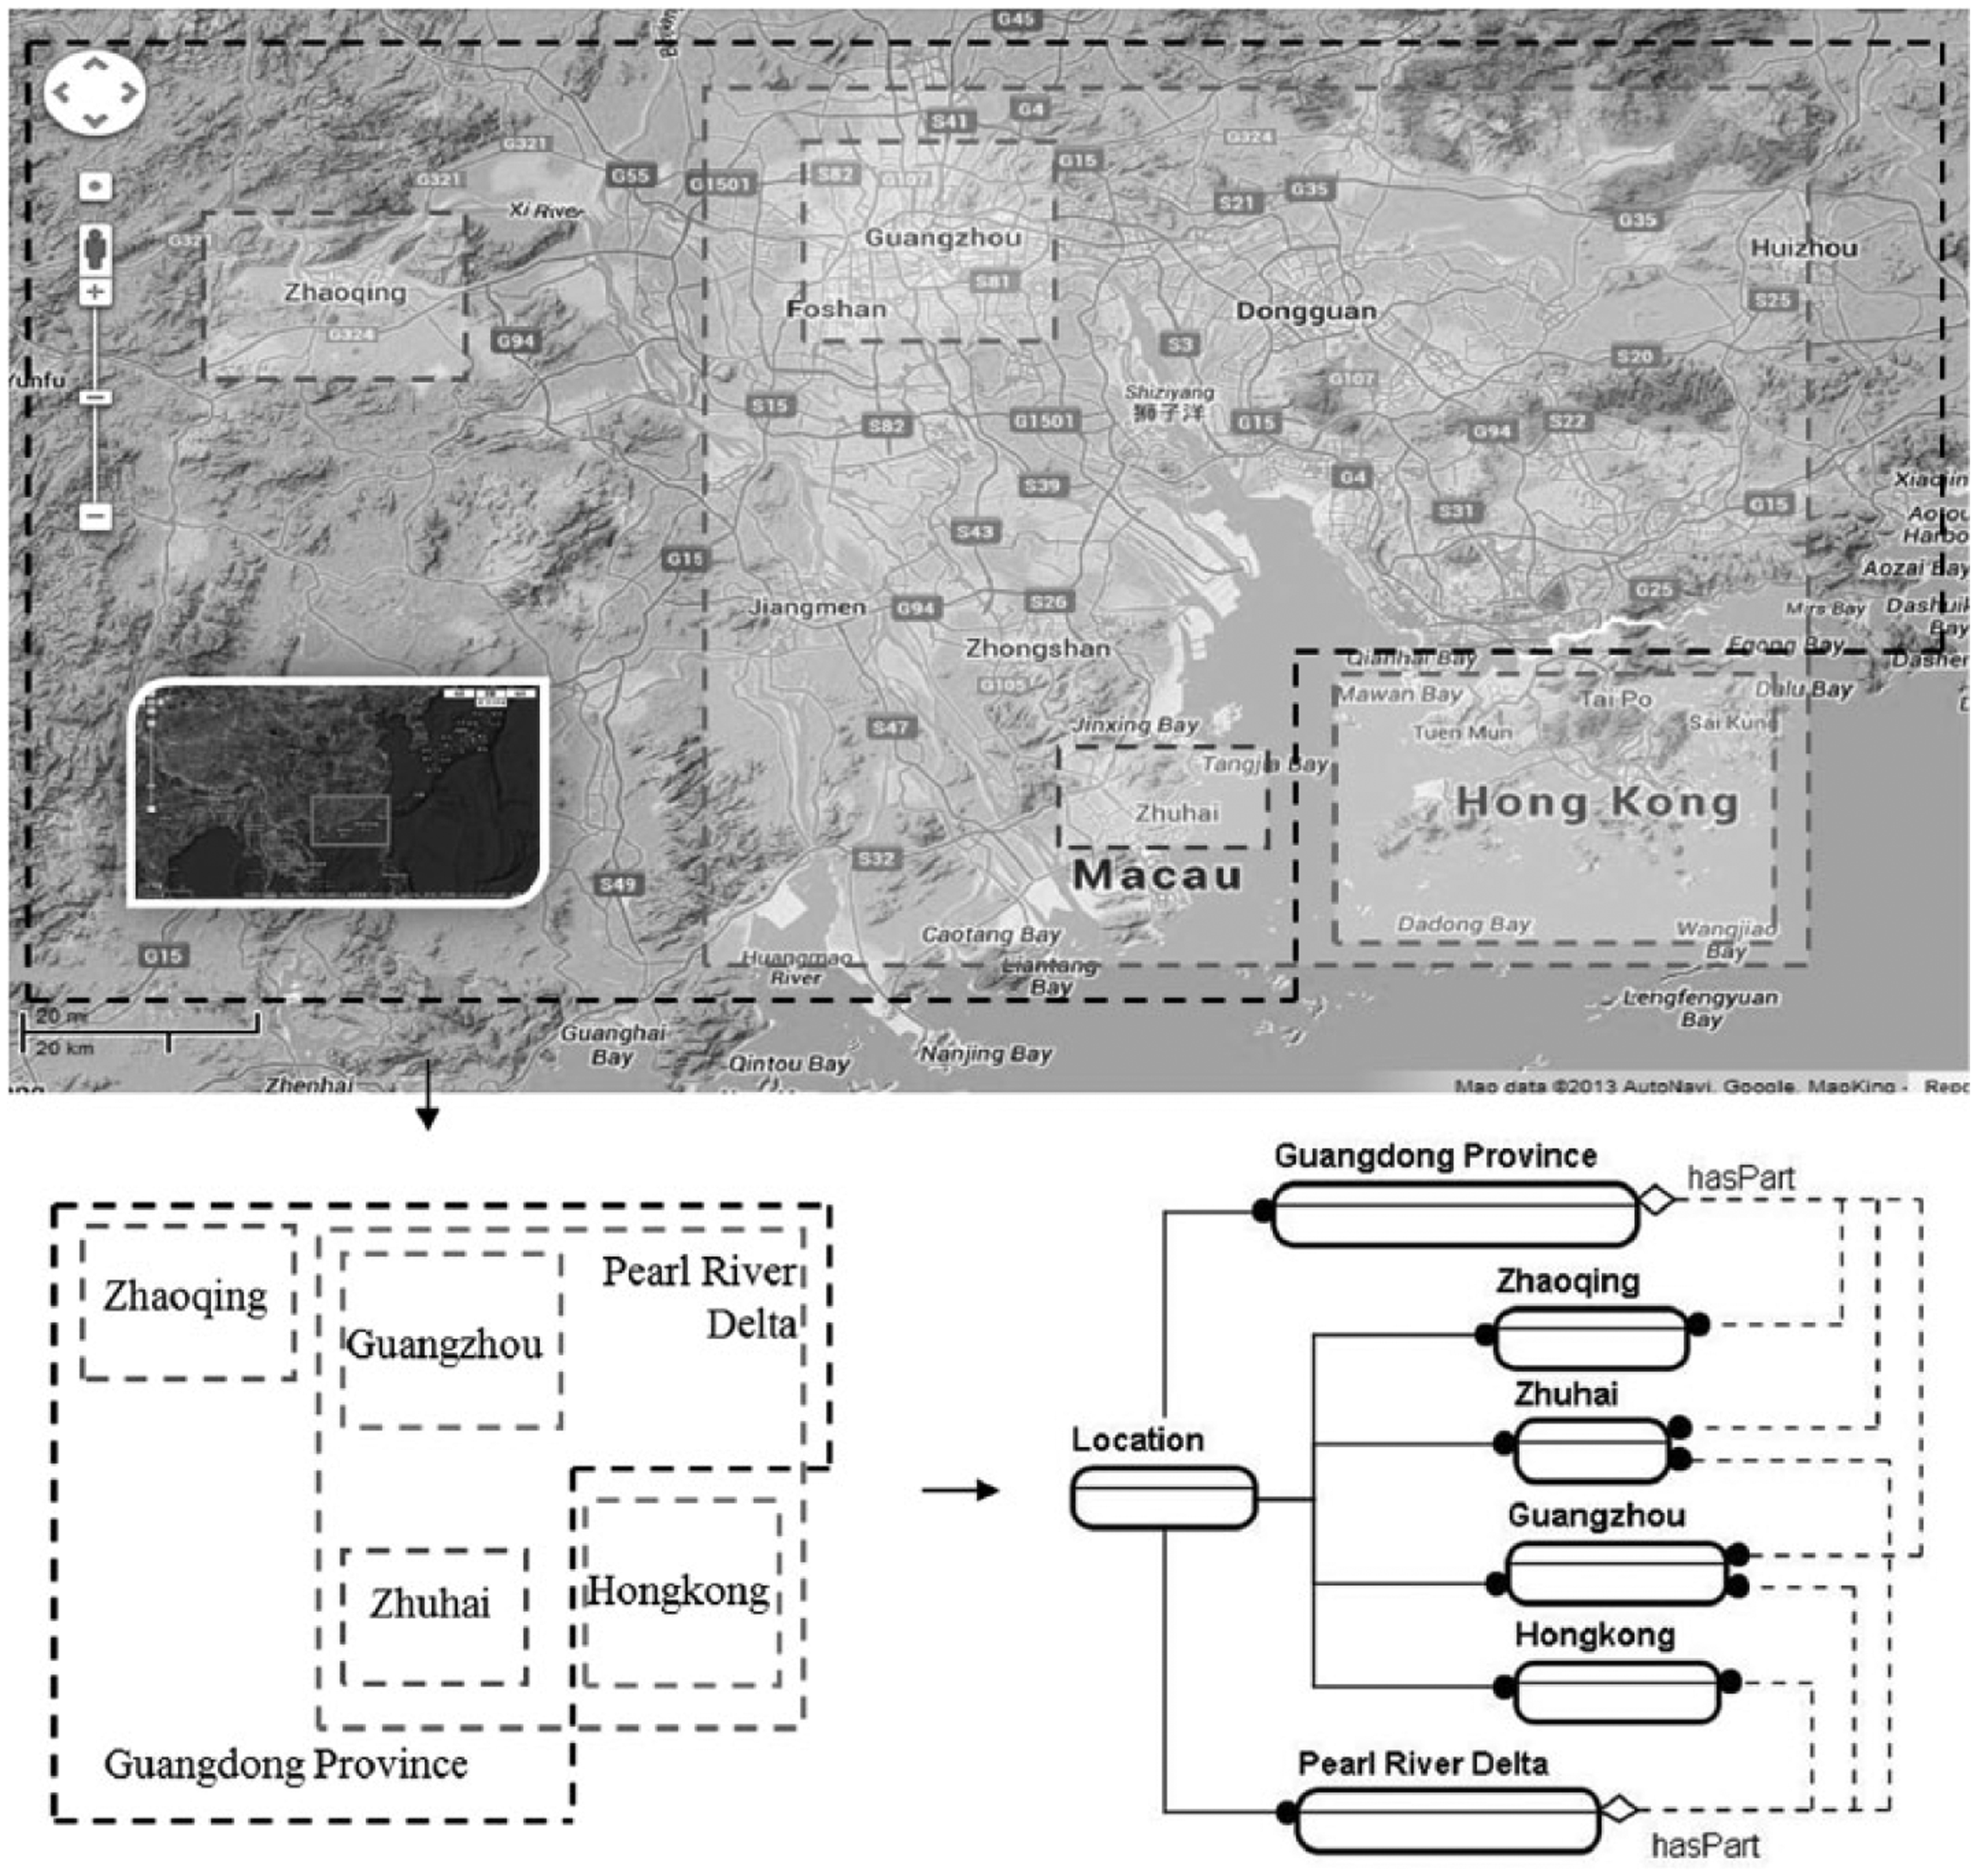
Part–whole relationships of the spatial classes.
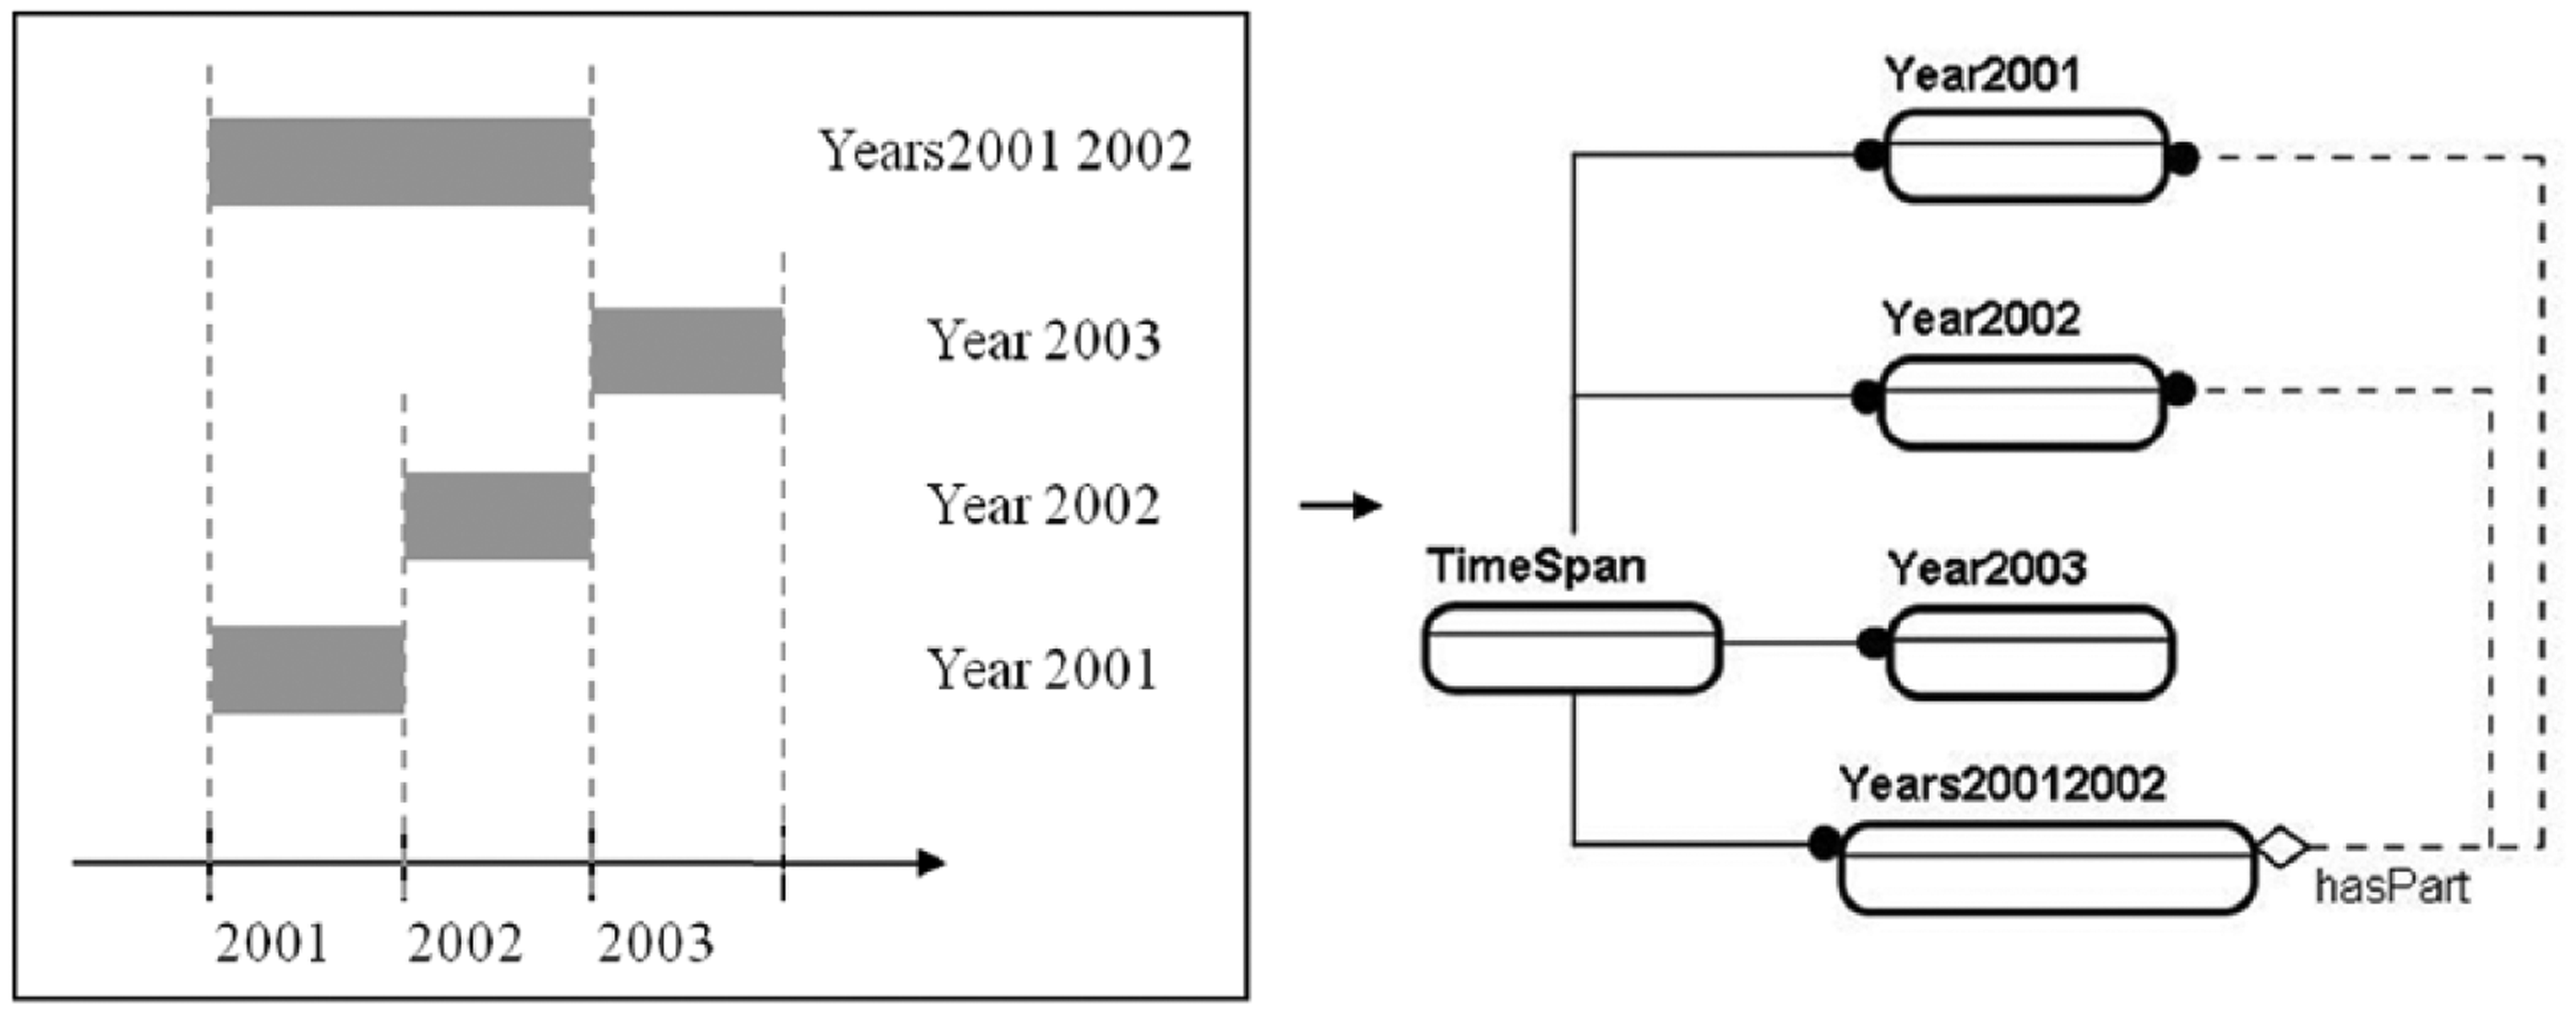
Part–whole relationships of the temporal classes.
Annotating datasets and services
A number of instances were developed for each of the datasets and services. To describe a dataset, both taxonomic and non-taxonomic relationships were used. By way of example, an instance for the ‘Clinical_ASCII_DF_GZ_2002’ dataset (the first dataset in Table 1) was developed as follows. The OWL individual of this dataset was derived as an instance of the ‘ClinicalDataSet’ class in the ‘Dataset’ ontology. This had a property of ‘hasDataFormat’ linking it to ‘ASCII’ OWL individual, which is an instance of ‘Raster Data’ in the ‘Dataset’ ontology. The properties ‘hasLocation’ and ‘hasTimeSpan’ were linked to the instances of ‘Guangzhou’ and ‘Year2002’ in the ‘Spatio-Temporal’ ontology. To publish the instances of the service ontology, simple references were used. For example, the ‘BernoulliSpatialAnalysis’ and the ‘ConverterIMG2ASCII’ OWL individuals (Table 2) were respectively defined as instances of the ‘Spatio-temporal Analysis’ class and the ‘Data Format Conversion’ class in the ‘Service’ ontology. For data provider services, their service types were defined as instances of the ‘DataRetrieval’ class in the ‘Service’ ontology.
Publishing the Semantic Web Services
We used two basic types of GIS service: (1) a data service which provides online accessible datasets and requires a query as input in order to output the corresponding datasets and (2) a process service that provides online invokable processes and requires datasets as both inputs and outputs. Thus, the provider can publish an OWL-S service profile by linking its ‘hasInput’ and ‘hasOutput’ properties to the instances of the ‘Dataset’ ontology and by referring its ‘serviceClassification’ property to an instance of the ‘Service’ ontology. For example, for the service profile of the ‘Clinical_ASCII_DF_GZ_2002’ data provider, the properties of ‘hasInput’ and ‘hasOutput’ were respectively linked to an instance of the ‘Data Query’ class in the ‘Service’ ontology and the instance for the ‘Clinical_ASCII_DF_GZ_2002’ dataset (as developed in the previous subsection), while the ‘serviceClassification’ was connected to an instance of the ‘DataRetrieval’ class in the ‘Service’ ontology.
Running the application system
Within a Java programming environment, we used OWL and OWL-S application programming interfaces (APIs) to model ontologies and the Semantic Web descriptions. The software agents were developed within the Java Agent DEvelopment (JADE) framework. 30
An illustrative GUI is presented in Figure 5. Users first get a brief list of datasets required for a spatio-temporal scan analysis on the epidemic. They only need to specify the ‘Epidemic Type’, ‘Location’ and ‘TimeSpan’ information in the grey box entitled ‘Manual Specifications’. After clicking the ‘Apply’ button from the ‘Specification’ tab, the queries generated for data retrieval are presented in the ‘Generated Queries’ tab. Then, automatically, (1) the discovered services will be displayed in the ‘Service Discovery’ tab with details on service location, service type and input/output requirements in a tree-list; and (2) the graphical plans to composite these discovered services will be available through the ‘Composition Planning’ tab. Thus, the application system requires minimum user involvement but provides rich information to potential web service experts.
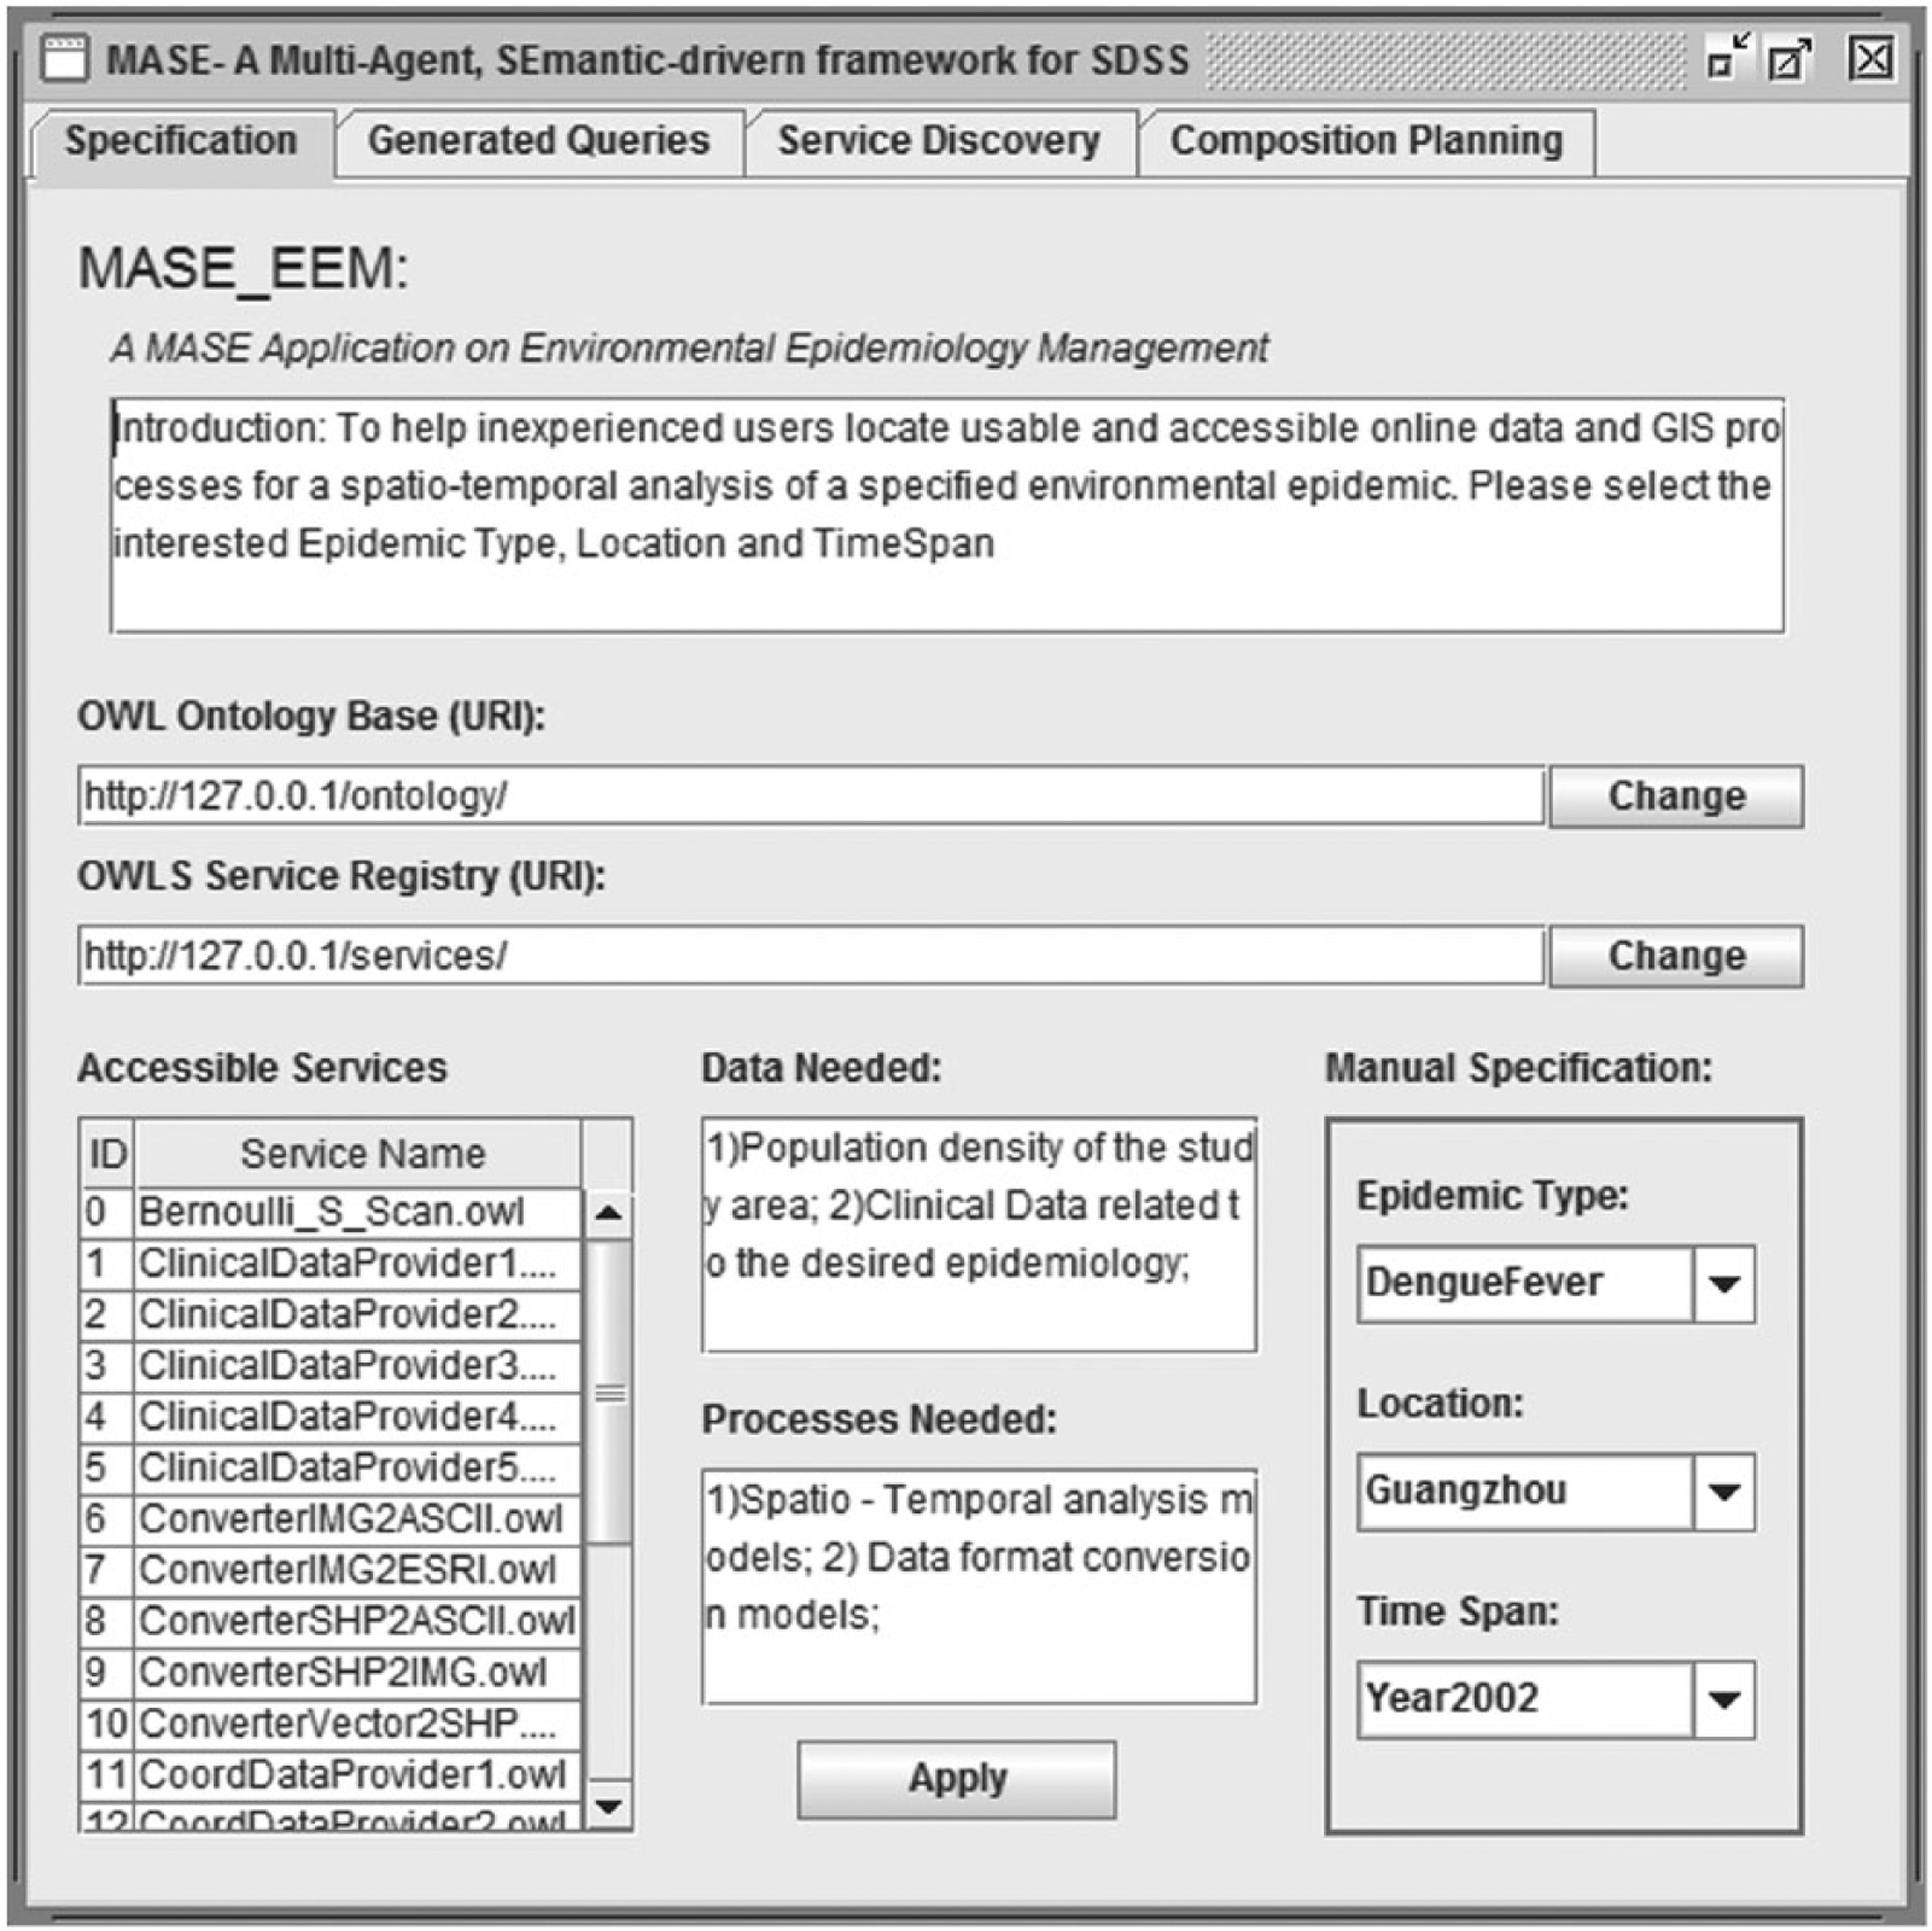
GUI of the application system.
Evaluation of the application system
To validate the prototype system, we used the Golden standard 31 – in order to test cases with prior and known outcomes. We ran the system based on several scenarios which were set up by randomly selecting different user specifications on ‘epidemic types’, ‘locations’ and ‘temporal spans’. Two of them are presented below:
Scenario I: the interest is in 2002’s Dengue Fever status in Guangzhou city
Scenario II: the interest is in 2002’s SARS status in Zhuhai city
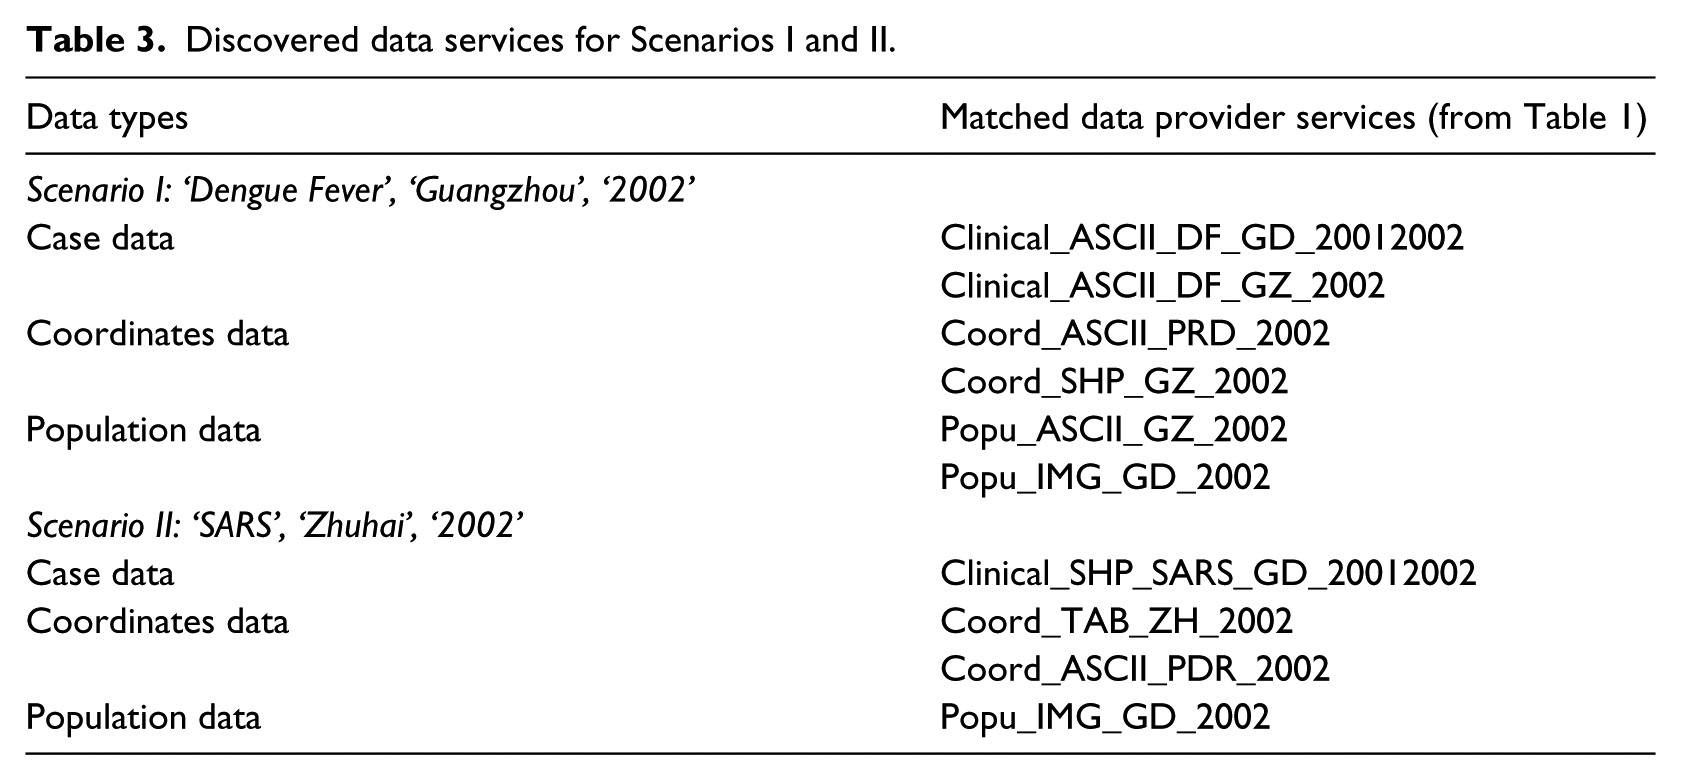
For each scenario, the MASE application system successfully and automatically output (1) detailed files of discovered data provider services in the ‘Service Discovery’ tab of the GUI (as summarised Table 3) and (2) recommended plans to convert these data suitable for the spatio-temporal models from the ‘Composition Planning’ tab of the GUI. Snapshots of the graphical output are presented in Figure 6. These outcomes were found to be very much what we anticipated (i.e. the model outcomes were the same as the ‘known outcomes’).
Discovered data services for Scenarios I and II.
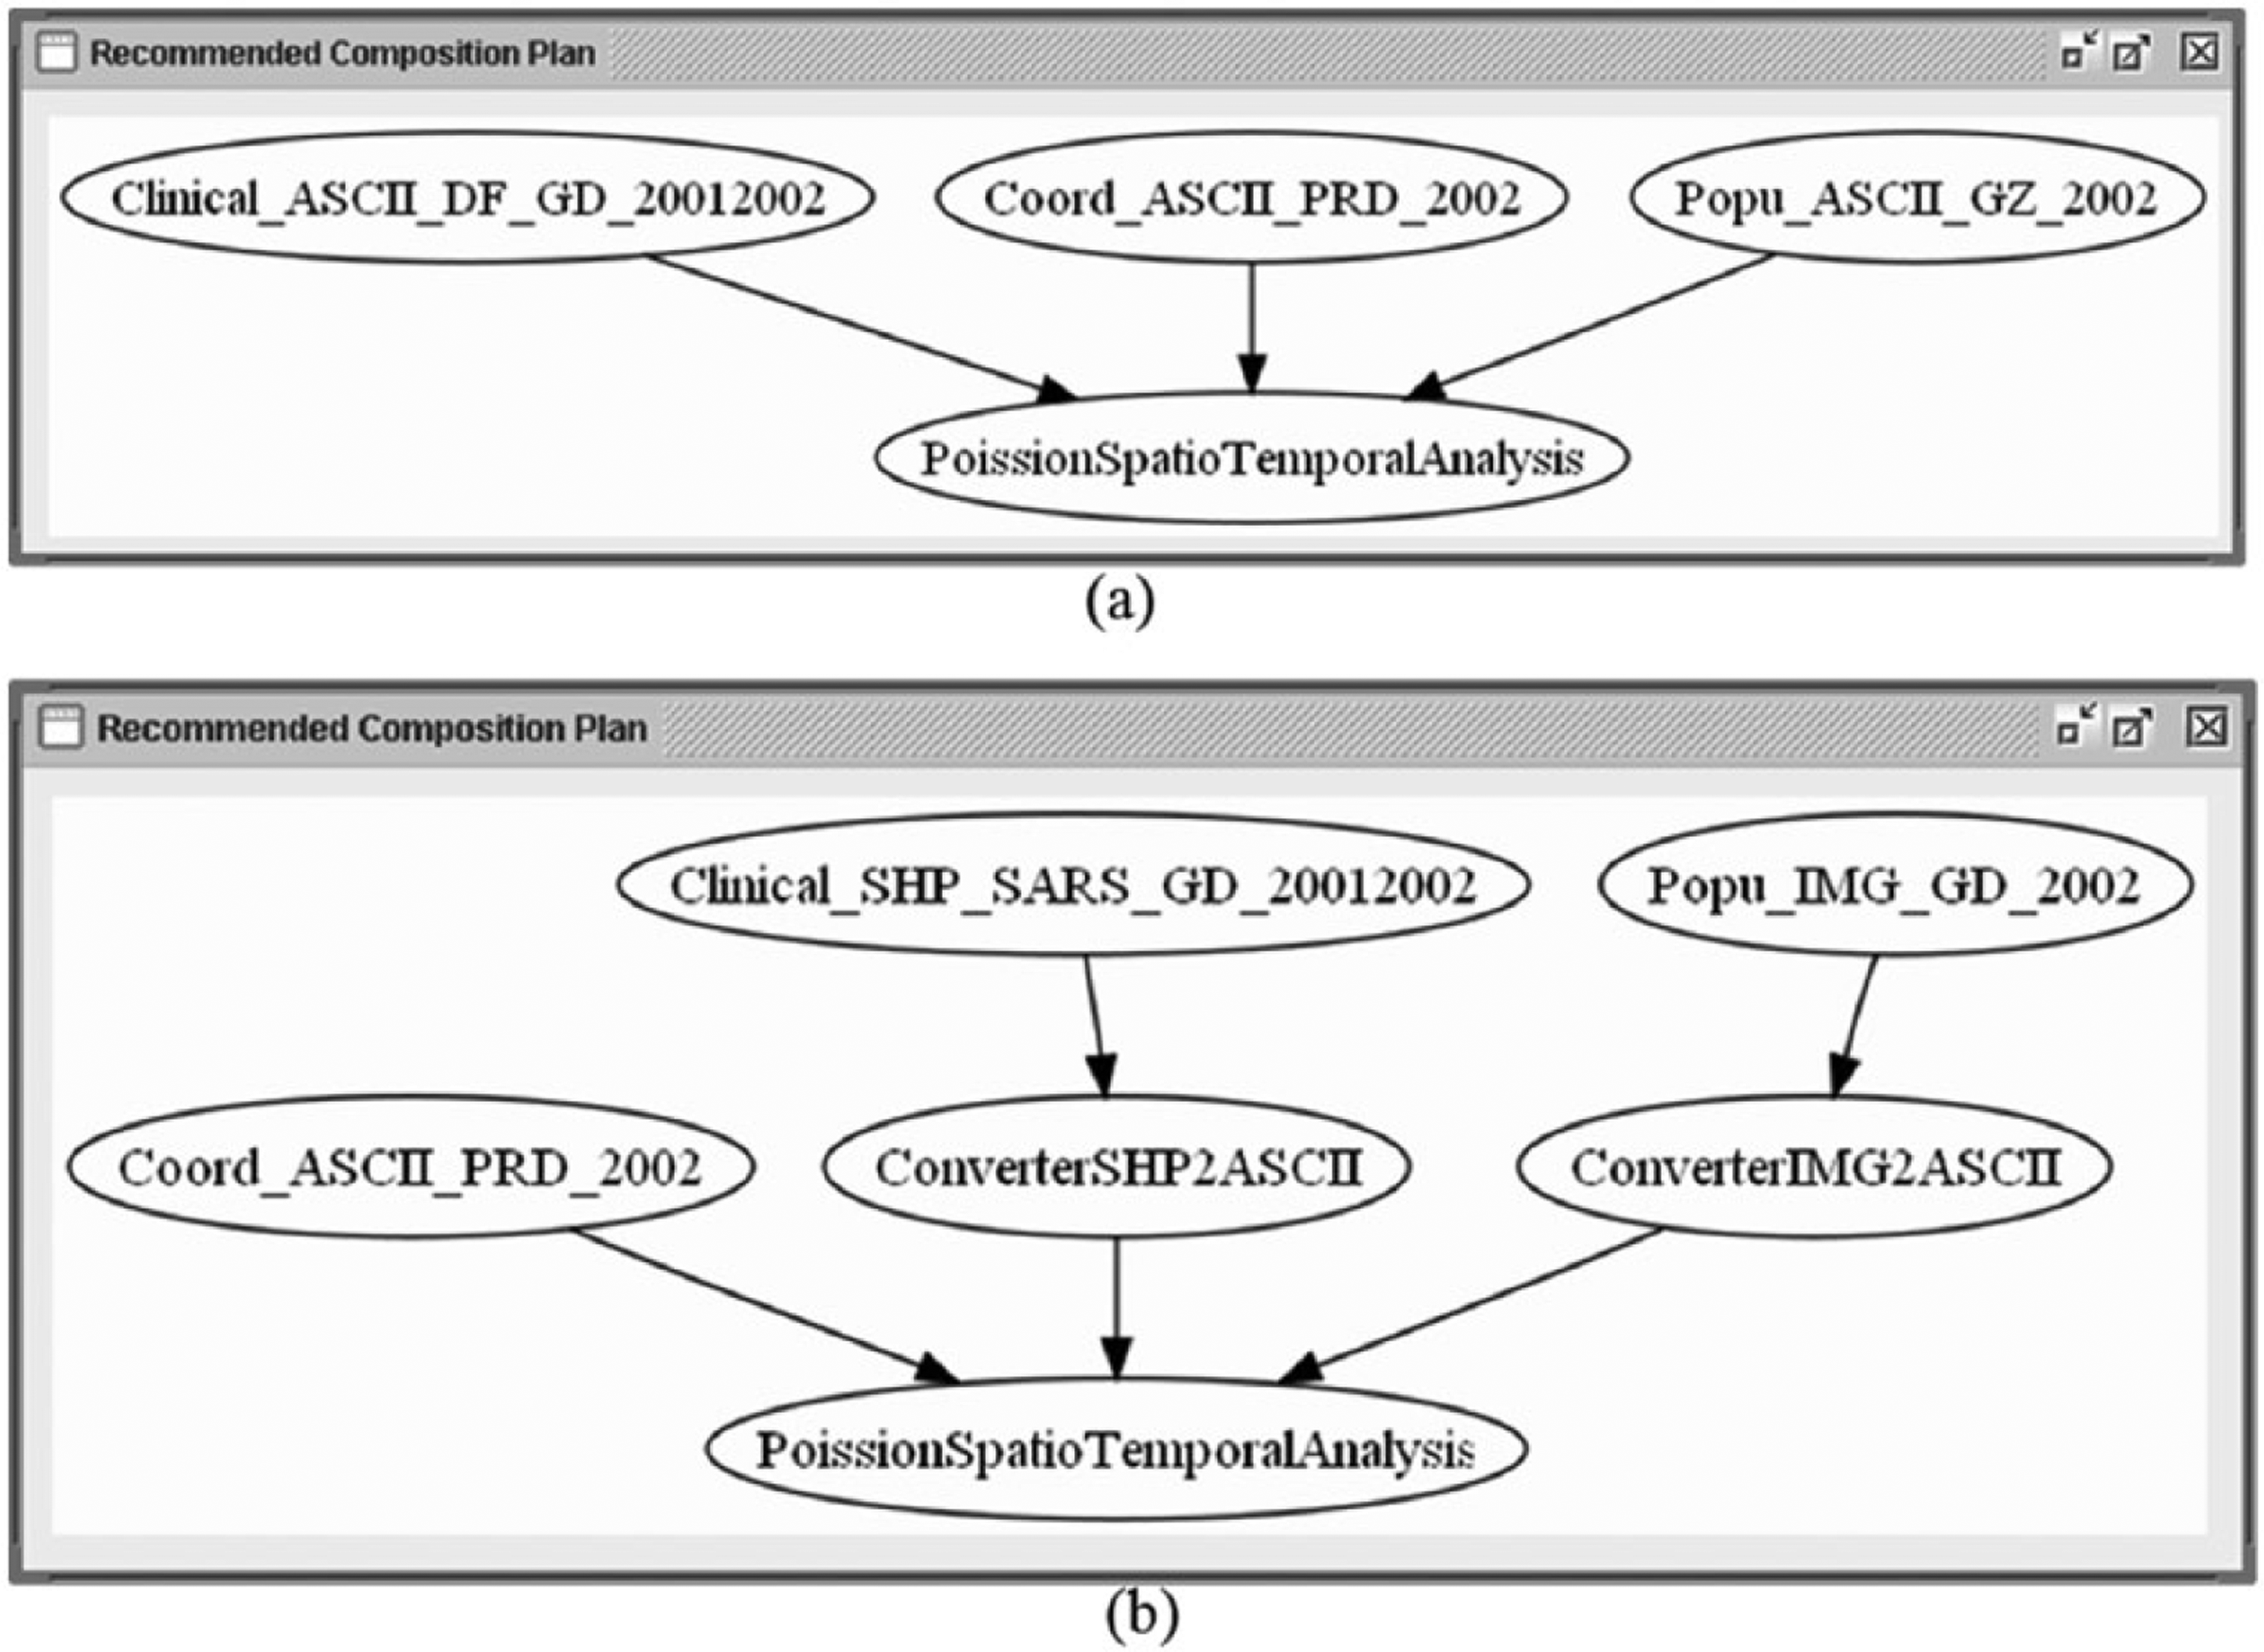
Recommended composition plans for (a) Scenario I and (b) Scenario II.
Discussion
Our pilot study presented a MASE approach for SDSS. Intelligent agent methodologies and the Semantic Web Services are both popular approaches in the development of information systems. Recent achievements show multiple ways of integrating them. For example, semantics can be used to facilitate agent communication, or, similar to our study, they can be integrated in order to support better system autonomy and interoperability.22,23,32 In our study, with a specific focus on epidemic management, an application system was constructed to help an inexperienced officer locate the required web data and process services for epidemiological analysis, generate alternative composition plans for disease data conversion and export graphical results. We illustrated (1) how the Semantic Web can be used to enhance the description of epidemiological data and processes in order to facilitate information retrieval and (2) how intelligent software agents can achieve sufficient autonomy to enable semantic service discovery and composition, thus helping the user to locate data and process services and composite them as potential executable workflows.
Along with an increased call for data sharing in epidemiology research and practice, the usefulness of the Semantic Web Services has become increasingly recognised. 33 Although most discussions are on the usability of ontological modelling to represent the conceptualisations underpinning the data (and the metadata), those for epidemiological models are rare. This is mainly due to the current inconveniences of deploying online executable epidemiological models: (1) most of them are case-specific and cannot be used universally and (2) they rely on spatial datasets that are usually too large to be invoked via the Internet. Nevertheless, model semantics have the potential to benefit the development of decision support systems. A common example is that of designing the data processing steps for proposed epidemiological models (i.e. converting data into suitable formats). Following a recent proposal on publishing computer code, some modellers have become more open-minded about sharing their models. 34 However, there remains a lot of work in promoting standardised protocols for model description and to bridge annotations among different programming languages.
Among the types of semantics used in this study, spatio-temporal semantics can play a particular role in the management of epidemiological information. Fundamentally, this is because the infection rate of an epidemic is an inherently spatio-temporal process, requiring susceptible human beings to come into contact with pathogens at certain locations over specific time periods. Hence, a meaningful description of an epidemic must include explicit spatial and temporal information, such as the location and time of the first case and how far it spread. Moreover, reasoning over the spatio-temporal domain can aid the discovery of hidden relationships. In the presented example, let us imagine that a user is querying an epidemic outbreak record with a spatial mark-up of ‘Guangzhou’. Suppose there are no such datasets in the registry, but (1) there is a dataset A that has an annotation of ‘Guangdong’ (Guangzhou is the capital city of Guangdong province) as its location and (2) there is another dataset B that uses numerical coordinates of Guangzhou to represent its spatial extent. In this situation, conventional discovery engines will not return any results. However, if we specify ‘Guangzhou’ as a geographical part of ‘Guangdong’ and either ‘Guangzhou’ or its numerical coordinates as a representation of Guangzhou’s location, then after reasoning through these relationships, the proposed MASE approach can retrieve both A and B. Moreover, more relationships can be determined even where they are implicit. For example, if we further have ‘Haizhu’ (district) as a part of ‘Guangzhou’, a relationship of ‘Haizhu’ as a part of ‘Guangdong’ can therefore be inferred. Finally, we note that quantitative representations of the spatial and temporal information (i.e. numerical values), rather than OWL ontologies, will lead to a more robust system performance. In reality, datasets may not all be numerically annotated. In most cases, the annotations vary. For example, the name of a place may appear in different languages or the time recorded from different calendars or time zones. It is also possible that only qualitative descriptions of spatial and temporal information are used (i.e. ‘west of Guangzhou’ for spatial or ‘before 2003’ for temporal). In such circumstances, OWL ontologies become more useful, as they help establish these concepts and thus present them in a form that the software can understand. 35
Despite its vast potential, the Semantic Web is still largely underutilised. For the next stage of development of the MASE system, we will focus on the ontological modelling of epidemiology and the agent’s ability to read and analyse semantics. Some potential future directions are modelling ontologies for epidemiological data and models (e.g. in vector-borne diseases), extending the functionality of MASE’s semantic matchmaking and adopting methods of artificial intelligence planning.36,37 For example, more complex relations (such as ‘disjoint’, ‘intersection’, etc.) can be included, by which the MASE system will support more complex and detailed queries (e.g. being able to query over various date ranges). Another direction could be to develop an application layer in the MASE system by embedding Web Service Architectures that enable real-time data retrieval and process execution.
In conclusion, we regard the MASE as a promising approach that uses software agents and Semantic Web technologies to help public health decision-makers make better choices in terms of minimising manual effort, with a capacity to self-adapt to a changing software environment while outputting easy-to-understand solutions.
Footnotes
Acknowledgements
The authors wish to thank the two anonymous reviewers for their constructive comments that enhanced the work.
Declaration of conflicting interests
The authors declared no potential conflicts of interest with respect to the research, authorship, and/or publication of this article.
Funding
The authors received no financial support for the research, authorship, and/or publication of this article.