
Abstract
There is mounting pressure on healthcare planners to manage and contain costs. In rural regions, there is a particular need to rationalize health service allocation to ensure the best possible coverage for a dispersed population. Rural health administrators need to be able to quantify the population affected by their allocation decisions and, therefore, need the capacity to incorporate spatial analyses into their decision-making process. Spatial decision support systems (SDSS) can provide this capability. In this article, we combine geographical information systems (GIS) with a web-based graphical user interface (webGUI) in a SDSS tool that enables rural decision-makers charged with service allocation, to estimate population catchments around specific health services in rural and remote areas. Using this tool, health-care planners can model multiple scenarios to determine the optimal location for health services, as well as the number of people served in each instance.
Keywords
Introduction
The growing need for rationalized health service allocation
Governments worldwide are grappling with the combined pressures of escalating healthcare costs and decelerated economic growth. In 2010, the Organisation for Economic Co-operation and Development (OECD) reported that its member countries were experiencing a trend toward healthcare expenditures representing an increasing share of GDP. 1 While circumstances may vary from country to country, certain common drivers have been identified for this growth in healthcare spending, including a shifting demographic profile, increasing consumer expectations, and the evolution of technology.1–5 Globally, therefore, contemporary healthcare planners are beset by a number of competing and, at times, conflicting demands: to evolve service delivery to meet the needs of a population that is aging and increasingly contending with chronic disease; to embrace and deliver technological and procedural advances; and to practice sound fiscal management in the face of soaring costs.
Against this backdrop, there is a growing emphasis being placed on innovative and informed health services planning.6–8 Further, there is a heightened need, given current economic constraints, for this planning to be prescient. Sound decision-making must be grounded in current reality, yet employ a forward looking lens: 9 specific goals must be strategized and the means to attain those goals methodically developed. A critical component of contemporary healthcare planning is the rationalization of resource allocation in order to configure the supply of healthcare to maximize efficiency and coverage, while supporting system sustainability.6,9 Responsible decision-making about health service allocation must make every effort to realize the greatest return on increasingly limited resources, not only in the short term, but in the long term as well. 9
Therefore, healthcare decision-makers are under mounting pressure to anticipate both immediate and far-reaching solutions when rationalizing health service allocation. Their mandate is formidable: to balance the goal of maintaining a system that is effective and provides optimal quality of care, while ensuring that funding and resources are apportioned in a fiscally responsible and integrated manner, and do so in a manner that will render the greatest possible sustainable good across a variety of population needs. 10 For policy-makers and administrators at every level, the opposing forces of increased demand for basic and state-of-the-art services, and the decreased ability of governments to provide sufficient funding, has heightened the “. . . need for systematic, evidence-informed, transparent approaches to setting healthcare priorities”. 8 As healthcare administrators strive to find ways to stretch their healthcare dollars in an era of intensified demand for accountability, there is a requirement that decisions about health service allocations be founded on defensible, relevant data. Ready access to reliable, high quality data that delineates the needs of the population being served, as well as the existing capacity of the system to meet those needs, is vital for planning. 6 Armed with a comprehensive understanding of the status quo, planners must not only assess the current equation of supply and demand, but endeavour to anticipate how this equation might shift in the future.6,11
Understanding how current and future service capacity intersects with the demographic profile of the population is a critical component of forecasting. 11 This ability rests on having access to analytical tools that enable healthcare administrators to weigh options and identify the relative merits of a decision in advance of implementation in order to increase the likelihood that allocation decisions will support a health system’s on-going sustainability.6,12 Faced with the challenge of allocating scarce resources within a health region or jurisdiction, health services administrators need tools that allow them to explore options in service configuration planning so as to optimize their chance of identifying sustainable, long term solutions.
The added challenge of geography: Rural health service allocation
The need for rigorous, informed planning takes on a particular significance in nations who must rationalize health service allocation for a significant rural and remote population. These administrators are tasked with distributing healthcare services to provide the best possible coverage to a dispersed population. In doing so, they must make allowances for the actuality that many of these communities are somewhat isolated, often have limited health human resources and service infrastructure, and are typically geographically remote from secondary or tertiary care hubs.2,13
While not always sufficient to ensure access to care, geographic accessibility is, nonetheless, a necessary prerequisite. 14 Given economic, resource and geographic constraints, however, rural and remote administrators are not typically in a position to deploy a full range of healthcare services in each community. The current climate of fiscal conservancy encourages consideration of facility closures and service reallocations;15,16 rural facilities are often a target in rationalization exercises as they tend to be limited in scope of services and relatively expensive to run.16–18 It is critical, however, that discretionary decisions about the strategic siting of health services in rural regions factor in an understanding of the systemic interdependence of rural communities. Services must be situated to ensure the greatest number of people can access care in a timely manner. Investment in one site may necessarily be at the expense of another: this trade-off is apparent in the phenomenon of centralization of delivery, where key services are concentrated in a larger service hub in an effort to contain costs. 15 However, centralization necessitates greater travel, expense and disruption for people in the surrounding smaller communities.2,19
Given all of these considerations, rural healthcare administrators must endeavor to gauge the systemic ramifications of any service allocation decision: whether it be to open, expand, reduce or close a service, these decisions must consider the entire population affected, which typically extends far beyond local residents to encompass an outlying population as well. Understanding the size and spatial distribution of the rural population is crucial for effective healthcare planning, as these two factors can “. . . significantly influence the mode and form of service delivery”. 2 Having a tool that would allow these administrators to accurately estimate the population served by any given facility would be an invaluable asset in comprehensive regional service planning.
The role of spatial decision support systems (SDSS) in supporting rural health service allocation
Rural healthcare planners, charged with allocating services and managing resources over a geographic region, must have the capacity to incorporate spatial analyses into their decision-making process. With so much at stake and relatively few resources, it is paramount that these administrators have ready access to data needed to inform these decisions. Consequently, they have a need for a tool that provides the capability to draw on, and integrate, existing data on the distribution of their population, and the healthcare infrastructure and services in place to provide for that population. Further, in the interests of methodical, future-focused planning, such a tool should enable planners to configure and model various options in service allocations.
A spatial decision support system (SDSS) can provide this capability.20,21 Based on geographic information system (GIS) technology, SDSS tools are designed to collect, integrate and model spatial data. 22 Use of such a tool can allow healthcare decision-makers to explore questions with a critical spatial component, deciding, for example, where best to site a specific service in order to most effectively serve a widely distributed target population. An effective SDSS tool would provide rural decision-makers with a means of accessing relevant data from existing datasets and model prospective service configurations within and across their regions.23–25 An SDSS tool, powered by the intelligence and functionality of GIS, is an invaluable support in mapping the relationship between healthcare service delivery and geographic accessibility to those services.
Making SDSS accessible: the web-based graphical user interface (webGUI)
Having the ability to integrate accurate, timely spatial analyses into their decision-making processes is important for rural healthcare planners. Successful decision-making is founded on having the requisite skills, technology and administrative infrastructure to support the process.6,26 In order to incorporate an SDSS tool into their process, however, many healthcare planners have had to rationalize contracting with a GIS consultant. Alternatively, making the investment to bring the conventional GIS technology in-house has depended on the administrators having the adequate financial and technical capacity. In a highly pressurized environment of cost containment, these options can render the benefits of SDSS beyond the reach of many healthcare planners. A further consideration in a rural context is that team-based decision-making may require the facilitation of remote participation across multiple sites, creating a need for easy information sharing. In order to realize the potential of SDSS, rural administrators need a tool that is accessible in the broadest sense: it would require a minimum of technical expertise to employ; need only a basic technologic platform on which to run; and be designed in such a way as to facilitate the dissemination of findings across the decision-making team. This would afford health services administrators the opportunity to readily combine current, relevant data with the expertise and experience of their decision-making team, greatly improving the odds of creating a sound tactical plan to meet their region’s healthcare delivery strategy.
With data-informed decision-making, the extent to which a jurisdiction is resourced with both information systems and people trained to use those systems, can serve as a constraint. 27 For regional healthcare planners to readily adopt an SDSS tool, the threshold for both specialized resources and expertise must be lowered. Developing an SDSS tool that incorporates a user-friendly graphical user interface (GUI) can facilitate critical spatial modeling, employing fairly basic user interfaces requiring minimal training.22,27,28 Further, an SDSS tool that is web-based and runs on standard desktop platforms would be both highly accessible and cost-effective, allowing greater access to and participation in a GIS-informed decision-making process.22,29,30
Having the capability to draw on appropriate datasets and model service configuration scenarios as part of the standard decision-making process for rural health service allocation would provide decision-makers with greater flexibility to explore relevant options.31–33 For team-based decision-making processes, using an intuitive, web-based SDSS tool to model options and share information has been found to increase team participation and interaction,30,34 decrease the need for training,30,35 and reduce the need for overall facilitation of the decision-making process.22,36 In addition, having a tool that will graphically render this key relationship between rural populations and existing or potential services will also enable its users to incorporate these data, in a readily accessible format, into their regional performance reporting. In these ways, a web-based SDSS tool that allows rural healthcare planners to model the implications of proposed service modifications will go a long way to assisting in the management of the twin challenges of geography and population.
The Health Services Locator (HSL) webGUI
The Health Services Locator (HSL) webGUI is a web-based decision-support tool developed specifically to assist rural health administrators charged with making decisions about the location and allocation of health service resources in the Canadian province of British Columbia. By enabling them to map population catchments, it allows these decision-makers to generate answers to service allocation questions in-house, even if the team includes multiple stakeholders across multiple sites.
Canada is a country with a large rural and remote population; the 2006 national census found that roughly 20% of Canadians live in rural settings. 37 In the province of British Columbia, approximately 15% of the population is designated as rural. 37 Canada’s healthcare system is multi-tiered, with provincial governments bearing the overarching responsibility for the administration and delivery of healthcare for their populace. In British Columbia (a region covering an area larger than France), this responsibility is shared by five regional health authorities that must balance supply and demand in a manner that reflects both their constituency and their resources. The challenges facing these health authorities differ according to the size and distribution of their population and the extent to which their region is either urban or rural.
Under constant pressure to contain costs, Canadian healthcare decision-makers have placed hospitals under close scrutiny because of the magnitude of their cost to the system. As a result, hospitals deemed to be inefficient have been selected for closure or downsizing and repurposing. 15 In some rural Canadian jurisdictions, where the operating costs for smaller hospitals are often proportionately higher, and the capabilities more limited than their urban counterparts, closures have taken place, or hospitals have had their services reduced. 16 While these tactics may meet the demand for cost containment, they do not always facilitate equitable access for residents in regions with geographic barriers: those that are rural and remote and, in the case of British Columbia, often mountainous.19,38,39 For health authority administrators with a large rural population, ensuring timely access to services is a critical component of regional service allocation, especially for certain acute, time-sensitive services such as obstetrics, cancer treatment and trauma care.
Working to balance fiscal restraint with the provision of adequate services across a dispersed geographical base has created a need for these administrators to understand the critical relationship between location of services, depth of services provided and the distribution of the population. 25 To that end, the HSL webGUI has the capability of integrating existing datasets for rural hospitals and services with those of regional populations and road networks, making it possible for users to determine the percentage of population in a specific catchment served by a specific health service or resource.
With the current version of the HSL webGUI, policy-makers are able to select individual hospitals and clinics in non-metropolitan British Columbia and determine total populations within a one, two and four hour drive time of the services. In addition, the first release of the HSL webGUI has service level information for trauma services, obstetric services and provincial cancer clinics. This feature allows the selection of specific service levels (e.g. full obstetrics, general practitioner surgeon or midwife only) and the subsequent calculation of population catchments for these specific service levels. This permits quantification of service capacity by region, based on proportion of the population served.
Data and methods
Population catchments
The HSL webGUI works with population catchments, based on the percentage of the rural population within given travel times of the hospital or facility in question. It is important to note that in rural and remote settings, a service or hospital catchment is often congruent with a population catchment, reflecting the reality that there is typically “. . . only one ‘natural’ choice for patients, and it is dependent on travel time and geographic proximity”. 25
The catchments for the HSL webGUI quantify the population around a service, within one, two and four hour drive times—times based on the standards set by the British Columbia Ministry of Health, which specified the maximum acceptable distances to any given service in order that this service be accessible to 98% of the population within its respective health authority. 40 While the Ministry of Health originally defined these time limits (one hour for emergencies; two hours for acute inpatient services; and four hours for speciality services) based on ‘crow-fly’ or straight line distances, 40 the catchment areas for the HSL webGUI have been calculated using road travel time to better capture the experience of actual patients.
Data
The HSL webGUI integrates five existing datasets providing decision-makers with access to the most current data for British Columbia hospitals and services, roads, and population size. The British Columbia hospital data indicates presence or absence of various health services (e.g. neurosurgery, Intensive Care Unit). The British Columbia road network data provides real vehicle travel times, extracted from a value-added GIS data set, for travel in both directions. The British Columbia census block population data determines the populations within specific travel times of a hospital. Census blocks are the smallest demographic unit for which population counts are released to the research community by Statistics Canada; they correspond to approximately a half city block. Spatial data files corresponding to the five regional health authorities are used to enable users to contain their search to a specific health authority. Lastly, data from the British Columbia Census Metropolitan Area dataset were used to confine analysis to rural areas. From these data, a new suite of datasets was derived which include a health authority population table, and an origin-destination cost table that lists populations within one, two and four hour travel times to each hospital.
Analyzing the Health Services Locator (HSL) webGUI catchments
An origin-destination cost table containing census block to hospital travel times was generated using ESRI’s Network Analyst New OD Cost Matrix tool (in ArcMap 9.1). The catchments, or service areas, were created in ArcMap 9.1 using the Network Analyst New Service Area tool. Three maximum travel times were designated, defining the catchments as one, two and four hours. The original ArcMap version of the GUI could only be utilized by users with ArcGIS Desktop (software which includes the ArcMap application) installed on their personal computer. The data required for the hospital catchment maps and calculations also had to be located on the user’s computer, clearly limiting the functionality for the vast majority of potential users. The HSL webGUI circumvents these requirements.
From a server side perspective, the webGUI was created using ESRI’s ArcIMS 9.1 software. ArcIMS is a software application designed specifically for publishing interactive maps on the Internet. An in-house web server was used to serve the website. In addition, Java was used to develop the web application. The ArcIMS software was used in conjunction with Apache HTTP Server. As many of the ArcIMS components were built with Java, a Java Development Kit (JDK) and a servlet engine (Apache Tomcat) was also required.
It is possible to create a website using an ArcIMS template but this requires using javascript and ArcXML to add functionality. As creating the Hospital Catchment webGUI involved considerable coding for custom functionality, it was decided to create a custom web application using Java Server Pages. The Java Connector, which contains the ArcIMS Java Connector API JavaBeans, was used for this purpose. These JavaBeans and their associated methods can be used in Java code to implement map-related functions. The ArcSDE Java API JavaBeans were also used to query the tables in the Microsoft structured query language (SQL) database. The ArcSDE Java API was obtained from the ArcSDE Client software. The data were copied to a SQL database, which allows concurrent multi-user access, and an ArcSDE server functioned as the gateway between the database and the GIS software.
Significantly more information on the technical details of the analytical process is provided in Schuurman et al. 41 The goal of this paper is to demonstrate the utility of the webGUI to aid in making health services allocation decisions in rural and remote areas. This utility is demonstrated in the results below.
Results: Based on three sample scenarios
Access to obstetrical services
The HSL webGUI illustrates service capacity by region and by catchment, allowing hospital resource allocators to map obstetric, trauma and cancer care services against rural populations within pre-specified travel distances. The province of British Columbia mandates that access to core specialty services, including obstetrics, be available to 98% of a health authority’s population within a four hour travel time.40 The HSL webGUI provides a means of ascertaining the extent to which this mandate is served within non-metropolitan areas of British Columbia. A query to the HSL webGUI revealed that at the provincial level, the target of 98% has not quite been realized, with only 94% of the rural population living within the mandated four hour travel time to obstetric services. The webGUI can calculate and display the population that is within four hours of any established obstetrical services, as illustrated in the Catchment Report shown in Figure 1.
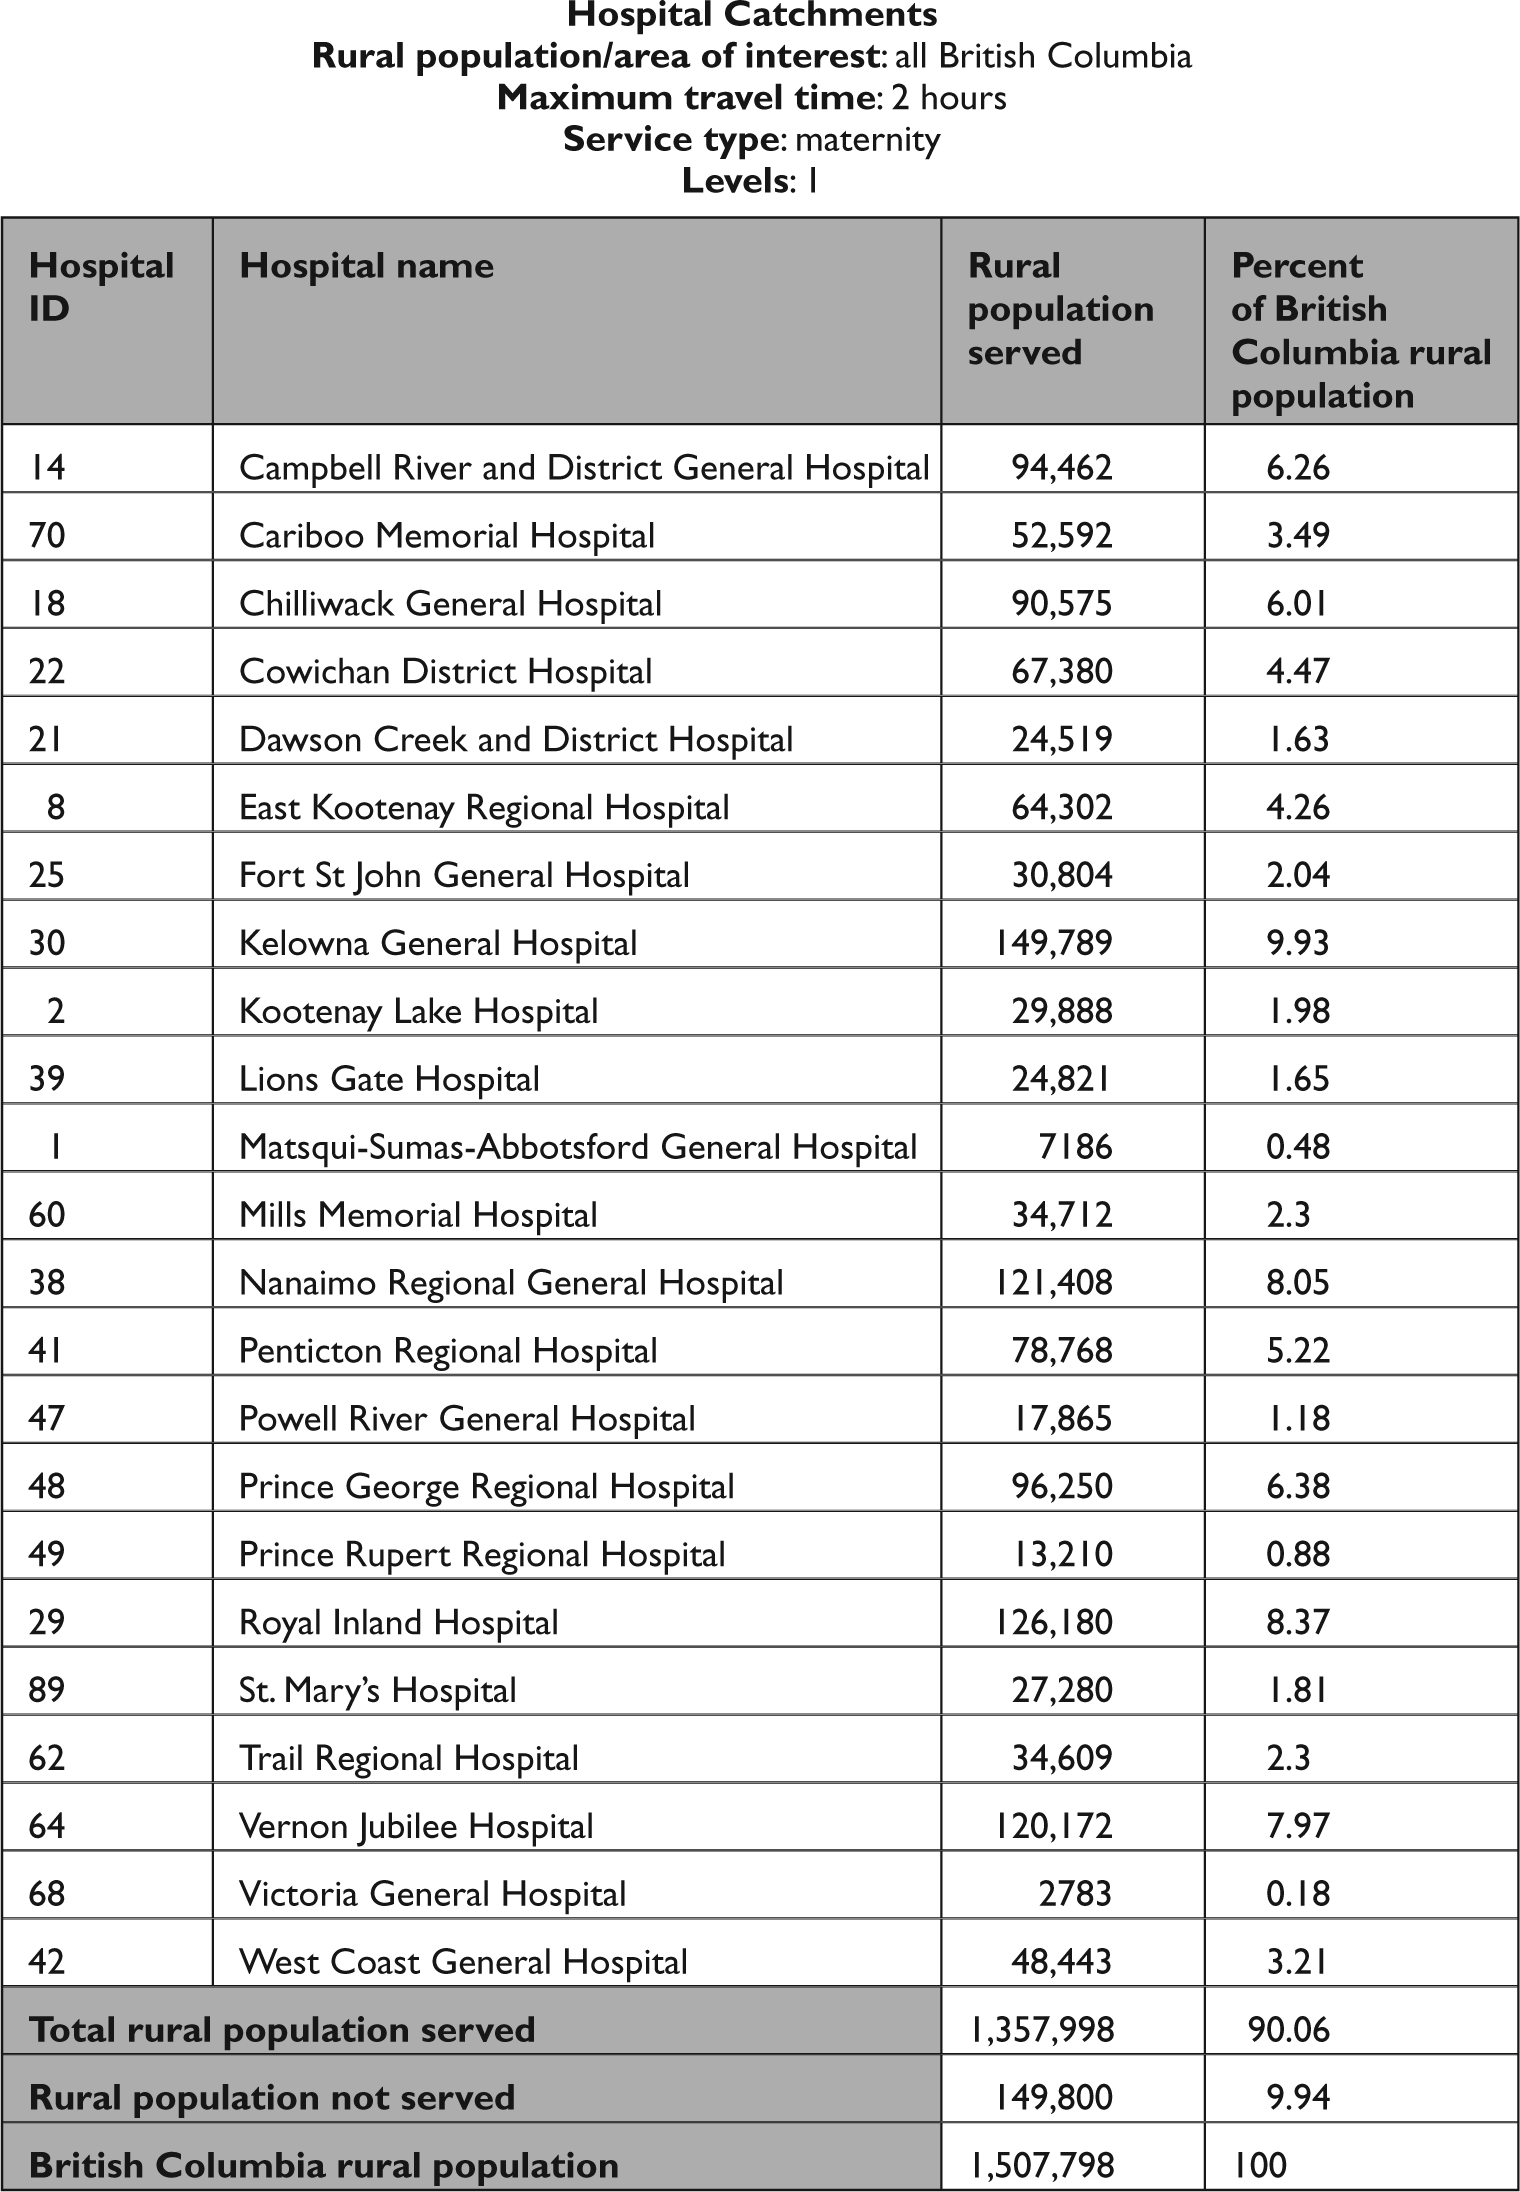
Catchment report generated by a request to the Health Services Locator (HSL) web-based graphical user interface (webGUI) to view all catchments in the province within a two hour road travel time of level 1 obstetrical services. Note that, although the province’s accessibility standards dictate that: “Access to basic inpatient hospital services will be available within two hours travel time for 98% of residents within the region”, just over 90% are actually within the mandated service area.
In addition to the Catchment Report, the results are displayed in map format in the main window of the webGUI. In Figure 2, the map of British Columbia is displayed with four hour travel time catchments shown around all hospitals that offer obstetrical services. From the map, decision-makers can quickly discern that the north-western coast of the province, including the Haida Gwai (Queen Charlotte) islands, is not well served by maternity services. The user can also click on the ‘i’ (information) symbol in the upper right of the webGUI and click on a square hospital icon on the map to determine the level of the maternity services, as well as the levels of other services, offered at that hospital. This information is the basis for subsequent modelling in which the user can hypothetically add or remove obstetrical services from a hospital and re-run the analysis to determine how well a new service configuration may serve the population.
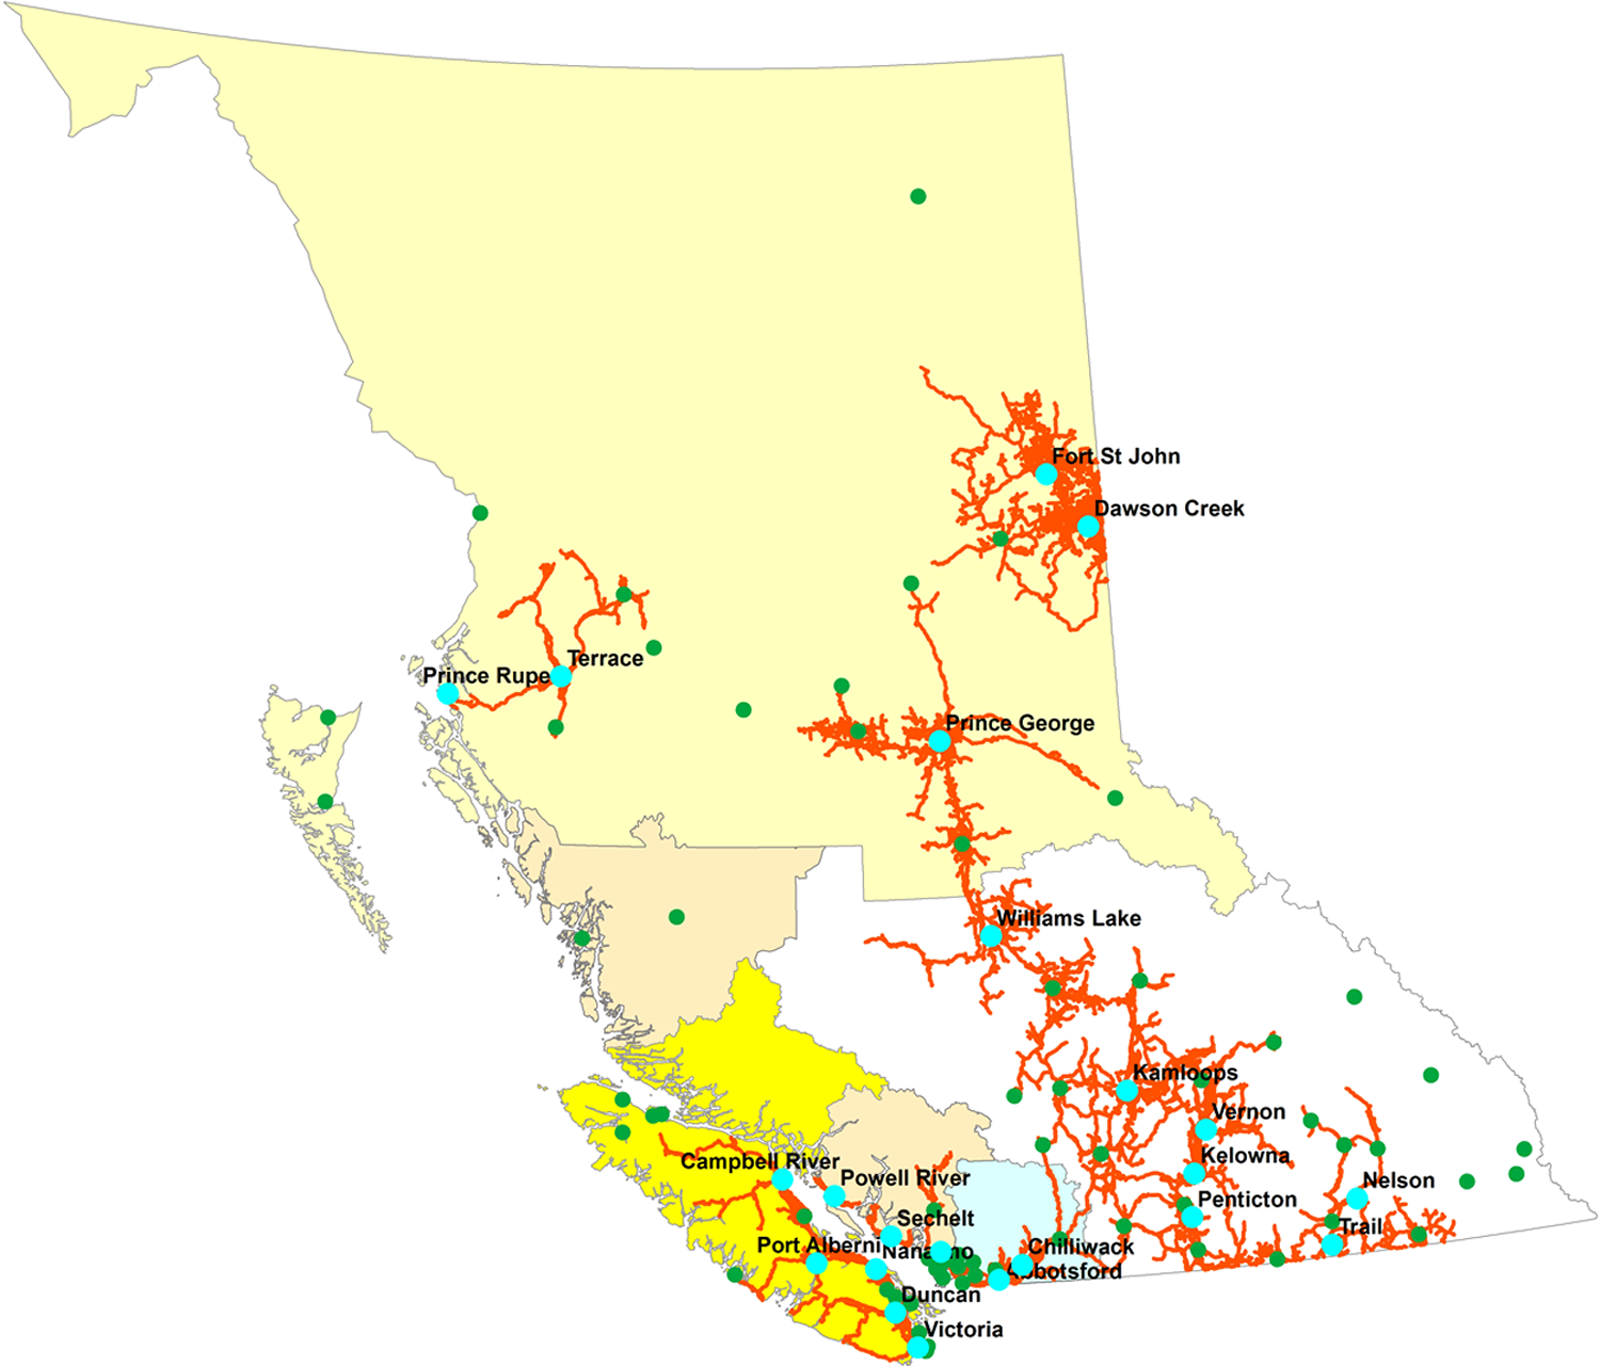
The resulting catchment map displayed in the main Health Services Locator (HSL) web-based graphical user interface (webGUI)window when the query to show two hour travel time catchments to obstetrical services is chosen. The user can identify which hospitals do not offer obstetrical services from the map. When a user zooms in, they can also view roads outside the two hour catchment. Note that the catchments have a snake like appearance: this is because they follow the road networks in the province. Figure 1 provides the population figures associated with the travel time catchments.
Access to trauma services
A second sample query addresses areas in the Northern Health Authority that are outside of one-hour-to-trauma services. There is evidence to support better outcomes associated with arrival at definitive trauma care within one hour of injury. 42 Termed the ‘golden hour’, this window represents the optimal total time from a severe injury event to care. In British Columbia, there are eight designated trauma hospitals, and trauma service levels are assigned based on the baskets of services available at designated hospitals. The HSL webGUI can calculate levels of access by population for any of the five health regions in the province, or for an aggregate area incorporating the entire province. In this sample query, we determined the catchment for the lowest level of trauma care (level 3 centre) in the Northern Health Authority. A level 3 centre has basic trauma certification with an emergency room, an intensive care unit, general surgery and orthopaedics, but lacks neurology services. There is no higher level of trauma care offered in the Northern Health Authority. As Figure 3 illustrates, access to trauma services is limited in this large geographical area, with close to 70% of the population outside the recommended one hour travel time to trauma care.
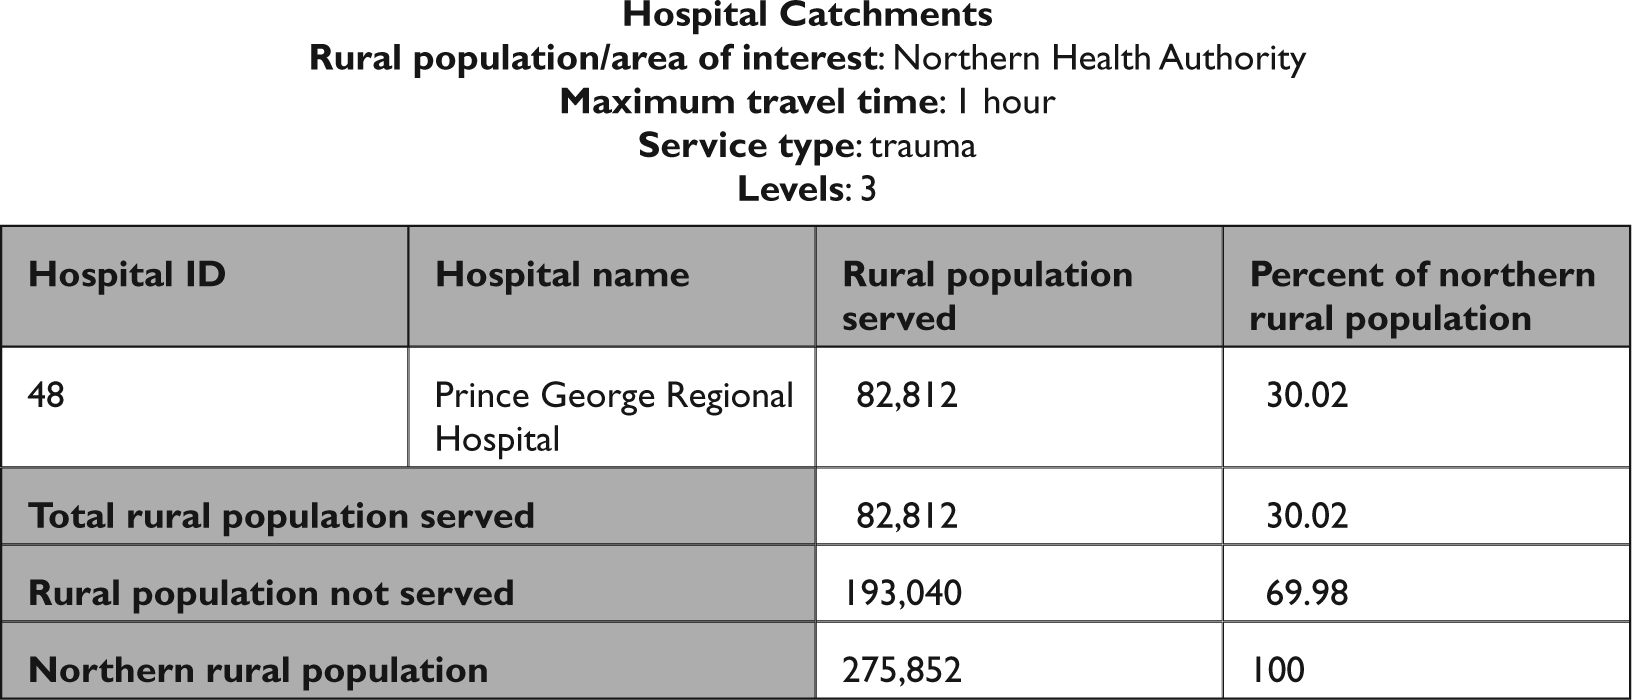
Catchment report generated by the query to find one hour travel time catchments for level 3 trauma services (limited to emergency room, intensive care unit, general surgery and orthopaedics) in the Northern Health Authority. Note that only 30% of the population in this Heath Authority has access to trauma services within the ‘golden hour’ for treatment of severe injury.
Access to provincial cancer centres
A final example of the utility of the HSL webGUI in generating data to inform allocation decisions is based on access to provincial cancer centres. Presently, the province of British Columbia has five fully functioning cancer centres. In addition, one is near completion and promises to be fully functional in the next two years. For the purposes of the webGUI, existing centres are considered ‘level 1’, while proposed centres are considered ‘level 2’. While cancer centres do not offer emergency care per se, it is clear that proximity is a priority for cancer patients and their families, so provincial queries were run for both one hour and two hour travel time. An analysis of current access to cancer treatment centres using the HSL webGUI reveals that only 19% of the provincial non-metropolitan population is within one hour of a cancer centre. A second query further reveals that just over 34% of this population has access to specialized cancer care within a two hour road travel time, as shown in Figure 4. Clearly, the relatively low level of access has policy implications. For instance, a study in New Mexico revealed that increased travel distance was associated with a lower likelihood of patients receiving recommended radiation therapy following breast conserving surgery for cancer. 43 Other studies have shown that patients who had greater distances to travel to radiation centres were less likely to undergo breast conserving surgery and more likely to have mastectomies.44,45
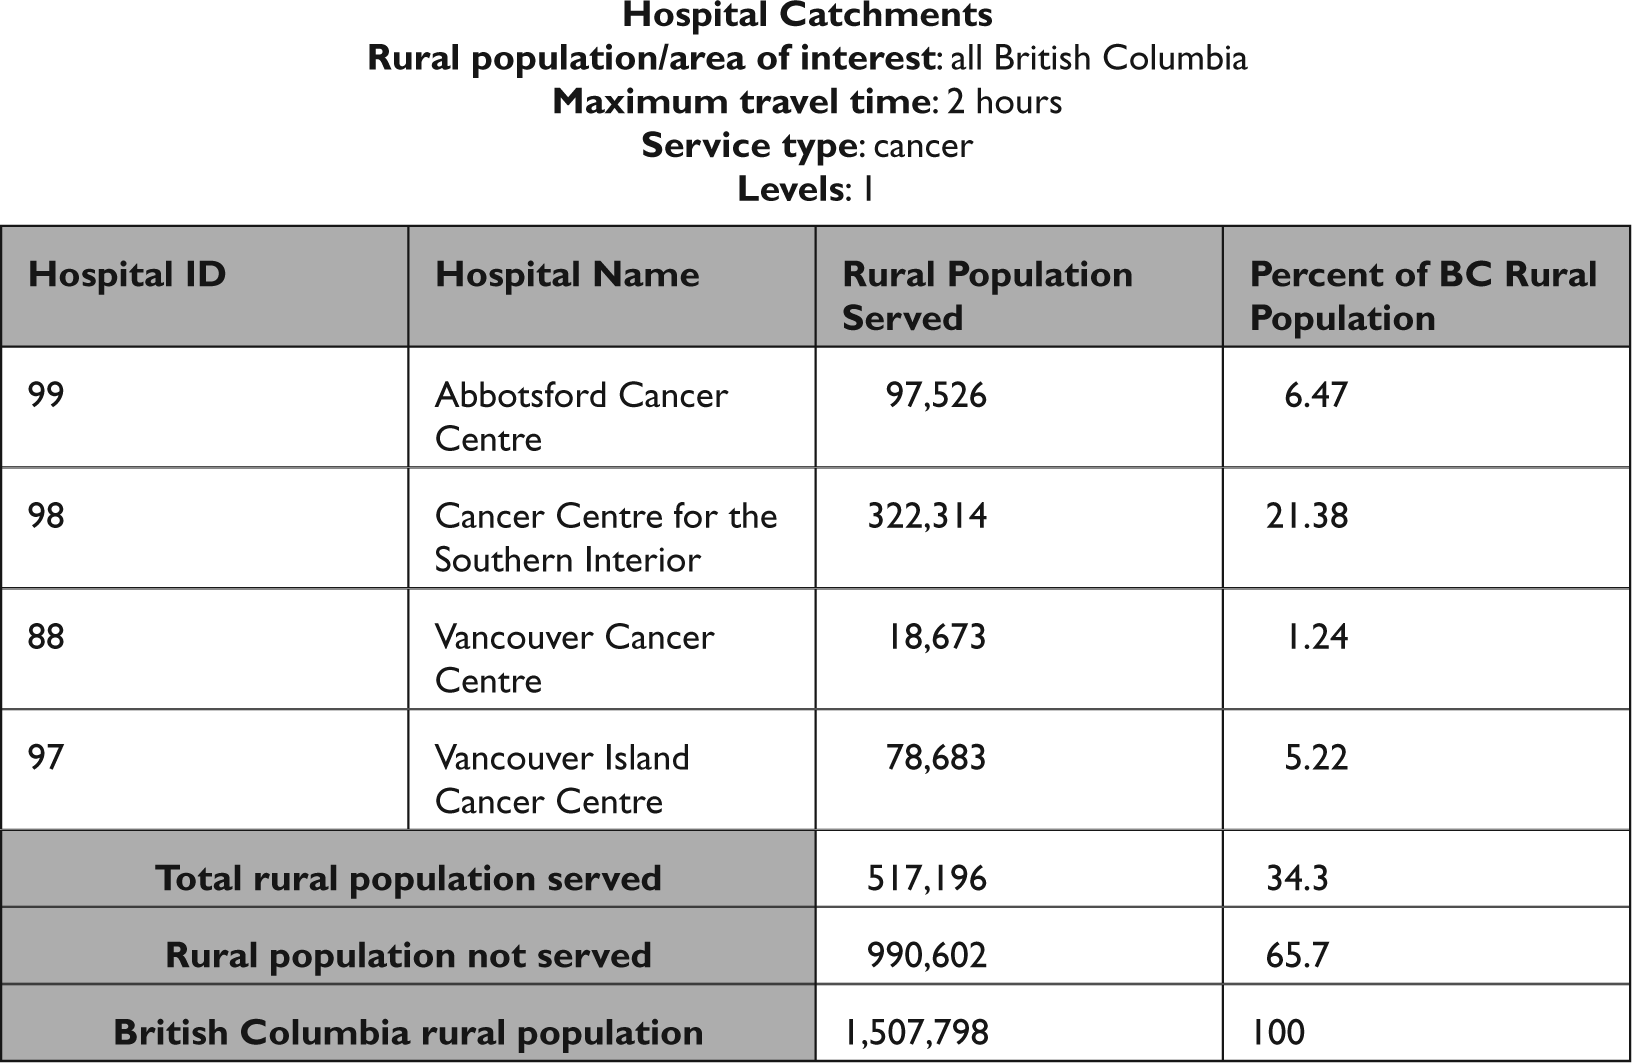
Accessibility to cancer centres in the province of British Columbia within two hours road travel time. There is a strikingly low level of access, with only 34.30% of the rural population able to access care within this window
The corresponding catchment map shown in Figure 5 reveals that even when a relatively long road travel time (e.g. two hours) is selected to existing cancer care, the northern part of the province of British Columbia is underserved.
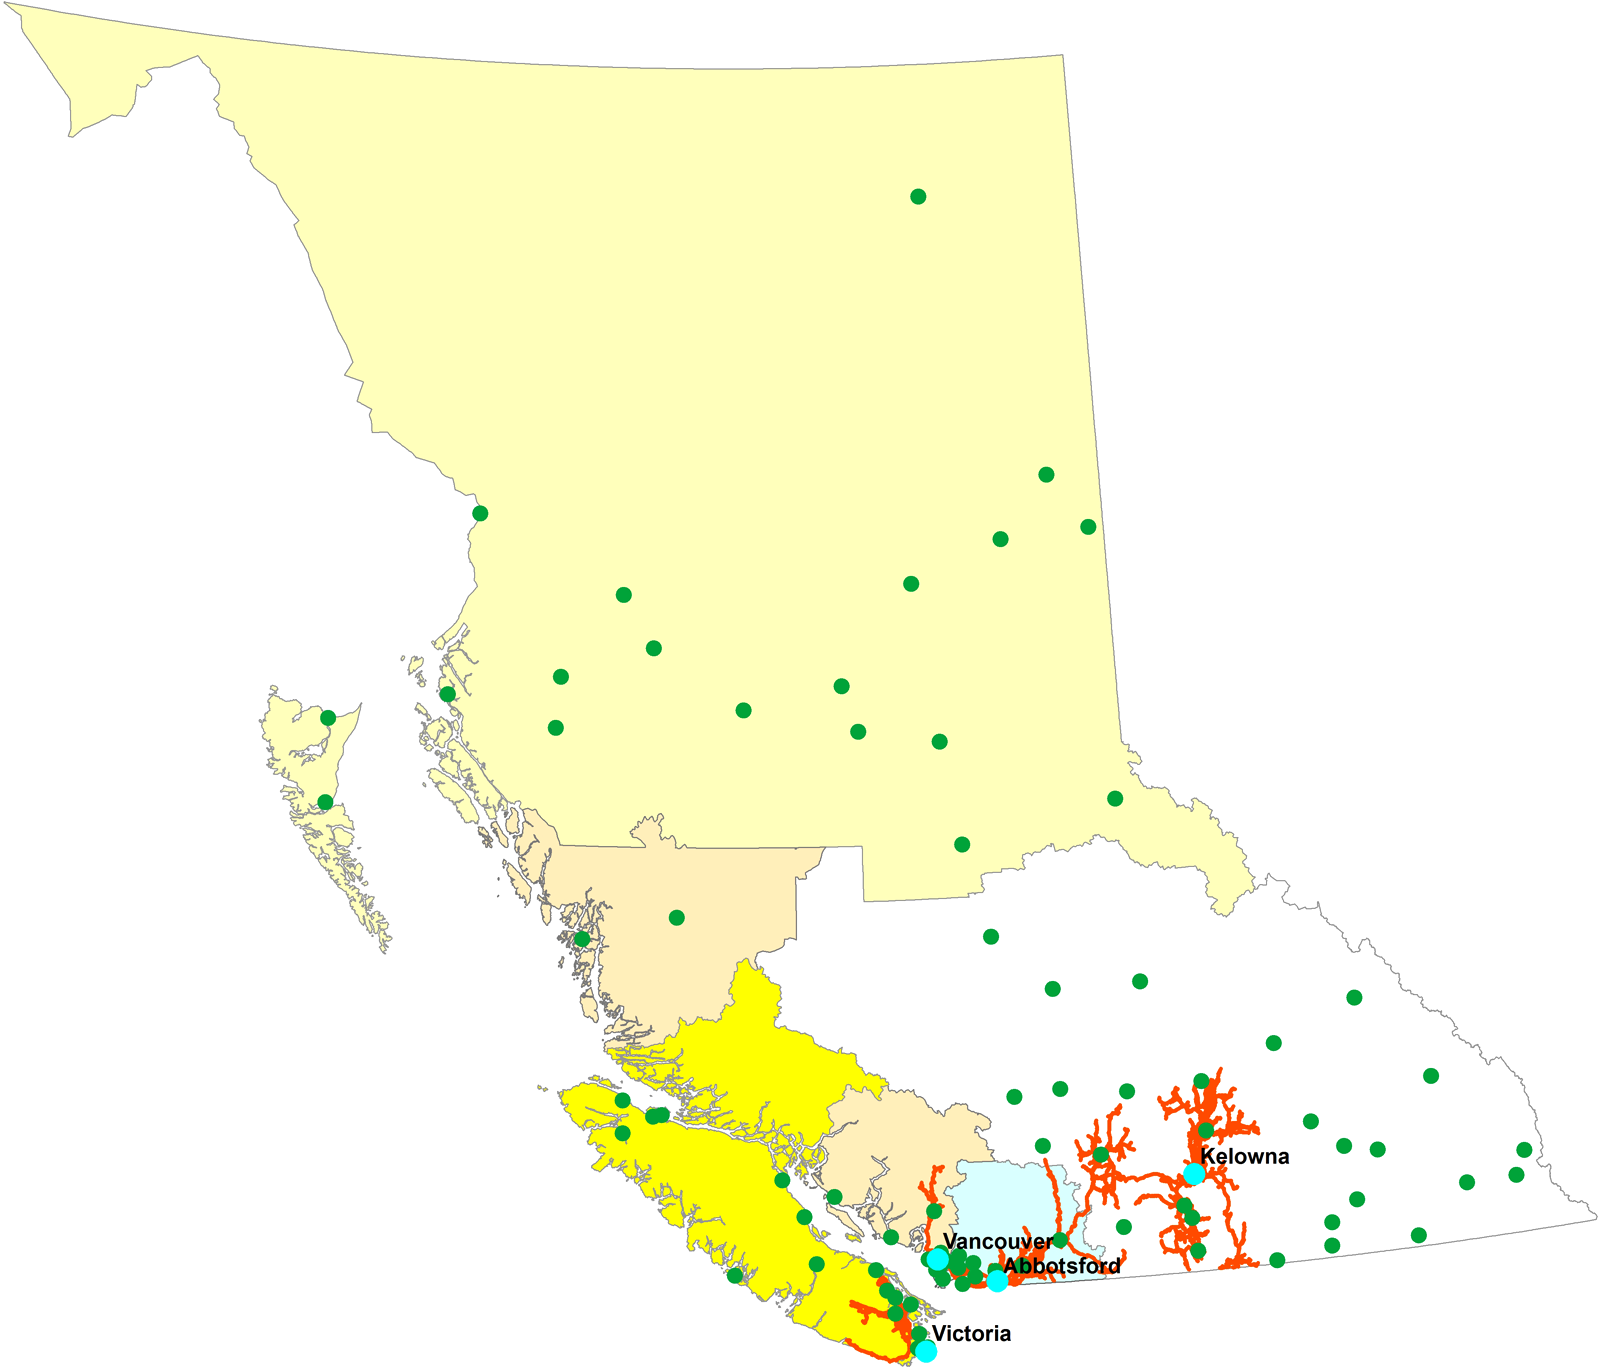
Map generated by a query to show the two hour road travel time catchment for access to cancer care in rural British Columbia using existing centres.
The sixth provincial cancer centre, soon to be opened, is located in Prince George, a city within this northern provincial health region. Notably, when the cancer centre in Prince George is included in the calculations, the proportion of the non-metropolitan population served within one hour will increase from 19% to 24%. The proportion of the non-metropolitan population within two hours road travel time also increases from 34% to almost 42%, a significant increase. While these increases in serviced population mark a move in the right direction, the HSL webGUI presents compelling visual confirmation of the on-going failure to achieve adequate service levels for a key health service within the travel timeframes mandated by the provincial access guidelines. 40
Discussion
Against the backdrop of growing costs, decreasing coffers, increasing demand for accountability and the need to deliver the best possible healthcare, rural healthcare planners have to invest in decision-making processes that will actively support their efforts to allocate services for their regions. A tool that allows easy access to relevant data—paired with the ability to use that data to model service options—can provide healthcare administrators with a vital assist to their decision-making process. For planners who must manage scarce resources within a rural context, the capability of undertaking accurate, timely spatial analyses of service allocations or reallocations, without the time and expense of contracting specialists or purchasing complex technology, is increasingly important. In settings where key stakeholders are likely to be geographically scattered across multiple sites rather than concentrated in metropolitan hubs, the capacity to readily share information across a decision-making team offers the opportunity to maximize participation, while at the same time reducing the overall time in administrating the process.
For these reasons, SDSS tools that enable healthcare administrators to work directly on scenario development are the most effective mechanisms for generating targeted, applicable information to assist the decision-making process. The ability of SDSS to capture data and provide spatial modelling functionality, employing a user-friendly web-based interface, will allow decision-makers to model service configuration options in-house. A tool like the HSL webGUI enables healthcare planners to both generate and disseminate information, and overcomes many of the barriers traditionally associated with data-informed decision-making. A web-based GUI has the advantage of being cost-effective and familiar to most users, as well as having the ability to link people across sites and platforms. 46 As decision-makers are already familiar with web browsers, there is the benefit of encountering a new tool within a highly familiar environment. These tools run on a standard platform, eliminating costs and other barriers associated with proprietary software and hardware: access is therefore possible at any time, in any place. The browser’s document mark-up language ensures that the visual representation of the information remains consistent across sites, regardless of platforms—a consistency that facilitates information sharing across distributed groups.
With the benefit of GIS technology, this webGUI provides the ability to map populations within preset road travel times, thereby providing metrics that directly pertain to the goal of ensuring a widely distributed population is served in an acceptably timely manner. While the British Columbia government currently defines standards for rural healthcare service access in terms of ‘crow-fly’ distance, 40 the HSL webGUI provides a much more realistic and meaningful measure based on actual road travel times. The standards based on straight-line estimates of driving distances have proven inadequate for predicting actual patient access time, especially in regions of British Columbia that are particularly mountainous.47,48 With a more realistic model at hand, decision-makers are better equipped to weigh the pros and cons of adding and subtracting services from existing hospital sites. The evaluation of current drive-time proximity to three core services revealed certain gaps in access that may warrant consideration of alternative service configurations. The HSL webGUI is also highly expandable; new modules reflecting other services, such as tubercolisis monitoring or pediatric care, can easily be added.
The HSL webGUI was designed to maximize its utility for rural healthcare decision-makers. Web-based SDSS tools can facilitate acceptance and uptake, and encourage a broader consideration of possible options. Stakeholders are more inclined to explore a range of options because they are able to control the definition of scenarios,29,33 and are able to do so with relative ease.31,32,49 A webGUI facilitates enhanced communication of the concept in question,50,51 especially important across a multi-site team. As a tool that offers both accessibility and affordability, a webGUI can reduce the time needed to orchestrate the decision-making process and it can encourage greater stakeholder involvement in health service decision-making.22,35,36,52 In addition, this tool provides users with the opportunity of integrating these data, in an easily understood visual format, into their performance reporting, thereby supporting the requirements for administrators to rationalize and account for their decisions. Beyond internal reporting, there is also the potential for these service configuration data and maps to be used to inform the public about service accessibility, through health authority publications and websites.
Limitations
A web-based SDSS tool of this nature is not without limitations. As a consequence of being generally accessible, there is necessarily a degree of compromise in terms of the number of possible scenarios that can be generated. There are limits to the tool’s ability to accommodate multiple variations. A webGUI may not, therefore, be capable of representing all forms of evidence desired by the team of decision-makers. There is also the potential for bias in the model, or models, selected in that they may represent relationships which are considered fixed in one discipline, while not being so in others.53,54 These trade-offs can impose constraints on the objective of comprehensive decision-making.28,51 Experts familiar with using SDSS tools may be frustrated by the lack of control they will have in designing problem representation.35,55 This shortcoming, however, can usually be overcome by the development of an expert webGUI that offers that increased functionality and a greater ability to control modelling. 28
A further consideration is that the current version of the HSL webGUI only models services that are facility-based, for which service data are readily available. There may be other key services under consideration that are community-based, for which service data are not available. Finally, while the HSL webGUI provides rural healthcare planners with invaluable information about the spatial distribution of services, it is important to remember that establishing good geographical access is not always sufficient in ensuring equitable access to care for all members of the population. To make a sound service allocation decision, health planners also have to consider other factors that affect a population’s ability to realize access, including its relative level of deprivation.
Conclusions
Contemporary healthcare planning is beset by many challenges, not least of which is rationalizing service allocations in order to responsibly provide the most equitable and comprehensive health service coverage possible. In rural and remote regions, health administrators must balance the sometimes conflicting demands of cost containment and timely access to care for a geographically dispersed population. Rural planners must be able to predicate their decisions about siting and resourcing services on a thorough, population-based spatial understanding of their region, necessitating access to relevant, high quality data about their populations, their facilities and their services. Further, these administrators require the means of using these data to model the implications of various service configurations in order that healthcare planning stands the best chance of contributing to equitable, sustainable delivery of care.
The HSL webGUI harnesses the strengths of GIS technology in a highly operable manner that makes spatial analysis of access readily available for healthcare decision-makers. With the pressures of increasing demand and constrained budgets necessitating a fiscally sound, carefully calibrated approach to healthcare delivery, reconsidering locations of services is often a means of achieving heightened efficiency by concentrating both human and technological resources.16,38 The cost-benefits of locating or relocating services must, however, always be balanced against ensuring certain services are accessible within a given timeframe. This consideration is particularly relevant for trauma, cancer care and obstetrical services. The HSL webGUI, therefore, allows those charged with allocating these services in regions where travel time is a key factor, to model service-specific scenarios to determine what proportion of the population will be served within mandated timeframes. With the capability of removing or adding hospitals altogether, decision-makers can get an immediate visual representation of the impact on the population currently served within a catchment area. Designed to be expandable, the HSL webGUI has the capacity to add additional service modules and, for more seasoned users, can be developed into an expert version, allowing for greater user control and customization. Intuitive, platform-independent, and accessible round-the-clock from any location, the HSL webGUI signals a new potential for SDSS tools in healthcare planning, enabling healthcare decision-makers, regardless of experience, to make informed decisions about the most effective distribution of healthcare services for populations in rural and remote regions.
Footnotes
Acknowledgements
The authors would like to thank the Canadian Institutes for Health Research (CIHR) Grant #149353 for invaluable assistance, as well as the Michael Smith Foundation for Health Research (MSFHR) for its continued research support. In addition, Justin Song provided invaluable technical services, without which the webGUI would not be possible.
The authors have no competing interests.