
Abstract
Objectives:
To develop an automated risk prediction model to identify elderly patients at high risk of emergency admission to medical wards within 28 days following an index hospital visit.
Methods:
A retrospective data analysis of 41 hospitals and 48 specialist outpatient clinics in Hong Kong. The study subjects were elderly patients aged 65 years or above, who had index hospital visit(s) in the year of 2005, which included hospitalizations at medical wards and attendances at the accident and emergency departments or specialist outpatient clinics for medical conditions. Multiple logistic regression was used to estimate the risk of emergency medical admission in 28 days after an index hospital visit. Model validation was performed against the complete cohort in 2006.
Results:
Over a million of episodes were included in the derivation cohort. A total of 14 predictor variables included patient socio-demographics, service utilization in the previous year, presence and number of chronic diseases and type of index episode. The model has a good discriminative ability with the area under receiver-operating characteristic curve at 0.819 and 0.824 for the derivation and validation cohorts, respectively. The model has a sensitivity of 70.3 per cent, specificity of 78.4 per cent, positive predictive value of 21.7 per cent and negative predictive value of 96.9 per cent.
Conclusion:
This simple, accurate and objective risk prediction model has been computerized into an automated screening tool to recruit high-risk elderly patients discharged from all public hospitals in Hong Kong into the Community Health Call Centre service with an aim to prevent avoidable hospitalizations.
Introduction
In 2010, the elderly population (aged 65 years or above) of Hong Kong amounted to 912,000, representing 13 per cent of the territory-wide population of 7 millions. The Hong Kong Hospital Authority (HA) manages all public hospitals in the territory. Similar to other countries’ experience,1,2 there has been an upward trend in emergency inpatient admissions to public hospitals among the elderly, exerting a huge pressure on the healthcare system. In the past decade, elderly emergency admission episodes increased from 247,000 in 2001 to 313,000 in 2010, of which at least two-thirds were admitted to medical wards. Among the elderly medical inpatients, more than one in five had an unplanned readmission via accident and emergency departments (A&EDs) within 28 days, which is comparable to the rates observed worldwide.3 –8
Is this phenomenon an inevitable consequence of an ageing population or does it underline a lack of proactive, coordinated and holistic care, which if addressed would reduce emergency admissions?1,9 To tackle this problem, the Hong Kong HA piloted a Community Health Call Centre (CHCC) programme 10 (which was formerly named as Hospital Admission Risk Reduction Program for Elderly) in Hong Kong in 2007/2008. The CHCC programme is an upstream community care intervention aiming to prevent avoidable emergency admissions of elderly patients. An important process in the programme implementation is the early identification and recruitment of appropriate target subjects for the service. Within the HA system, this case-finding process can capitalize on the huge repository of patients’ medical and administrative records within its information technology infrastructure which covers all of HA’s 41 hospitals, 48 specialist outpatient clinics (SOPCs) and 74 general outpatient clinics for the past two decades and contains 9.6 million personal records. 11 This study aimed to develop an automated risk prediction model to quantify the probability of an emergency medical admission within 28 days following an index hospital visit by an elderly patient, which includes hospitalisation and attendance at emergency or specialist outpatient departments. The intended application is, through automation of the prediction algorithm, to output a daily discharged patient list with predicted risk score for screening. Subjects categorized as high risk based on the predefined risk cut-off level are recruited into the CHCC programme and receive active disease management by a telecare nurse within 48 h of discharge.
Methods
Study design and population
This was a retrospective analysis conducted in 41 hospitals and 48 SOPCs serving a population of 7 million people in Hong Kong. Complete information pertaining to individual elderly patients and associated episodes was sourced from different information systems, which include patient administration and department systems and Clinical Management System (CMS), which is the same common electronic medical recording system used by all institutions in the public health sector. They provide complete and up-to-date patient data under the existing HA’s information technology infrastructure. Every day, patients’ medical and administrative records from these information systems are downloaded onto a corporate data repository where these raw data are transformed into database structures more suitable for data analysis and where data standardization in terms of definition and classification across all HA institutions can be performed for selected data items.
There were four types of index hospital visit: (1) A&ED attendance for medical condition without admission, (2) admission to medical ward via A&ED, (3) elective admission to medical ward and (4) attendance at medical SOPC. Patient transfer from an acute hospital to another hospital for sub-acute care was linked up as a single hospital episode, counting one discharge at the point of departure from the public hospital system. The complete data sets of these four types of index episodes, with a ‘discharged alive’ outcome, within the year of 2005 were used as the derivation cohort. The corresponding data sets in the year of 2006 were used as the validation cohort.
Statistical analysis
For each individual index hospital visit, a longitudinal tracing of the following 28 days was performed to determine whether it had entailed an emergency medical admission to any HA hospitals. Emergency admission to medical wards within 28 days following an index hospital visit was defined as the adverse outcome and hence the risk event in this study. Hence, while an emergency admission episode is counted as an adverse outcome of a preceding index episode, it is also regarded as an index episode for subsequent tracing of risk event in the next 28 days. Multiple logistic regression was used to model the relationship between the risk event and a host of predictors based on the derivation cohort with a complete coverage of index episodes in 2005. Each regression coefficient was the estimated increase in the log odds of the risk event per unit increase in the value of the respective predictor after controlling for all other predictors.
The potential predictor variables for model fitting were initially selected on grounds of clinical relevance, sourced from literature review and advised by an expert panel of geriatricians from seven acute hospitals. The variables were subsequently shortlisted based on their statistical significance in the regression model and sustainability of data quality over time. The area under receiver-operating characteristic (ROC) curve through a c-index was computed to assess model discrimination performance. Model validation was performed against the complete cohort in the year 2006. The area under ROC curve for this validation data set was also computed and compared against the derivation data set to further evaluate the model’s discrimination performance. Using the Hosmer–Lemeshow statistic and a graphical plot, the expected number of risk events was compared against the actual number by decile of predicted probability under the validation data set to assess the model calibration performance. At a defined cut-off point for dichotomizing between high and low risk, the model’s sensitivity, specificity, positive predictive value (PPV) and negative predictive value (NPV) were compared between the derivation and validation data sets. This cut-off point was chosen based on a sensitivity analysis on all pairs of sensitivity and specificity on the ROC curve which were computed by varying the cut-off incrementally by 0.001 over the high–low range of predicted probabilities. To inform planning and scoping of the target subjects for the pilot CHCC programme, the four types of index episodes were then compared in terms of specificity, PPV and NPV on a subgroup basis by controlling the respective sensitivity level same as the overall group’s sensitivity. All statistical analyses were carried out using the SAS version 9.1 software.
Results
Baseline characteristics in derivation and validation data sets
There were similar numbers (1.17 million) of index episodes included in the analysis under the derivation data set (year 2005) and validation data set (year 2006). The distributions of episodes by gender, age group and type of index episode were comparable between the derivation and validation data sets (Table 1). Males and elderly aged 65–74 years accounted for almost half of total episodes in each year. The percentage distribution by type of index episodes was as follows: A&ED attendance for medical condition without admission (11%), emergency admission to medical ward (14%), elective admission to medical ward (5%) and attendance at medical SOPC (70%). Subsequent medical emergency admission to any HA hospital within 28 days occurred in 7.8 and 7.6 per cent of total index episodes in the derivation and validation data sets, respectively (Table 3).
Baseline characteristics of the study episodes.
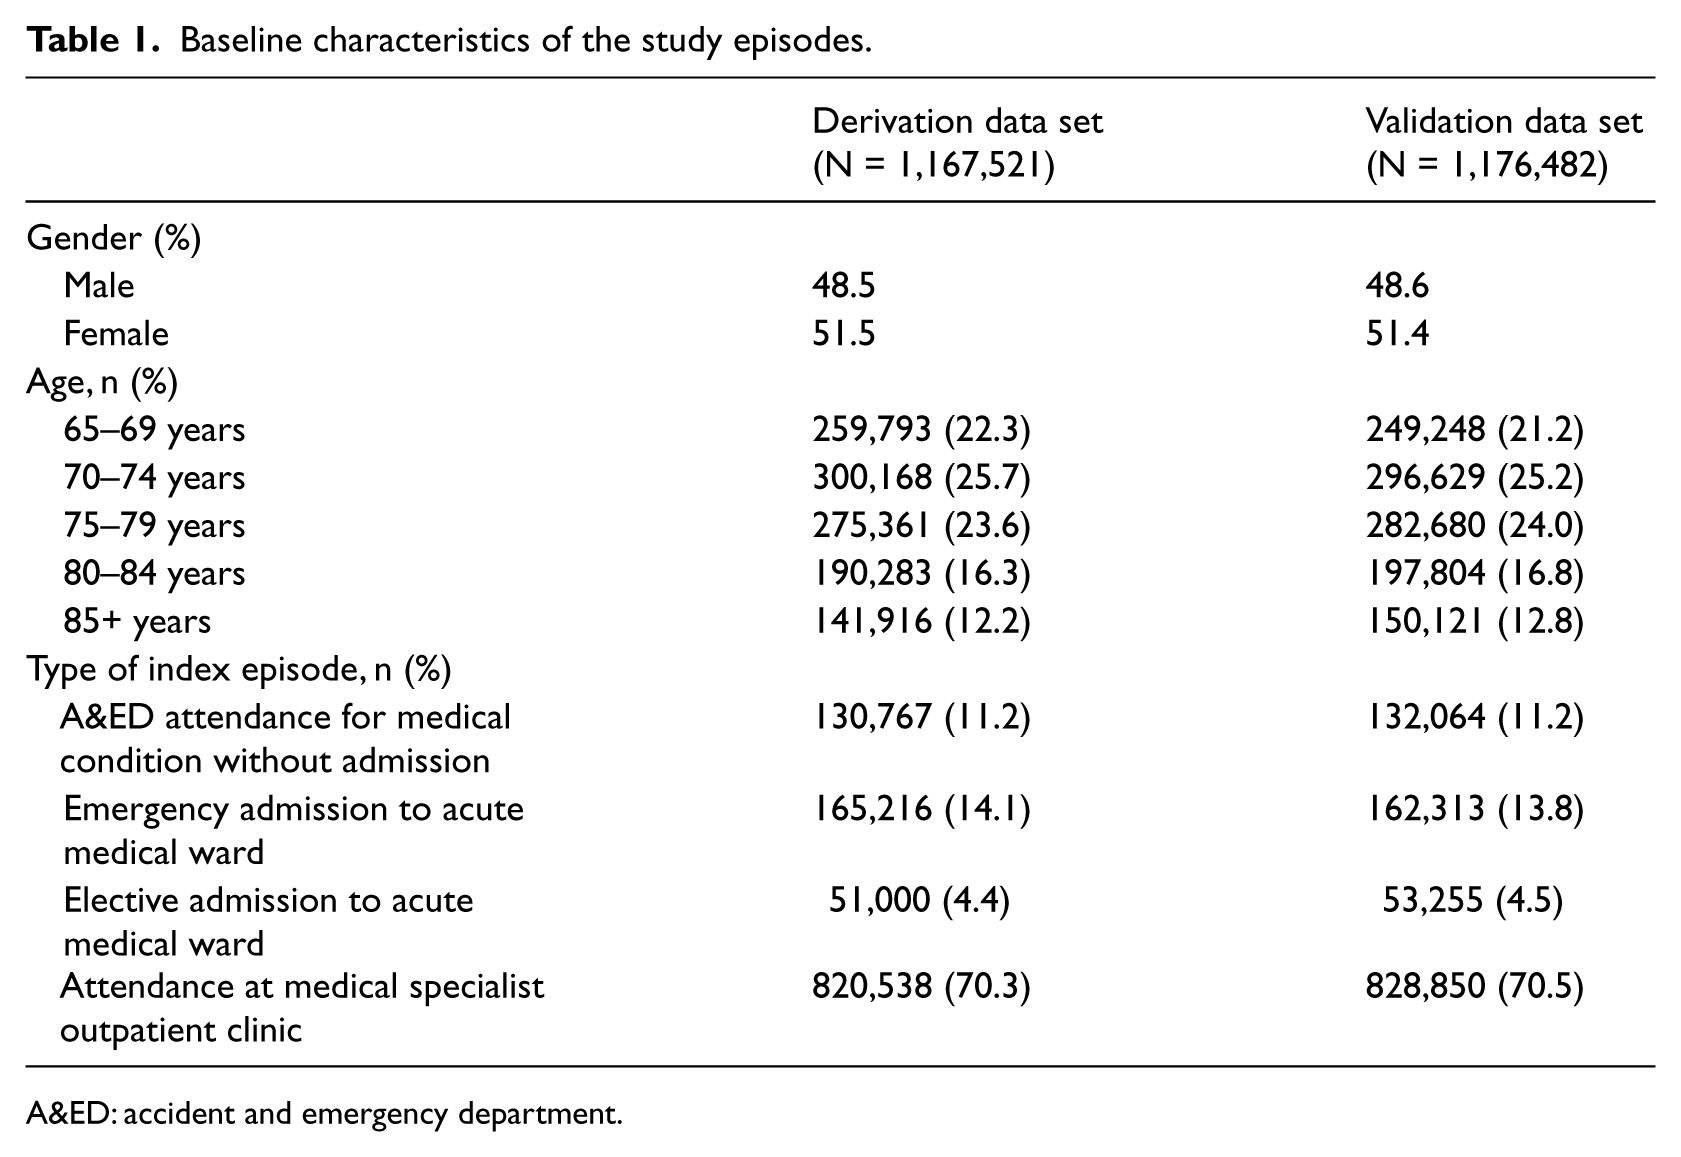
A&ED: accident and emergency department.
Predictor variables
A total of 23 variables were initially fitted into the model, all achieving a p-value < 0.05 with the exception of one variable. The model results were thoroughly reviewed by the expert panel which made a consensus to shortlist the variables which were most clinically and statistically significant and whose data quality was assessed to be at a sustainable high level over time. The final model consisted of 14 predictors, each with a p-value < 0.0001. The predictors were grouped into four categories: patient socio-demographics, utilization of inpatient and emergency department services in the past 1 year prior to an index episode, presence and number of co-morbidities and type of index episode. Despite the removal of nine variables from the original model, the model’s predictive performance measured by c-index was only marginally reduced by 0.002 in absolute magnitude.
The adjusted odds ratios of these 14 predictor variables are shown in Table 2. Social security allowance, male gender and advanced age were significantly associated with a higher risk of admission through the A&ED in the next 28 days. Age was fitted as a continuous variable into the model since the log odds increased linearly with age. The higher the frequency of prior utilization in the past 1 year of A&ED attendance without admission, emergency admission, acute as well as non-acute patient days, the higher the risk as reflected in the relativity between odds ratios. The following co-morbidities are also risk factors significantly predicting higher risk for a 28-day emergency admission: presence of chronic obstructive pulmonary disease (COPD), heart failure and cancer, treatment of renal dialysis and number of diagnosis groups an elderly patient had based on a consistent classification rule. The fourth category of predictor variable was the type of index episode. Among the four types, emergency admission had the highest risk entailing another emergency admission within 28 days, with an odds ratio of 2.595 (95% confidence interval (CI) = 2.546–2.645), followed by A&ED attendance without admission (odds ratio = 2.468, 95% CI = 2.406–2.532) and elective admission (odds ratio = 1.814, 95% CI = 1.768–1.860) in comparison with the reference group of SOPC attendance.
The 14 predictor variables under the multiple logistic regression model.
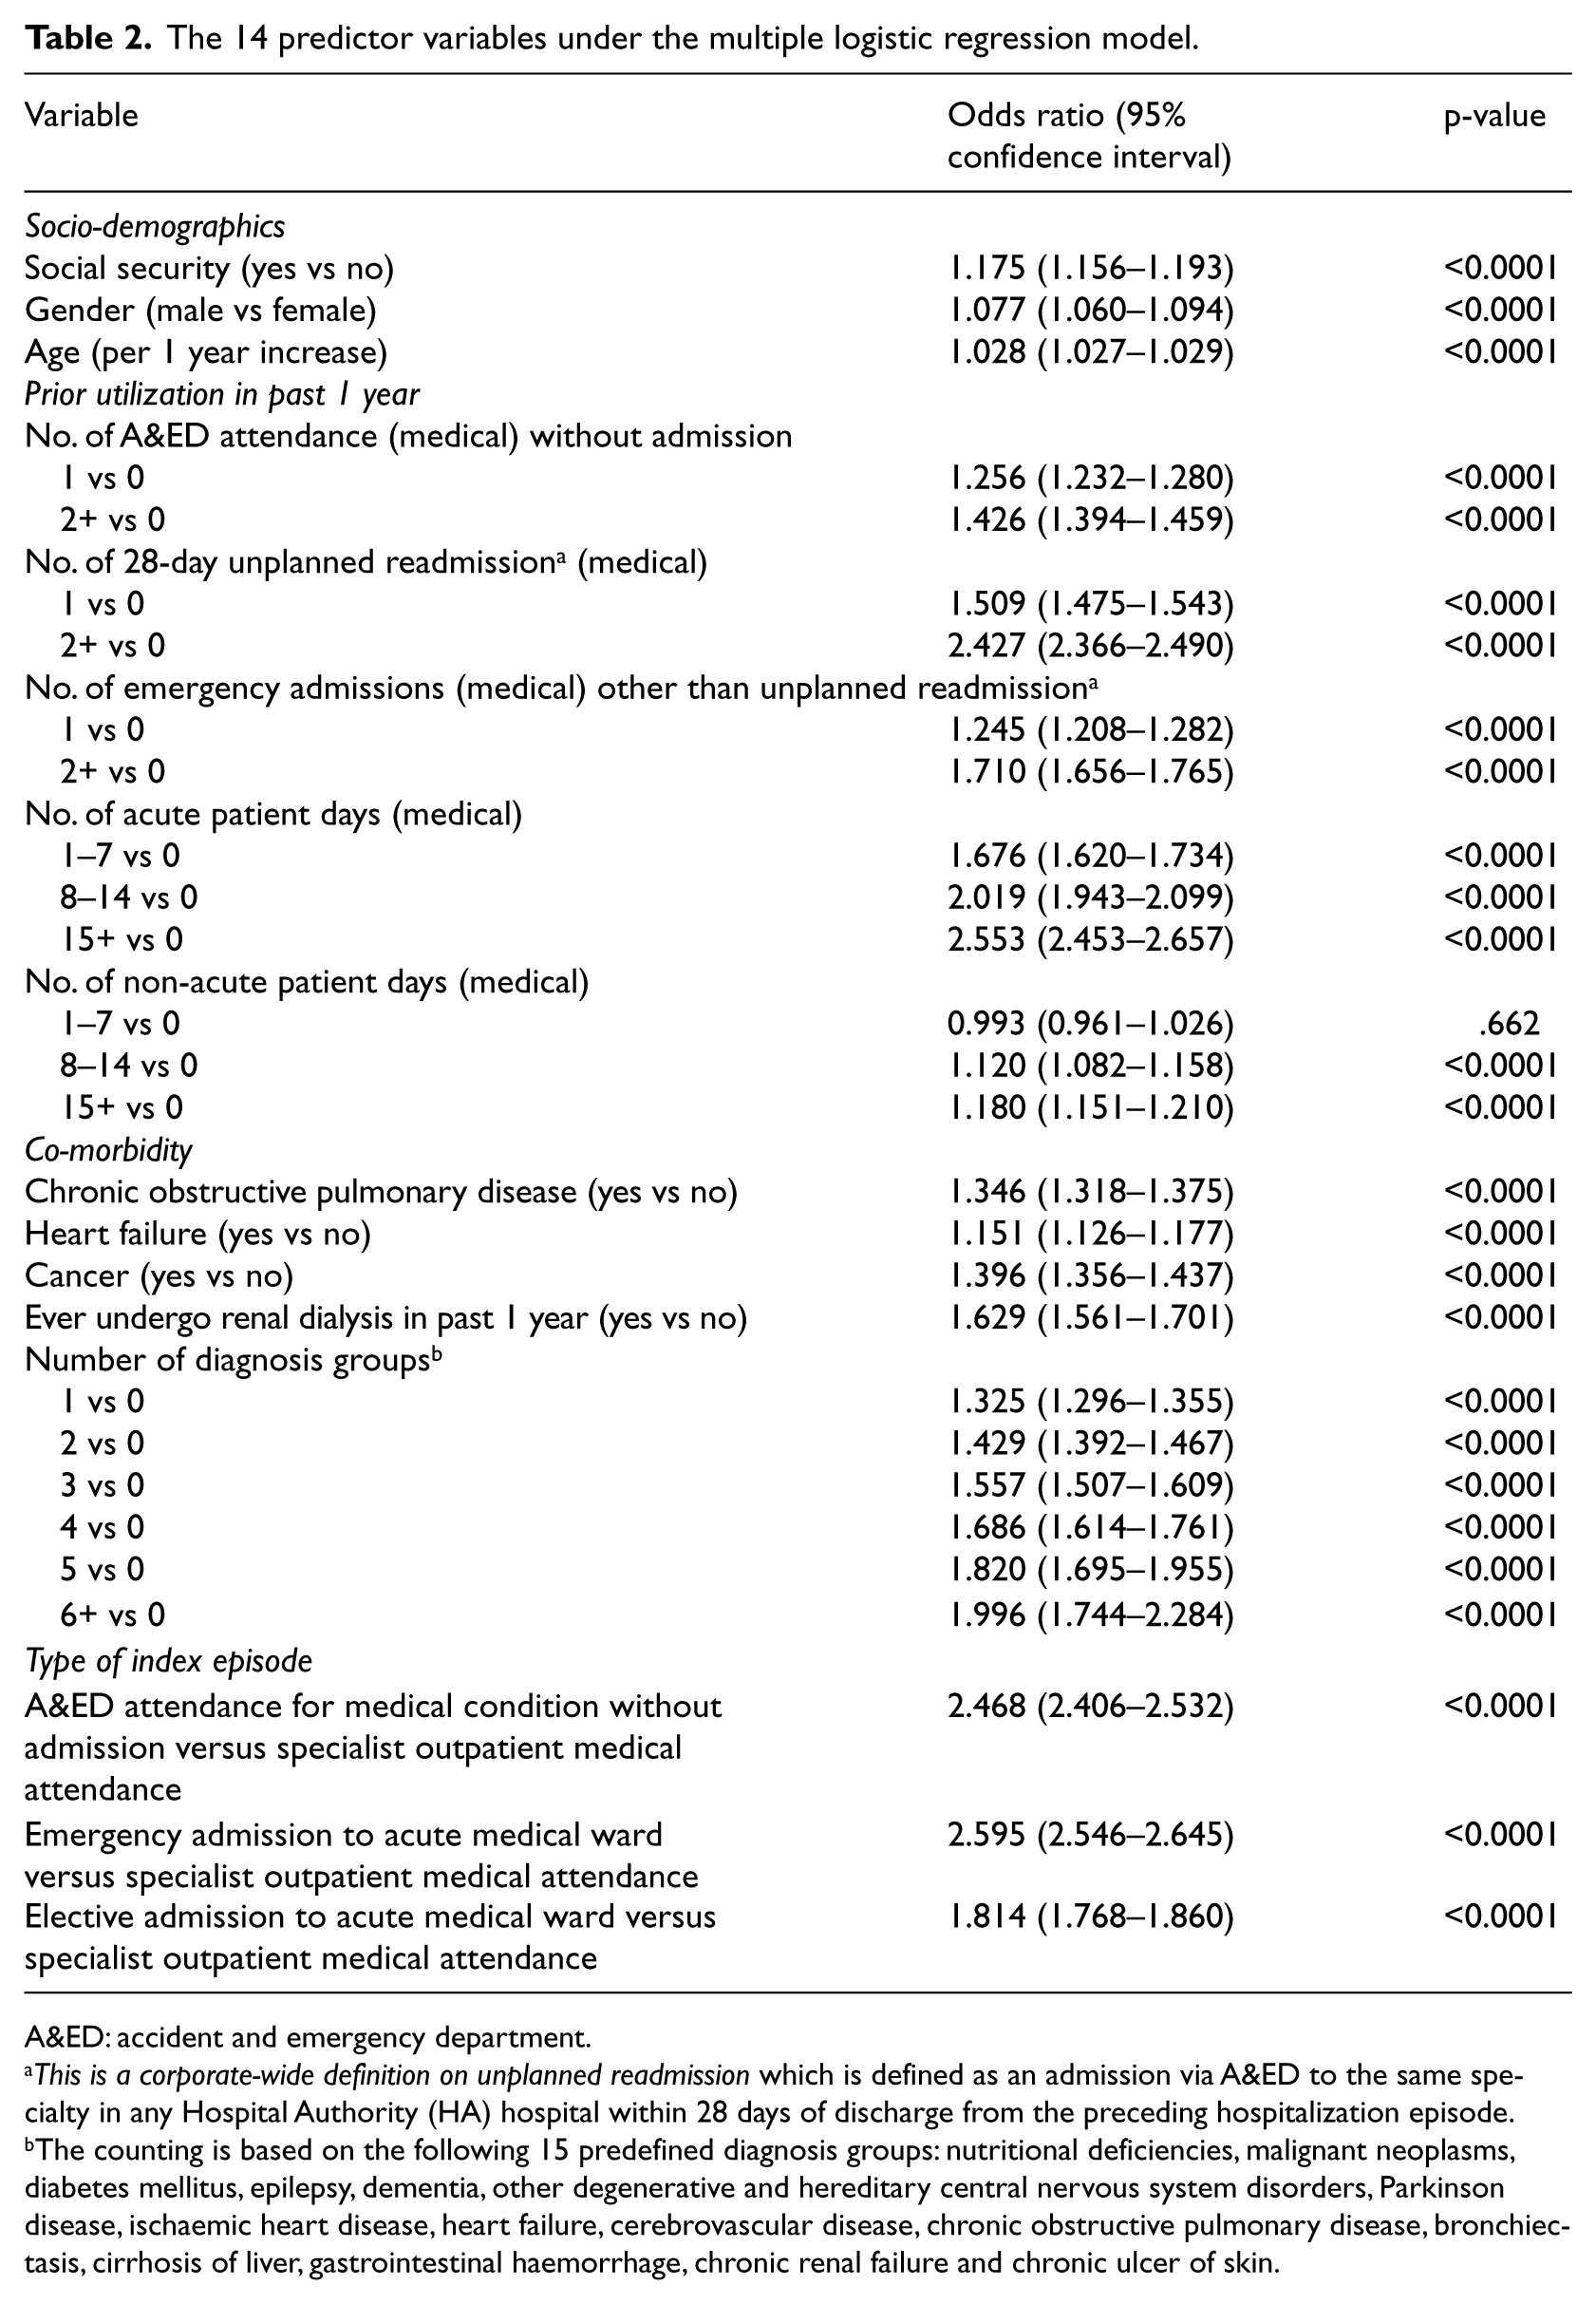
A&ED: accident and emergency department.
This is a corporate-wide definition on unplanned readmission which is defined as an admission via A&ED to the same specialty in any Hospital Authority (HA) hospital within 28 days of discharge from the preceding hospitalization episode.
The counting is based on the following 15 predefined diagnosis groups: nutritional deficiencies, malignant neoplasms, diabetes mellitus, epilepsy, dementia, other degenerative and hereditary central nervous system disorders, Parkinson disease, ischaemic heart disease, heart failure, cerebrovascular disease, chronic obstructive pulmonary disease, bronchiectasis, cirrhosis of liver, gastrointestinal haemorrhage, chronic renal failure and chronic ulcer of skin.
Measuring the model’s accuracy and goodness of fit
The model has an equally good discrimination 12 in the derivation and validation data sets (c-index: 0.819 and 0.824, respectively). Although the model could not pass the goodness-of-fit test with p-value < 0.05 for the Hosmer–Lemeshow statistic for both data sets, a fairly high degree of agreement was observed from the plot on the observed against expected number of risk events under the validation data set by decile of predicted probability in Figure 1.
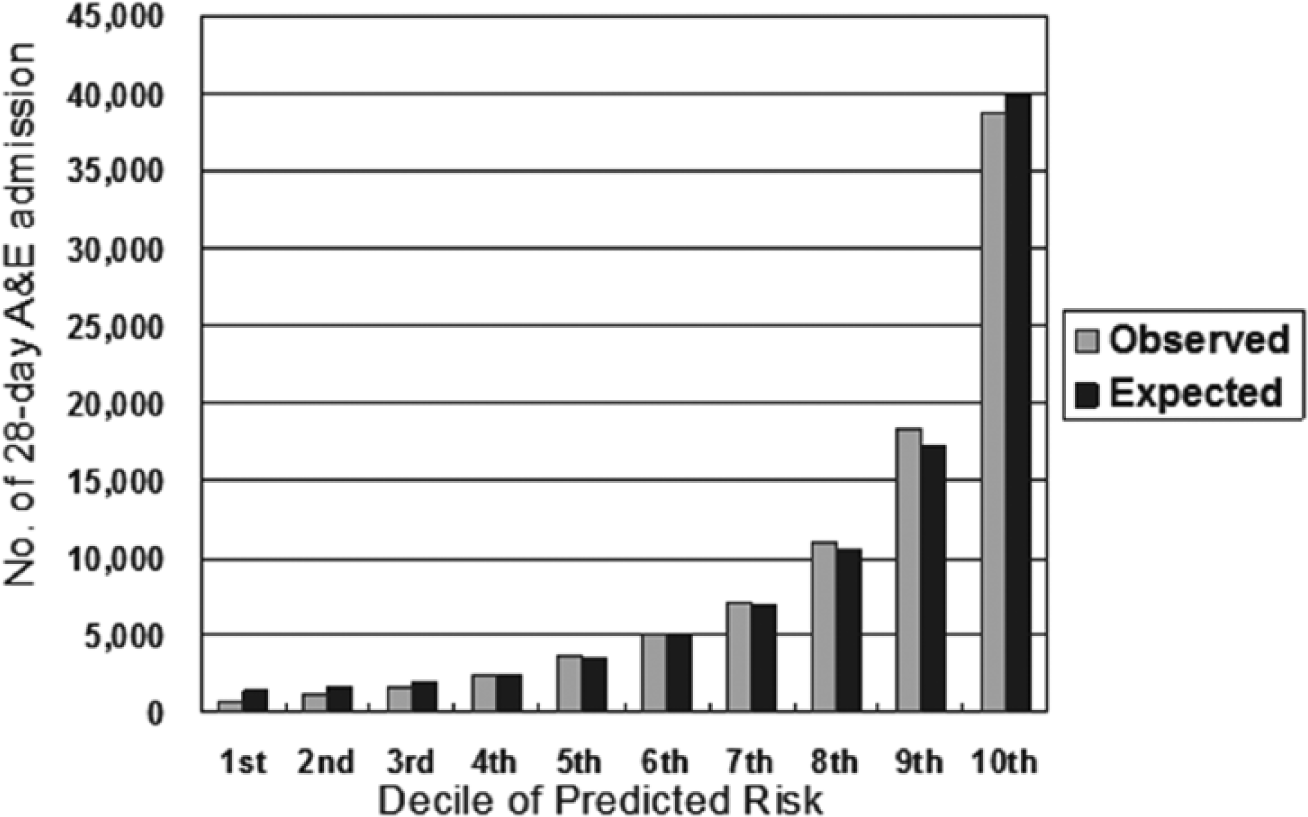
Model calibration performance.
Table 3 compares the concurrent and predictive model validity. After a sensitivity analysis on the ROC curve, the expert panel set the risk cut-off point at 0.089 by anchoring the sensitivity level at 70 per cent, which was considered as a reasonable level for this kind of risk prediction tool on one hand and which would bring a manageable patient load for recruitment into the CHCC programme on the other. Hence, the resultant model sensitivity is 70.3 per cent and specificity is 78.4 per cent under the derivation data set, which marginally deviate from the corresponding figures under the validation data set by 0.1 and 0.5 per cent points. For both data sets, the PPV and NPV were virtually the same at 21.7 and 96.9 per cent, respectively.
Model Discriminative Performance.
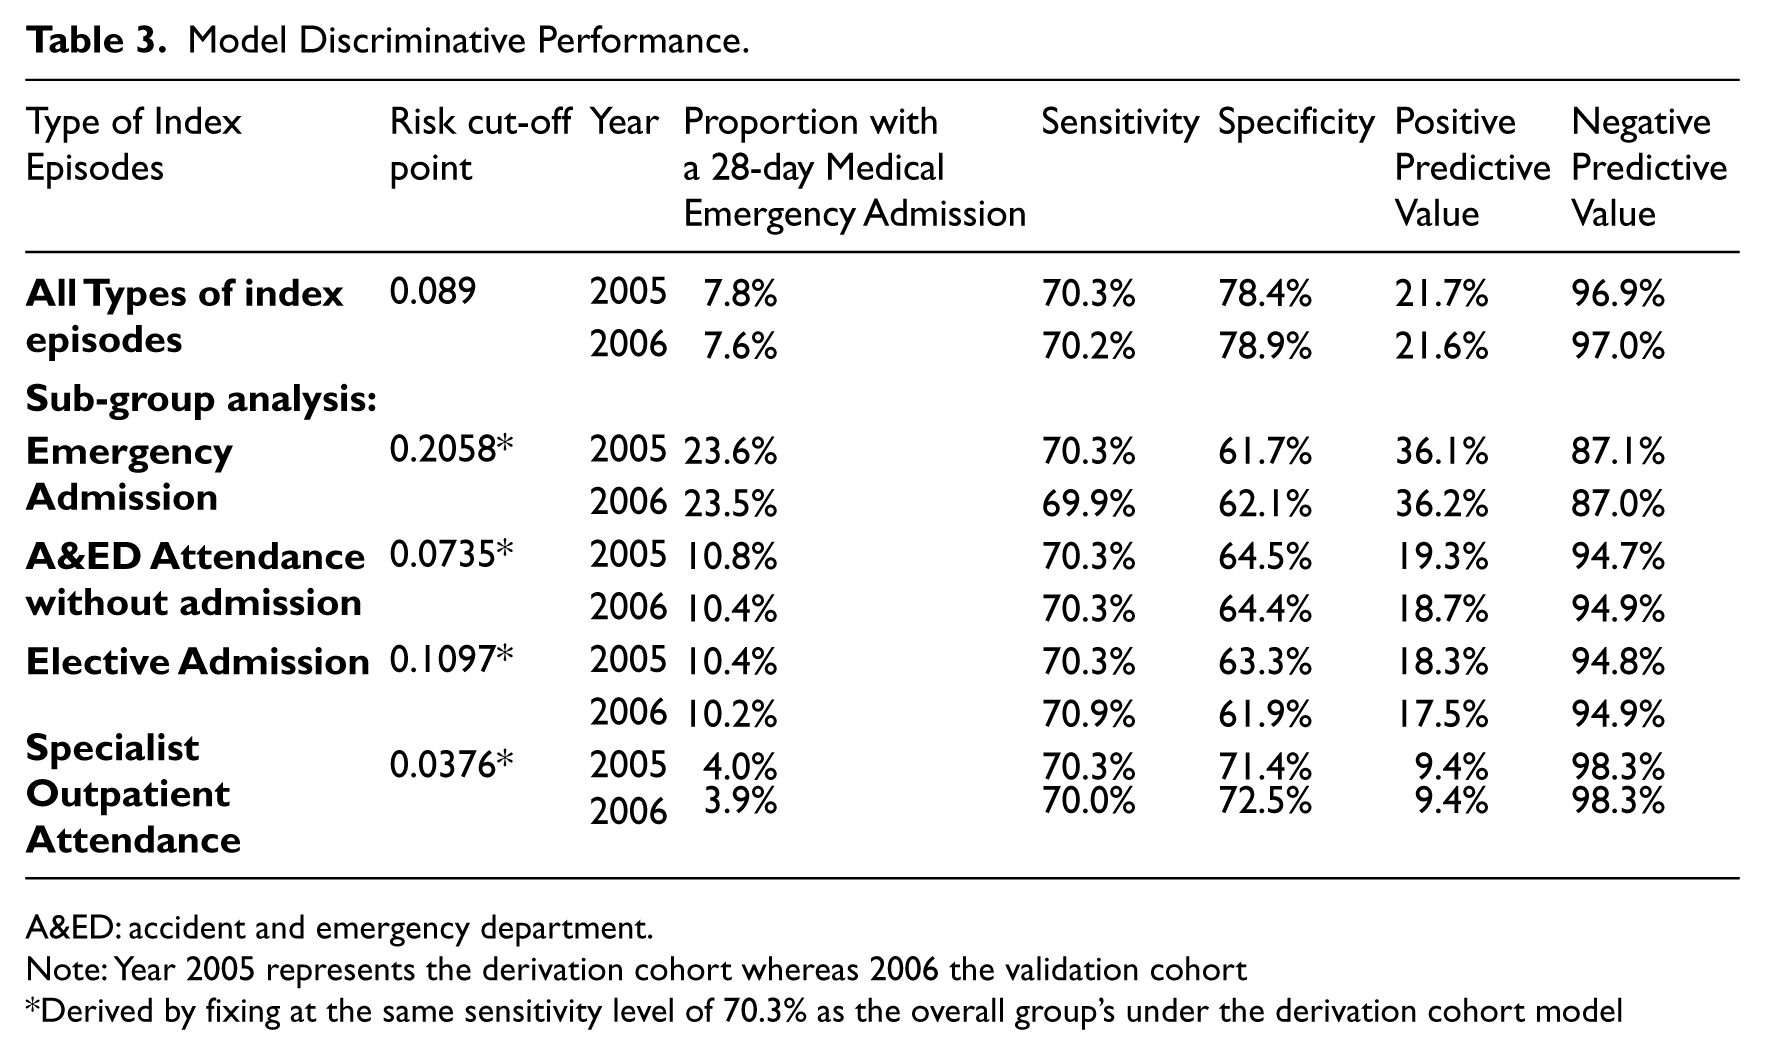
A&ED: accident and emergency department.
Note: Year 2005 represents the derivation cohort whereas 2006 the validation cohort
Derived by fixing at the same sensitivity level of 70.3% as the overall group’s under the derivation cohort model
A subgroup analysis in Table 3 on these measures was also performed for each of the four types of index episode at a risk cut-off point, which is numerically equated with the overall group’s 70.3 per cent sensitivity level. Emergency admissions had the highest PPV (36.1%) among the four types of index episodes, although compared less favourably on NPV (87.1%) with respect to the overall model. In terms of PPV, A&ED attendance without admission ranked second (19.3%), followed by clinical admission (18.3%) and specialist outpatient attendance (9.4%). Nonetheless, the latter three types of index episodes had a higher NPV, ranging from 94.7 to 98.3 per cent.
Discussion
The literature review commissioned by the National Health Service (NHS) in England 3 and undertaken by Campbell et al. 13 and a number of prior studies2,3,5,14 –19 provided a comprehensive framework for informing our expert panel on the potential choice of predictor variables on elderly emergency admission in a local setting. We adopted both a classical and a pragmatic approach in model development, by selecting predictor variables which were considered to be most clinically and statistically significant on one hand, while fulfilling the following three criteria of automation on the other. First, the data must be routinely available and stored in one common platform such that the risk score can be computed automatically for every discharged patient with minimal time lag. Second, the data must have sustainable data quality in terms of completeness and accuracy. Third, the data must be standardized across all HA hospitals in terms of definition and classification. These were technically feasible under the HA’s information technology infrastructure at the time of model development and automation, but more importantly, the organizational commitment and management processes have been and will be made to achieve this on an ongoing basis. Orfanidis et al. 23 discussed that the latter two factors as well as effective technological mechanisms affect the ability to maintain data quality.
Our model results largely agree with previous studies which found that male gender,14,21 advanced age17,18,24,25 and social security recipients as a marker of low income14,21 –23 are all associated with a higher risk of hospital readmission. The male elderly patients have more chance of cardiopulmonary chronic disabling diseases leading to a higher likelihood of readmissions. 24 In Hong Kong, if the patient’s household income falls below the poverty line, they are eligible to receive the social security called Comprehensive Social Security Allowance and will be registered into the central computer system, so that all hospital fees will be waived automatically. This is an accurate indication of poverty status without an embarrassing and lengthy interrogation of social status and household income in the clinician’s history taking. Similarly, studies have also shown that common chronic diseases such as heart failure, COPD and end-stage renal failure are consistently associated with readmissions.1,14,15,17,18 Previous number of hospitalizations or emergency admissions as risk factors for re-hospitalisation has frequently been discussed1,5,15,18,19 and has been suggested to have the strongest impact on readmission. 2 Hospital readmission was reported to occur frequently and involve with a risk of functional decline in elderly, in particular frail subjects. 5
In order to maintain the consistency of the model’s risk predictive function over time, our model did not include some factors associated with a higher readmission risk in the elderly as found in prior studies,5,16,17,19 including polypharmacy, the patient’s abilities to perform activities of daily measures, physical and cognitive functional status as a surrogate marker for frailty and severe disability and whether the patient has ever stayed in convalescent/rehabilitation care as a surrogate marker for severity and medical instability. These well-known risk factors were excluded because their data are often missing or do not have a standardized nomenclature across hospitals in the information system. Therefore, instead of using poor quality data or adopting a new data mining method to impute missing values in a dynamic database, 25 it was determined to use only solid reliable data which are often system-retrievable and require little human inputs in terms of training, auditing and so on, but could already contribute to a good risk prediction performance.
Despite exclusion of some common geriatric risk factors, the model could achieve a good predictive performance 12 in discriminating between elderly patients with and without 28-day emergency admission to medical wards, as judged on the c-index with respect to derivation and validation data sets. In terms of the model’s calibration performance, although the Hosmer–Lemeshow test statistic could not indicate a satisfactory model fit, statistically, it should be due to the huge sample size being included in this model, as exemplified by a prior simulation study to examine the test’s sensitivity with respect to varying sample size in evaluating the calibration of models. 26 At the predefined risk cut-off point, the model has a very high NPV (96.9%) but a low PPV (21.7%), which would inevitably raise a question towards the cost-effectiveness of the intervention programme if it would be used to screen in target subjects. The subgroup analysis on these predictive measures across the four types of index episodes has indeed provided insight and guided the resources prioritization since it is relatively more cost-effective for the programme to target subjects with emergency admission as the first priority group with reference to its highest PPV. The Call Centre service aims to cover a high but manageable volume of subjects given a finite telecare nurse staff strength, and hence, the high NPV serves very well to prevent unwanted annoyance to those not requiring intervention, apart from giving a higher efficiency.
After spending around 9 months’ time on automation and related data verification work, since early 2008, this risk prediction model has been automated and run live as a daily screening tool to identify high-risk elderly patients in all HA hospitals within the corporate information system architecture. For every elderly patient discharged alive from hospital or attended A&ED every day, a risk score is computed automatically at midnight in the corporate data repository where data of all 14 predictor variables are organized and stored. A list of patients at high risk of emergency admission within 28 days is then automatically forwarded to the CHCC for active disease management through telephone service. This automated screening tool consolidates information from various medical records to identify appropriate subjects for this intervention programme, thus relieving clinical staff from the case-finding task to spend more time on direct patient care instead. Besides, our risk prediction model has standardized the definition of ‘high-risk elderly patient’ across all public hospitals in Hong Kong. The CHCC programme has shown to be effective in reducing hospital service utilization in the evaluation studies on two regional hospital clusters in the pilot phase. Therefore, with the same screening tool and the same service protocol, the CHCC programme can be generalized and extended to all other hospitals within the public system. By 2011–2012, the CHCC service has been completely rolled out to cover all 41 public hospitals in Hong Kong.
Although this risk prediction model was developed in 2007, its predictive performance has been reviewed annually by comparing the predicted against the actual figures in retrospect. With the continuous service developments and changing delivery models causing varied impacts on patient outcomes within the public hospital system, it is necessary to fine-tune and calibrate the model regression coefficients to ensure a consistency in the risk predictive function over time. The model coefficients had been slightly revised once in 2010, otherwise they remained unchanged for the other years during 2007–2012 in view of the stability in model predictive performance. In the future, it may be possible to improve the current model by adding additional risk factors whose data quality matures.
Conclusion
This risk prediction model has succeeded in accurately identifying elderly patients who are at high risk of emergency admission to medical wards within 28 days following an index hospital visit. By harnessing the power of the massive volume of patient information sourced from various information systems and organized in the corporate data repository, an automated daily screening tool was created. This screening tool is instrumental to recruiting high-risk elderly patients into an upstream community intervention programme to prevent avoidable admissions through A&EDs. Being simple, accurate and objective, this screening tool with its predicted risk score has been widely accepted, recognized and used by the clinical staff within the Hong Kong HA.
Footnotes
Acknowledgements
This study was initiated within the Hospital Authority of Hong Kong in response to the corporate service plan in 2007–2008 to pilot a Hospital Admission Risk Reduction Program for Elderly in the community in two hospital clusters, which is now renamed as Community Health Call Centre for high-risk elderly for all seven hospital clusters. The authors wish to acknowledge the following people in the expert panel for contributing invaluable advice to the selection of predictor variables during the model development: Dr D Au, Dr MH Chan, Dr D Dai, Dr B Kong, Dr MF Leung, Dr TC Wong and Prof. J Woo. We are indebted to Dr PM Fung, Dr Y Chow and Dr K Tsoi for their comments and suggestions towards the article. We also thank Mr Raman Shea, Mr Stephen Yan and Mr Wan Chung Him for their invaluable assistance in literature search, data compilation and analysis.
Presentation at international meetings: Poster presentation at Hospital Authority Convention, Hong Kong, 7–8 May 2007 and Oral presentation at XIXth IAGG World Congress of Gerontology and Geriatrics, Paris, 5–9 July 2009
Eva Tsui contributed to study concept and design, data analysis and interpretation and article preparation. SY Au contributed to study concept and design, literature review and data interpretation. CP Wong contributed to data interpretation and article preparation. Alan Cheung contributed to data analysis and interpretation and article preparation. Peggo Lam contributed to study concept and design, data analysis and interpretation
Declaration of conflicting interests
We declare that we have no conflicts of interest.