
Abstract
Falls play a critical role in older people’s life as it is an important source of morbidity and mortality in elders. In this article, elders fall risk is predicted based on a physiological profile approach using a multilayer neural network with back-propagation learning algorithm. The personal physiological profile of 200 elders was collected through a questionnaire and used as the experimental data for learning and testing the neural network. The profile contains a series of simple factors putting elders at risk for falls such as vision abilities, muscle forces, and some other daily activities and grouped into two sets: psychological factors and public factors. The experimental data were investigated to select factors with high impact using principal component analysis. The experimental results show an accuracy of ≈90 percent and ≈87.5 percent for fall prediction among the psychological and public factors, respectively. Furthermore, combining these two datasets yield an accuracy of ≈91 percent that is better than the accuracy of single datasets. The proposed method suggests a set of valid and reliable measurements that can be employed in a range of health care systems and physical therapy to distinguish people who are at risk for falls.
Introduction
Due to rapidly growing elderly population, today, societies are threatened to provide their life expectancy such as public health, medical, and social services. Based on World Health Organization estimation, by 2050, more than 2 billion people will be over 60 years, 80 percent of which will be from developing countries. 1 This growth leads governments to urgently provide technical facilities for health care requirements of elderly.
Falls among older people remain as a major problem in public health care issues. Among elderly living in the community, one in three people likely to fall at least one time in a year, and this falling rate is even increasing in older adults living in nursing home cares.2,3 Falling is important in older people life due to making several mental, economical, and social issues. It is the most frequent reason for accidental death4,5 and the third reason for inability 6 among elders. Fear of falling for the second time is caused by falling and makes limitations in the elder’s daily activities. 7 Therefore, researchers are highly interested to find technical solutions to prevent falling events in elders.
The primary step to prevent falling events is determining elders potentially subjected to this risk. Many researches have been done to propose efficient tools for identifying people with high probability of falling risk.8-10 The methods work based on different schemes varying from simple clinical tests to complex ones. 11 The attempts were to identify factors that highly affect the fall risk. Among these factors, older people (more than 65 years old) having multiple chronic illness has the highest risk of falls, and stroke, Parkinson disease, a history of falls, the presence of impaired gait, muscle weakness, arthritis, foot problems, impaired cognition, abnormal neurological signs, and the taking of psychoactive medications and multiple medications are the critical factors in fall prediction. 2 However, it is important to measure the degree of risk among these factors. A comprehensive review on the proposed tools for fall prediction has been presented by Oliver et al. 12 and Hassankhani et al. 13
In recent years, machine learning-based methods have been widely used in diagnosis and prediction applications. These methods are also used in fall risk prediction where the system needs to learn from previous experiences in the prediction phase. In 2012, Marschollek et al. 14 proposed a classification tree model using the C4.5 algorithm as well as a logistic regression model and evaluated their predictive performance. In 2013, Rose 15 proposed an ensemble machine learning approach that combines multiple algorithms into a single algorithm and returns a prediction function with the best cross-validated mean squared error. Artificial neural networks (ANN) have received an increasing interest over the recent years, and its superior performance in different machine learning applications as diverse as engineering, medicine, finance, and many other areas have established it as an accepted model for a wide variety of scientific problems. They constitute a set of models inspired by biological neural systems that we call brain. The structure of ANNs generally is constructed from a set of neurons which exchange signals with others via an interconnected network. Each connection has a numeric weight that can be adjusted during training of the network, making the network adaptive to input patterns and capable of learning. ANNs have remarkable capabilities to solve a wide variety of tasks that are difficult to solve by ordinary rule-based algorithms.
In this article, we describe the development of a neural network to predict elderly fall risk based on their physiological profile. In section “ANNs,” a summary on the structure of neural networks and their learning procedure is described. In section “PCA,” the principal component analysis (PCA) approach for dimensionality reduction is introduced. In section “Materials and methods,” methods and materials of the study are explained. In section “Results and discussion,” results of the experimental study are discussed. In section “Conclusion,” the conclusion of this study is drawn.
ANNs
ANNs propose a methodology for extracting knowledge from raw data. 16 Feedforward neural network is a typical type of ANNs constructed from at least three layers of artificial neurons (Figure 1) including input layer, output layer, and one or more hidden layers. The neurons in input and output layers represent variables of predictor and predictand. The hidden layer is arranged between input and output layers including a number of neurons that is determined empirically to obtain an optimized performance for a particular problem. 16 The neurons in the hidden and output layers get their input from their previous layer via weighted connections and feed their output to the next layer. A weighted sum is calculated in each neuron of hidden layer via the following activation formula
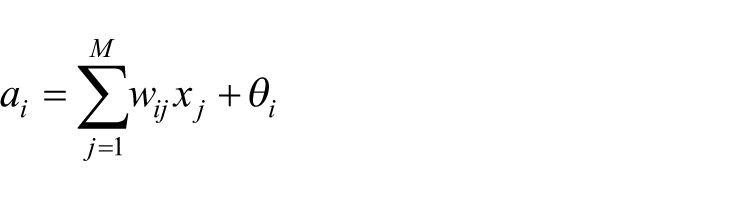
where
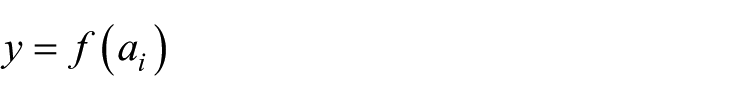
that is a predefined function such as binary or linear threshold, sigmoid, hyperbolic tan, and Gaussian. A similar computation is done in the output layer neurons to produce output of network.
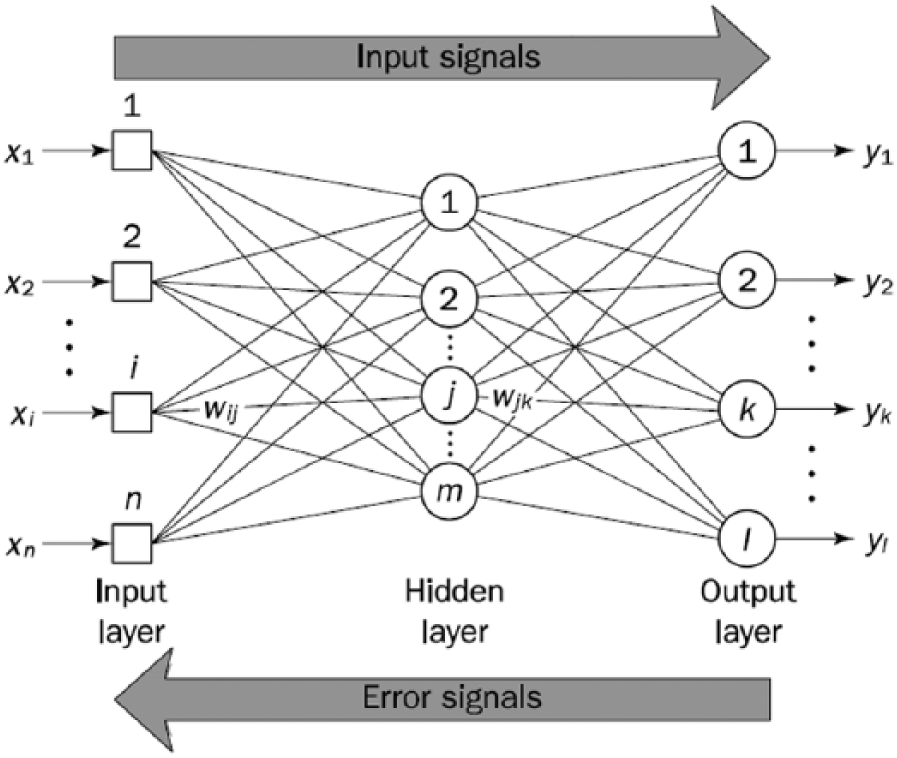
A three-layer feedforward neural network.
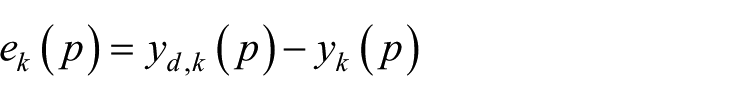
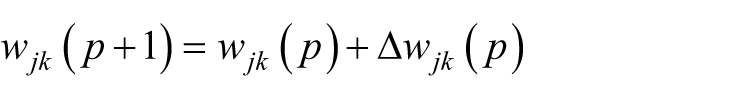
In the training phase of the above neural network, back-propagation learning algorithm is mostly used to adjust weights of synaptic connections. For each training sample, input signals are propagated through the network, and output of the network is produced. The error signals are calculated at the output layer and propagated backward to the hidden layer at iteration p via the formula
where
where

where
The standard method to develop a prediction system based on ANNs is training the network with a set of known samples according to the above procedure. After training, the network can be used to predict output for an unknown sample.
PCA
In machine learning problems, when input patterns are multidimensional, the use of all features may increase computational complexity and decrease the generalization ability of the model. To overcome these problems, one should look for the subset of features which decrease the learning ability of the model and increase the complexity of the algorithm and then remove this subset from feature set. Generally, these solutions fall in the dimensionality reduction methods and are widely used in pattern recognition and classification algorithms.
PCA17,18 is a well-known statistical technique used for dimension reduction. The technique transforms a set of correlated variables into a set of uncorrelated variables by mapping data into its eigenspace. PCA chooses top K eigenvectors to reflect directions with maximum variability. The major advantage of PCA is the ability to determine degree of similarities among data.
To conduct PCA for a given set of d-dimensional input samples X, m principal axes T1, T2, …, Tm (1 ⩽ m ⩽ d) are defined as orthonormal with a maximum preserved variance in the new space. In general, matrix T is created by the m prominent eigenvectors from the covariance matrix of samples
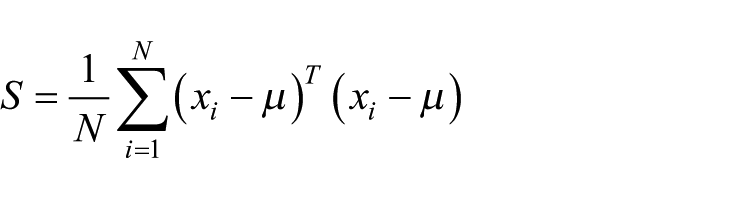
where
for i = 1, 2, …, m, where
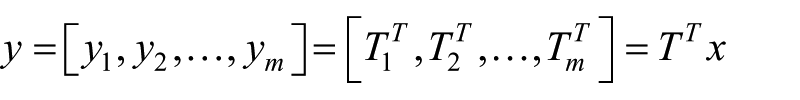
The m principal components of
Materials and methods
Dataset
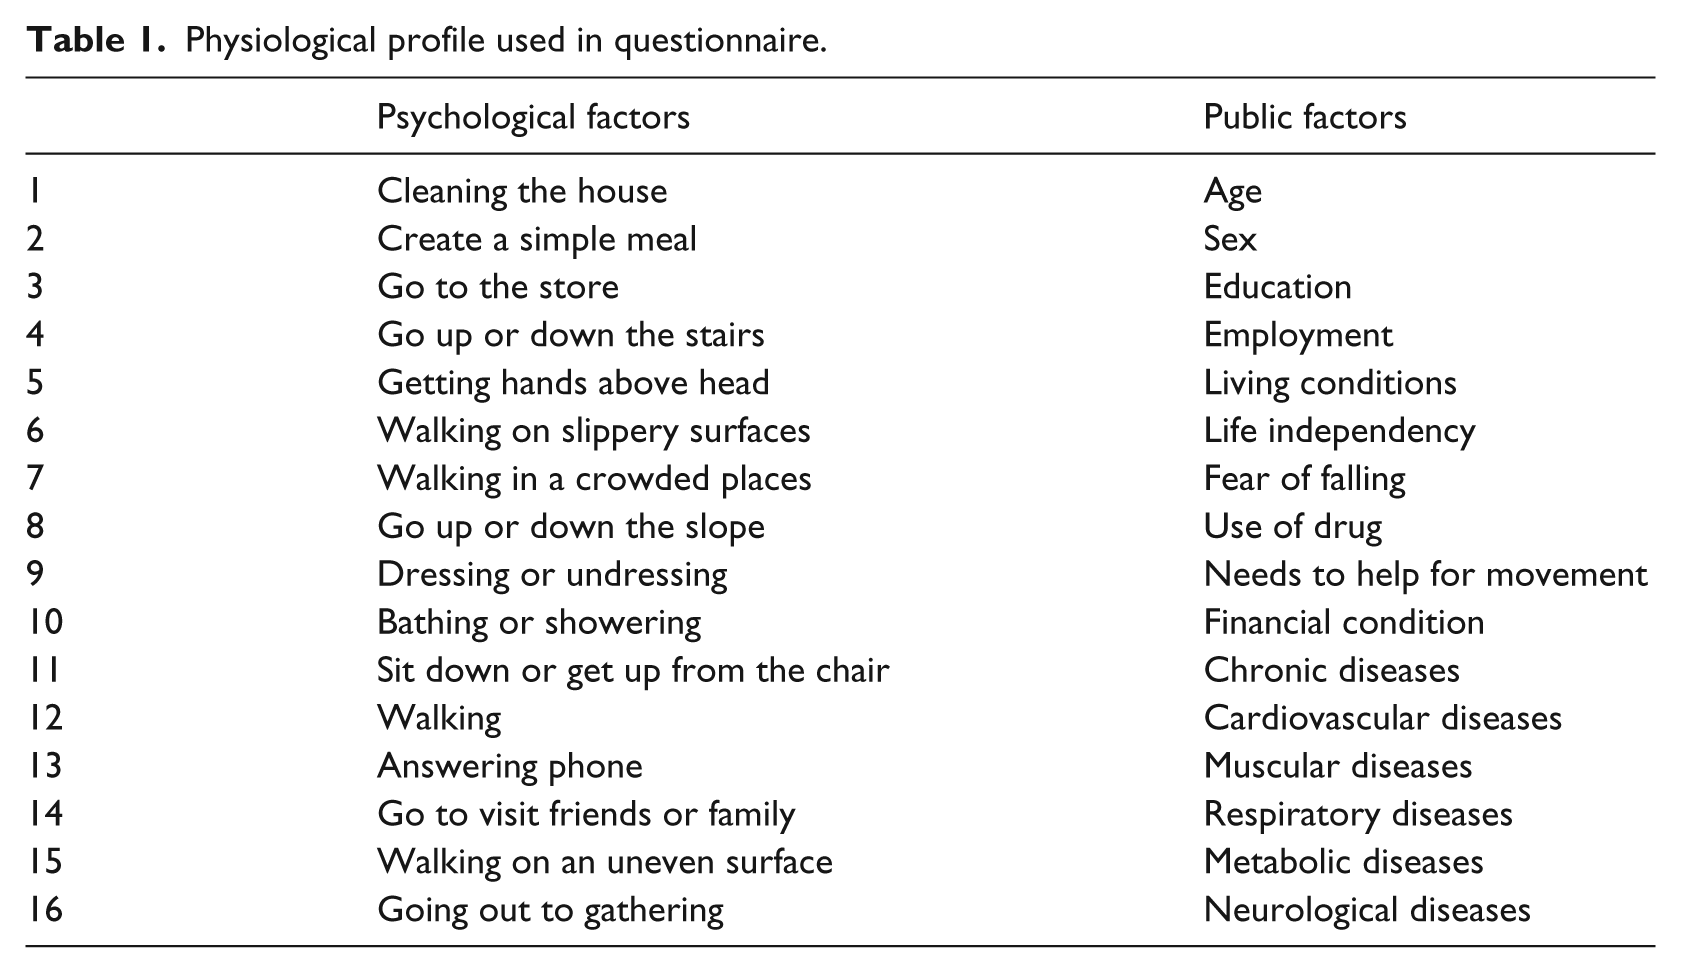
Data used in this study were collected through a questionnaire designed by a group of experts in old adults. The questionnaires were filled out by 200 old members of the Tabriz pension center having age more than 60 years. The questionnaire contains a series of simple factors putting elders at risk for falls and grouped into two sets: psychological factors and public factors. Table 1 shows the items in these two sets. For each item, four choices were considered indicating the degree for solicitous where score 1 shows the lowest degree and score 4 shows the highest degree.
Physiological profile used in questionnaire.
The neural network for fall prediction
A feedforward neural network with back-propagation learning algorithm was used to predict falling risk based on the personal profile of older adults. The number of neurons in the input layer is decided by the number of input features for each sample. To determine the number of neurons in the hidden layer, a set of experiments was arranged using different numbers of neurons ranging from 10 to 50 as represented in Figure 2(a) for psychological factors and Figure 2(b) for public factors. As can be seen from this figure, the network obtains the highest accuracy with 20 neurons in the hidden layer. The output layer contains one neuron representing the falling risk with a value between 0 and 1 where a higher value indicates a higher risk. The input data were normalized such that the features are zero-mean and unit variance. For adaption of the network weights in the training phase, training samples were given to network expecting an output of 0 (no fall containing) and 1 (fall containing), and back-propagation learning algorithm was used to adjust network weights.
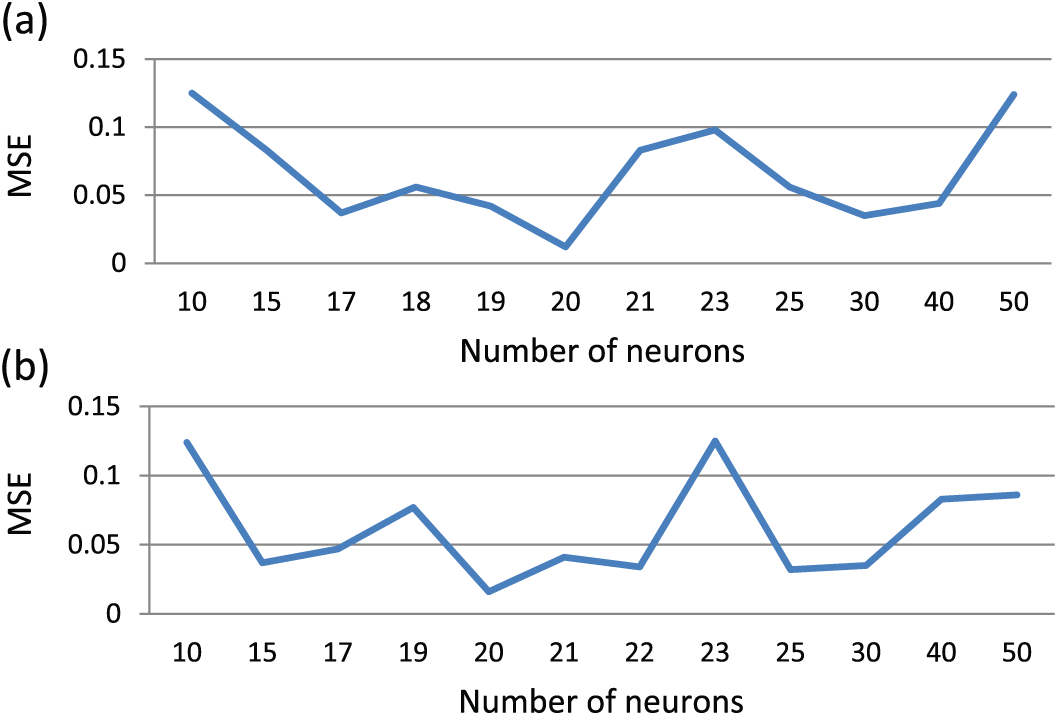
Mean square error (MSE) obtained by the neural network with different numbers of neurons in the hidden layer for (a) psychological and (b) public factors.
Dimensionality reduction by PCA
Dimension reduction is considered as an important step in classification and pattern recognition problems. The aim in this step is to filter out redundant information and choose the essential features from high-dimensional data. In this study, we note that the input data have relatively high dimensionality and generally contains some redundancy. Accordingly, the PCA was applied to remove redundant information and extract intrinsic features from the original data. Based on the resulting covariance matrix, the components with eigenvalue higher than 1 were chosen as the effective features for training the network.
Results and discussion
Experimental setup
The above-proposed scheme was implemented using MATLAB software package on a Pentium desktop computer with 2.99-GHz central processing unit (CPU) and 4-GB main memory. In the first experiment, we trained the ANN using whole features of the dataset. The collected dataset through questionnaires was first normalized to be in the same range for all features. The dataset was divided into two training (75% or 150 samples) and testing samples (25% or 50 samples). For both psychological and public factors, training of the network was run independently using the training set and then benchmarked using testing set.
In the second experiment, we used PCA to reduce dimensionality among data before training the network. The analysis on the covariance matrix of both psychological and public factors shows that there are five components having eigenvalue greater than 1. The validity of the principal components was examined by scree graph of eigenvalues over the training samples as shown in Figure 3. The graph in this figure represents eigenvalues in descending order versus the number of the components. It can be visually observed from the graph that five components have the most variability within the feature set.
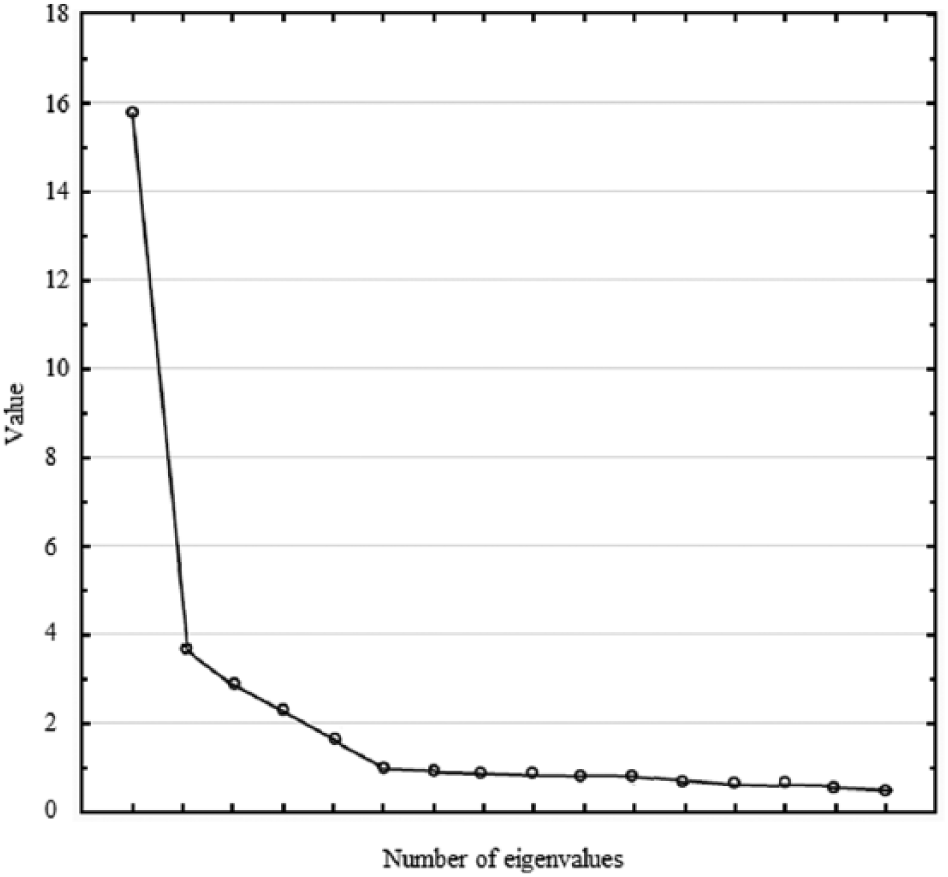
Scree plot of the principal component eigenvalues over the training samples.
Results of the ANN models
A various number of architectures were examined by varying the activation function, number of hidden layers and their neurons, and the learning algorithms. Finally, we chose multilayer perceptron (MLP) with one hidden layer having 20 neurons, logistic activation function, and back-propagation learning algorithm. The chosen architecture produced the best accuracy rate on the validation set and used in our experiments.
To illustrate the performance of our prediction system, we plot the receiver operating characteristic (ROC) curve. The curve plots the true-positive rate (TPR) known as sensitivity against the false-positive rate (FPR) that can be calculated as 1 − specificity. Generally, ROC curve analysis facilitates to compare and select the optimal model with a rational performance. The optimal prediction model in this curve obtains a point in the upper left corner of the plot where the value of the TPR reaches 1 or very near value to 1 for a very small value of FPR.
Figure 4 shows the ROC plots of the trained ANN models using different datasets including psychological and public factors before and after dimension reduction. As can be observed from this figure, the best result belongs to psychological factors where its curve quickly climbs to high TPR values at low FPR values. Based on the ROC curves, the performance of the ANN model over the psychological factors is expectedly decreased after dimension reduction. Furthermore, similar observations can be seen from this figure for the public factors before and after dimension reduction. However, the overall performance of the ANN models over public factors is generally lower than that of psychological factors. We arranged another experiment to train the ANN model using both psychological and public factors after dimension reduction. From this figure, the ROC curve of this model shows a better performance in comparison with the results produced by the trained models using single datasets.
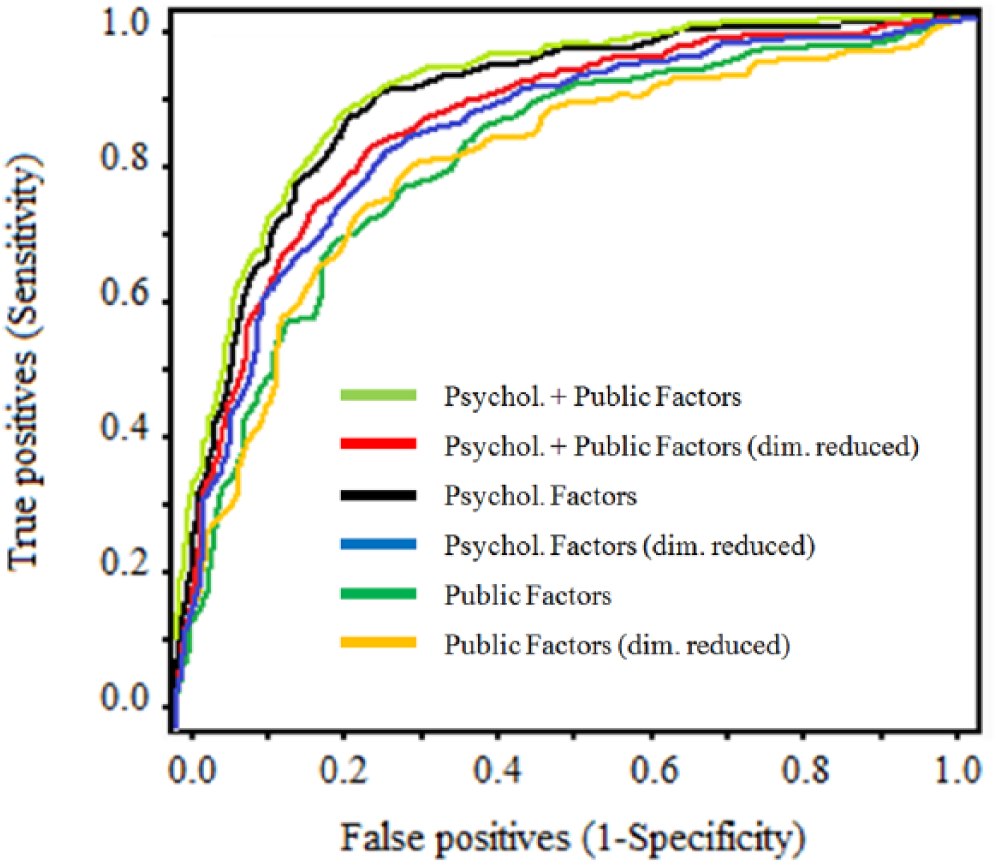
Receiver operating characteristic (ROC) plots produced by the ANN models for different datasets.
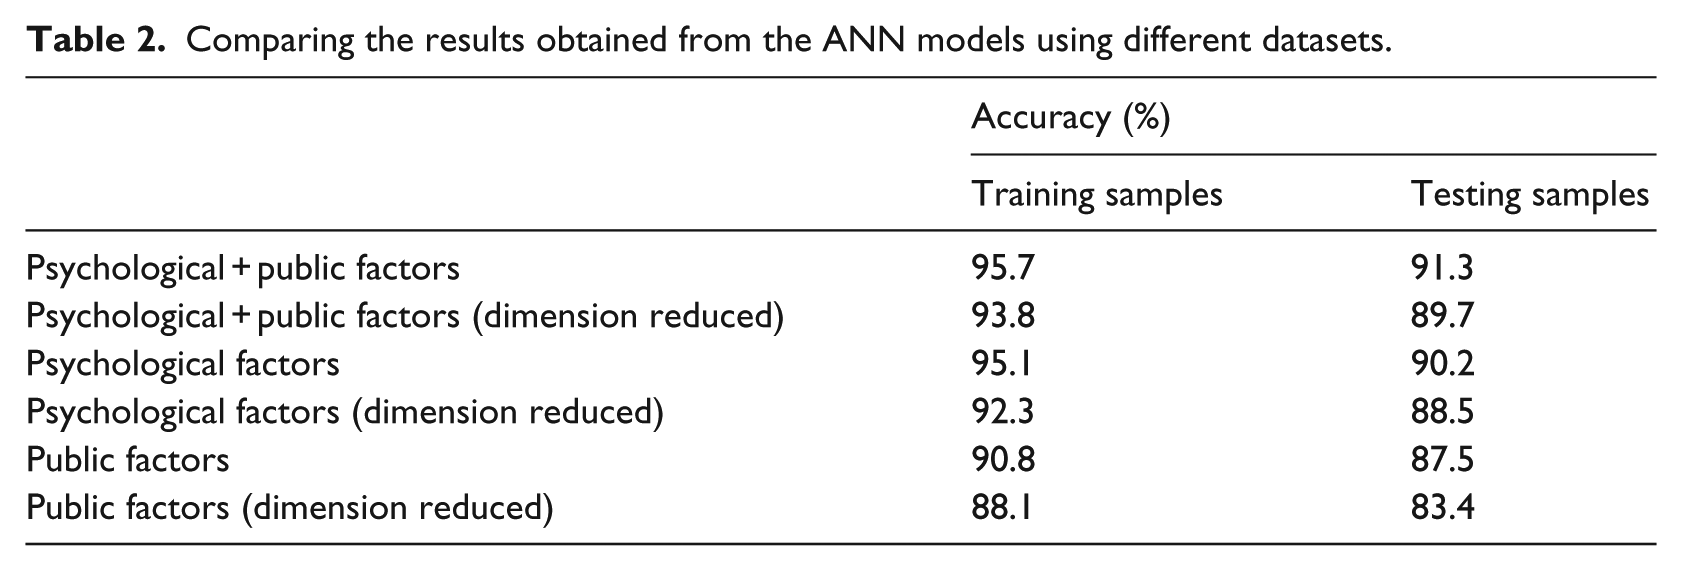
Comparing the results obtained from the ANN models over different datasets (Table 2) reveals that psychological factors provide the best evidence for fall prediction among the physiological profile of elderly adults (accuracy ≈90%). Performance of the models has been decreased when dimensionality of the datasets was decreased by PCA. However, combining two psychological and public factors produces the highest accuracy among the proposed models (accuracy ≈91%). Furthermore, this combined dataset after dimension reduction yields a performance relatively near to the best results produced by psychological factors. Considering the higher efficiency of the combined dataset with reduced dimensions in terms of training time of the ANN, the minor decrease in the accuracy of this model can be ignored.
Comparing the results obtained from the ANN models using different datasets.
Extraction of the key features for fall risk prediction
We performed another study to extract features that are the most important among the features to predict falling risk in elderly adults based on the PCA. According to the PCA on psychological factors, the most effective factors among psychological features of elderly was go up or down the slope, walking on slippery surfaces, walking in a crowded places, bathing or showering, and walking on an uneven surfaces, respectively. Based on the PCA on the public factors, use of drug, fear of falling, metabolic diseases, cardiovascular diseases, and employment are five most important factors with a high impact on the risk of elderly falling.
Conclusion
In this study, we used an ANN model to predict fall risk among elderly adults. Based on the experimental outcomes, the proposed model obtained a fruitful result based on physiological profile of people. The analysis of the physiological profile of the older people revealed that the protection against falling can be maximized by utilizing intelligent prediction tools. The tool can be used as a complement for the medical assessment and management of elders who are at risk for falling. Furthermore, the tool provides useful analysis to identify the critical factors for falling in older people.
Footnotes
Declaration of Conflicting Interests
The author(s) declared no potential conflicts of interest with respect to the research, authorship, and/or publication of this article.
Funding
The author(s) disclosed receipt of the following financial support for the research, authorship, and/or publication of this article: This paper is published as part of a research supported by the Research Affair Office of University of Tabriz.