
Abstract
Although many emergency hospital admissions may be unavoidable, a proportion of these admissions represent a failure of the care system. The adverse consequences of avoidable emergency hospital admissions affect patients, carers, care systems and substantially increase care costs. The aim of this study was to develop and validate a risk prediction model to estimate the individual probability of emergency admission in the next 12 months within a regional population. We deterministically linked routinely collected data from secondary care with population level data, resulting in a comprehensive research dataset of 190,466 individuals. The resulting risk prediction tool is based on a logistic regression model with five independent variables. The model indicated a discrimination of area under the receiver operating characteristic curve of 0.9384 (95% CI 0.9325–0.9443). We also experimented with different probability cut-off points for identifying high risk patients and found the model’s overall prediction accuracy to be over 95% throughout. In summary, the internally validated model we developed can predict with high accuracy the individual risk of emergency admission to hospital within the next year. Its relative simplicity makes it easily implementable within a decision support tool to assist with the management of individual patients in the community.
Introduction
An emergency hospital admission is an admission that is unpredictable and occurs at short notice because of clinical need. 1 Such admissions are a concern to all health systems. One reason is the financial burden these admissions cause. For example, in England’s National Health Service (NHS), it is estimated that unplanned emergency admissions, which account for approximately 35% of all admissions, cost an average of £11 billion per year.1–3 Aside from the direct financial burden to the health system, emergency admissions can disrupt scheduled (elective) work often resulting in cancellations and pose additional patient flow issues.2,4 In addition to the negative impact on health systems, these admissions have direct effects on individuals, as they are distressing to both patients and carers, potentially leading to adverse events particularly in older patients.5–7 Patients admitted as an emergency are likely to have poorer outcomes, for example an emergency bowel procedure has about 10 times the death rate of the same procedure carried out electively.8,9
Although a proportion of emergency hospital admissions are unavoidable, many health care systems and organisations have introduced initiatives to deal with avoidable admissions and readmissions.1,10–13 These efforts involve improvements in the management of high risk patients such as the elderly and those with multiple, complex and chronic co-morbidities. These initiatives have often adopted the “case management” approach in which patients with long term conditions are offered some sort of out-of-hospital management to proactively improve or stabilize their condition and thus avoid an emergency admission.14–17 For example, in the English NHS, an enhanced service specification was published called “Avoiding unplanned admissions: proactive case finding and patient review for vulnerable people”, costing approximately £160 million per year and offering financial incentives to general practitioners for the identification and case management of patients who are classified as potential unplanned emergency admissions.18–20 More than 95% of English GP practices participated in this as yet unevaluated payment scheme, which has little evidence on how best to identify target individuals.
Several studies suggested that predicting the risk of hospital admission with “sufficient accuracy” is challenging for both health professionals and prediction models.21,22 These studies identified a number of risk models that have been developed for this purpose. Many were intended to be used by hospitals to identify the risk of readmission for their patients (technically a similar problem but ultimately a different problem from a care system perspective), 23 some were developed with specific populations in mind,24,25 others only included data from a single source, 26 while others were deemed outdated.23,27
As the following brief literature review summarises, the risk models used by many health services are either generic, outdated or not specific to the population at which they are aimed. Others are too complex or are marketed as “black boxes” due to commercial interests and other sensitivities. All these factors have resulted in case management initiatives which do not take full advantage of analytics, or at the very least are used without the full confidence of their end users.
The aim of this study was to develop and validate, using routinely collected data, a simple and easily customisable risk model to help identify those individuals in the community likely to present as emergency hospital admissions within the next 12 months. We aimed to demonstrate that using a relatively simple and computationally efficient statistical approach based on routinely collected data that are readily available in many different health and care settings, can support the development of decision support tools capable of more precise targeting of at risk individuals. The increased precision should help health and care providers improve patient outcomes and experience in a cost efficient manner.
Background
Recent studies have shown that there is a positive association between usage of clinical information systems and improved patient outcomes as well as lower hospital operating costs.28,29 Simple and sophisticated analytics have been utilised by clinicians and health data analysts in the development of software tools that can support better informed decisions.30–34
A major focus of recent health policy has been to reduce unplanned emergency admissions and the impact they have on the care system and its users. England’s NHS has implemented several interventions aimed at reducing unplanned emergency admissions including case management, telemedicine, self-management and vaccination. 35 In the US, case-management of complex patients identified using analytics platforms is becoming more widespread as health care providers seek to more effectively manage the populations in their care and to minimize high cost emergency admission or emergency room attendance. 36 Most of these interventions make use, one way or another, of data.
Through a search of the literature we identified a systematic review published in 2014 that matched our search criteria. 37 This review identified 27 unique risk prediction models developed in the US, UK, Italy, Spain and Canada. The studies varied in the data used to develop the model, with some using self-reported data, others using administrative/routinely collected data and some using a combination of the two. The review found that risk models that used a combination of data sources tend to exhibit better statistical performance. Overall the predictive performance c-statistic metric of all models identified ranged from 0.61–0.83. Only six of the models identified had a c-statistic of more than 0.8, which is an indication of good performance of the model. The models used in the review mostly had as predictor variables age, prior hospitalisation, medical diagnosis and sex. Less than half of all models used co-morbidity measures. The review also highlighted that models developed for a specific sub-population always performed better than those developed on more generic populations.
Risk models developed for and/or used by England’s NHS for predicting emergency hospital admission.
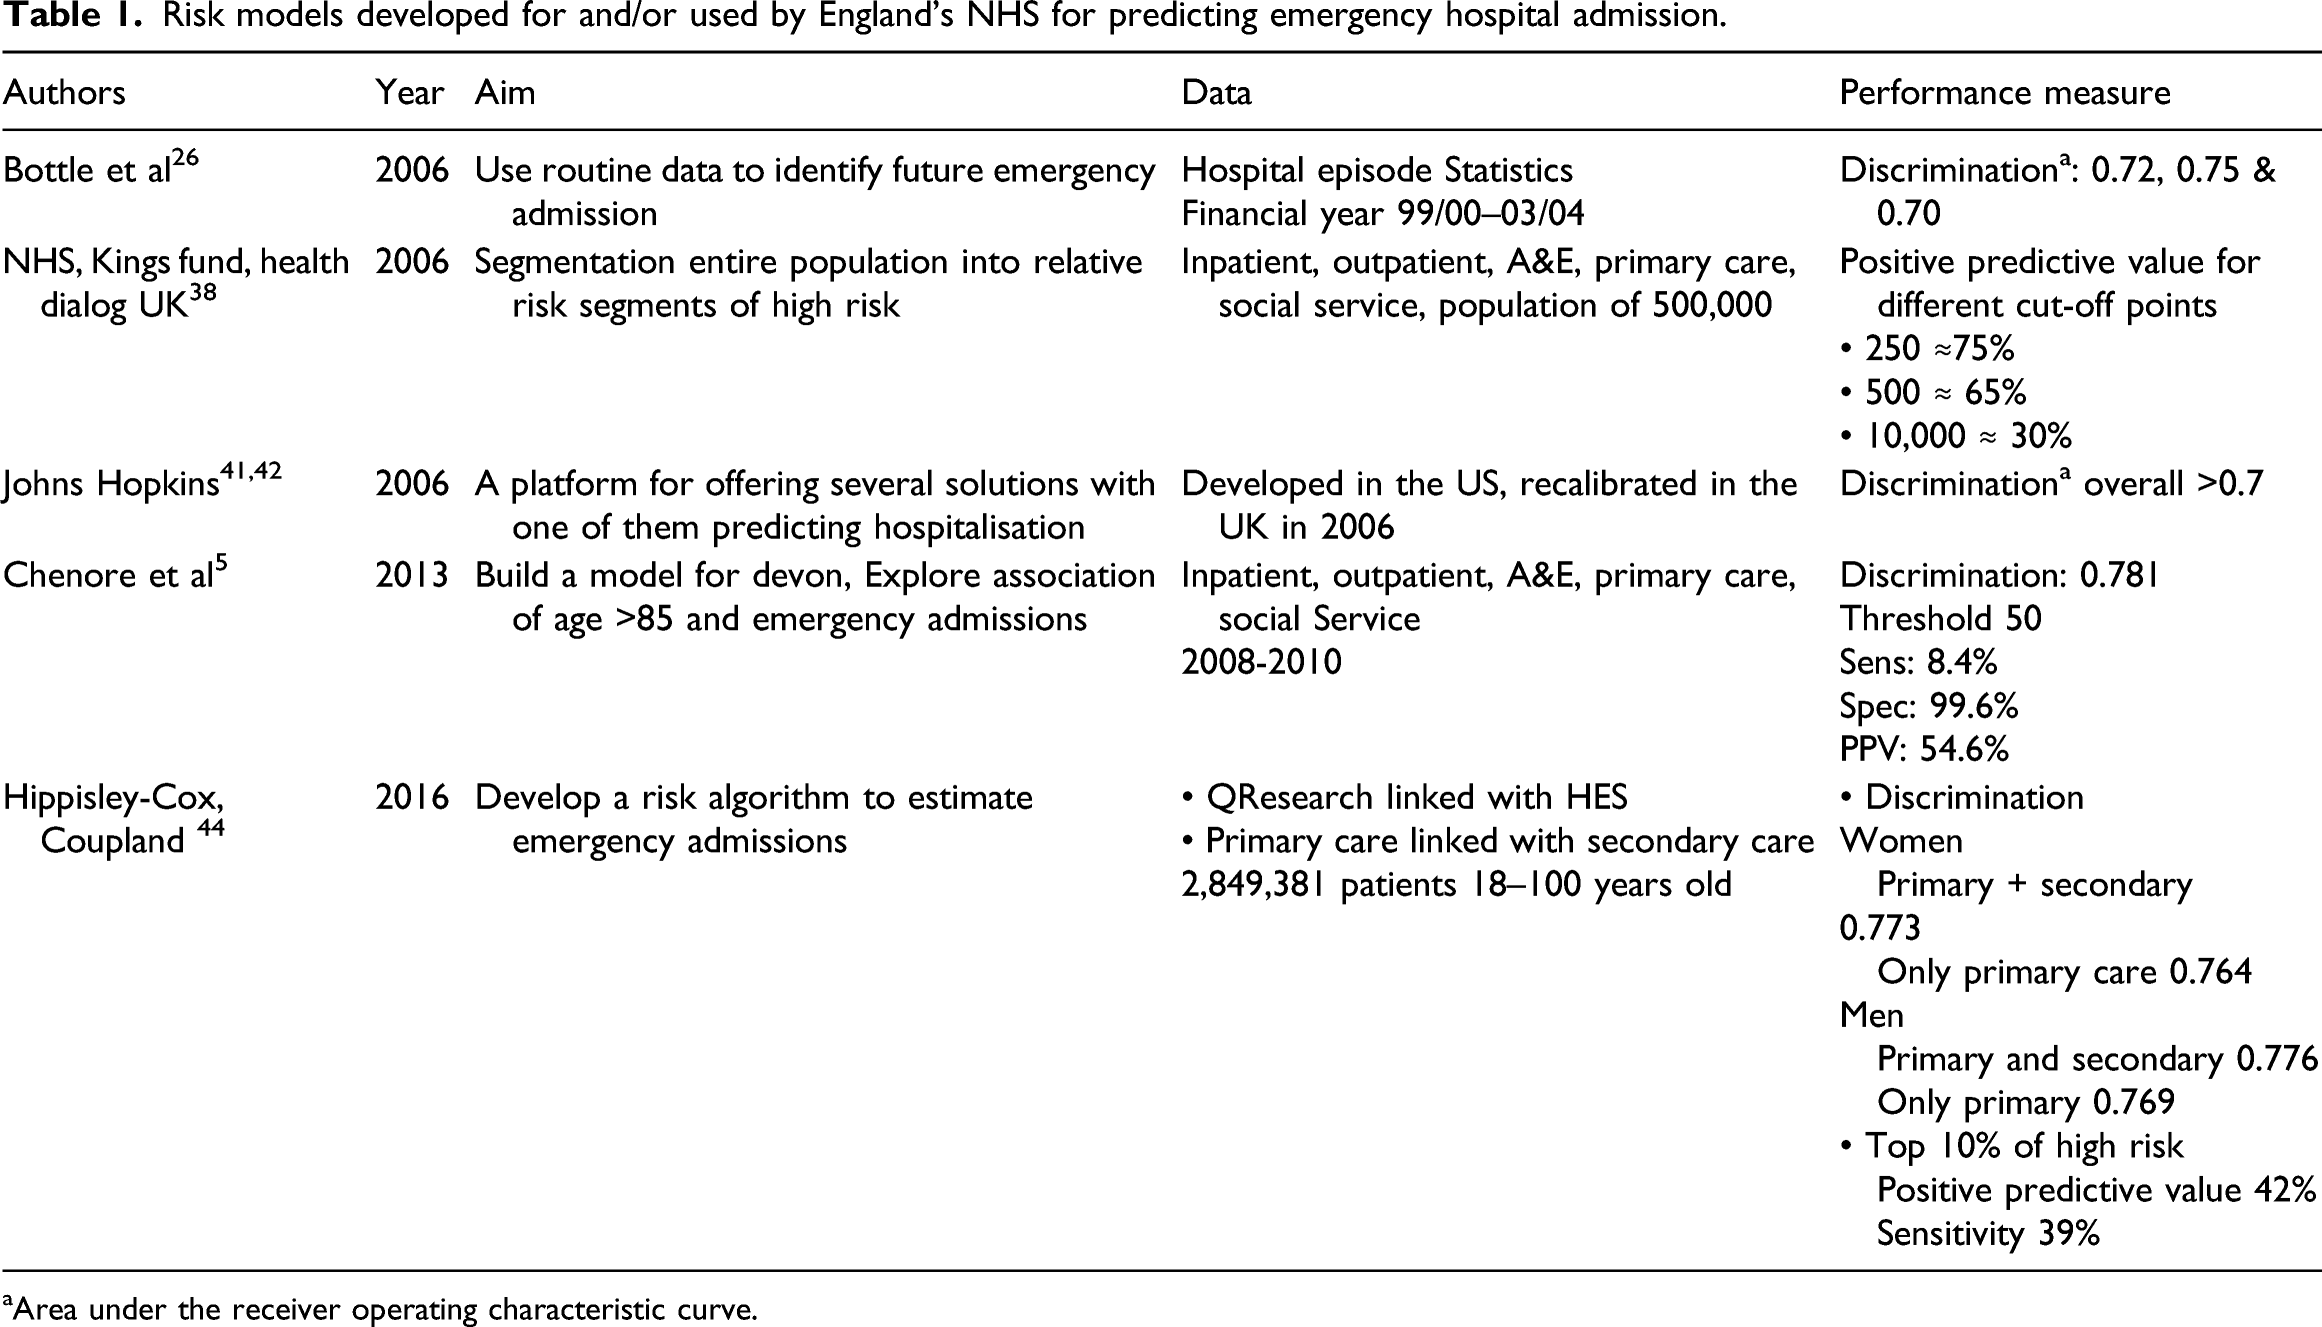
aArea under the receiver operating characteristic curve.
Bottle et al. in 2006 published a logistic regression model that identified patients at high risk of future hospital admission. 26 The model was trained on routinely collected hospital activity data only, with an overall predictive performance measure c-statistic of 0.72. Perhaps one of the reasons the accuracy of the model was not as high as in other cases was a result of the limitation of using a single data source as indicated in the systematic review by Wallace et al. 37
The NHS in collaboration with the King’s Fund and Health Dialog UK in 2006 developed a tool that used the combined predictive model (CPM) to predict the probability of emergency admission.38,39 The resulting tool was offered free to local health authorities. Despite being freely available, the tool required a large number of input parameters and thus made it difficult to implement and adapt across different organisations. In 2011 the government decided against commissioning the upgrade of the tool and encouraged organisations to develop/acquire their own risk prediction tools, thus creating a potential market for supplying such software tools. 40
One of the commercial risk prediction tools used by different health care organisations in England is the Johns Hopkins ACG® System.41,42 This tool was developed using data from the US health care system although Imperial College London implemented the model using NHS data showing comparable performance metrics. 43 As with other commercial tools, details of the algorithm and/or risk model underpinning the tool are not known creating a ‘black box’ effect that may hinder end user’s ability to fully understand and appreciate its recommendations.
A more recent study published in 2013 described a model developed for Devon, a region in the south west of England. 5 This study linked data from hospital sources (inpatient stays, outpatient attendances, emergency attendances) with data from general practice (co-morbidities, duration of GP registration) while restricting the analysis to older patients only (defined as those over 85 years). This model gave a c-statistic of 0.78 perhaps a result of combining data from different sources and focussing on a specific sub-population.
The most recent study found in the literature was published in 2016 and used a large dataset that again combined data from general practice, with hospital episode statistics (HES) capturing data such as emergency admission in the past 12 months 44 The model comprised of 30 variables calculating the risk of emergency admission in the next 2 years. The risk model has a c-statistic value of 0.77. As part of this study, the research team also implemented a web interface tool for better dissemination of their risk model.
As evident from the brief review presented here, there appears to be no study in the literature that describes the development and validation of a model that predicts the risk of emergency admission for a regional population and performs well statistically. Some studies predict emergency admission for a specific sub-population (e.g. over 85 years old), while others use models that are too complex requiring a large number of predictor variables. Finally, some studies used data from a single source thus limiting the scope of the risk model. We also found that most studies report on the predictive statistical performance of their models without justifying the cut-offs they chose.
Our study tries to minimise the effect of these limiting factors by: • developing a simple risk prediction model, • using a methodology that is widely used within health care (logistic regression), • combining data from two different sources (population and hospital activity), • including the entire population within a geographical region, and • setting certain model parameters following consultation with potential end users of the risk model.
Methods
Data for the development of the risk prediction model were provided by an NHS Clinical Commissioning group (CCG) in England. These are clinically-led statutory organisations responsible for the planning and commissioning of health care services for their local area. 45 The data were provided in two de-identified datasets in line with NHS information governance requirements. Patients with a recorded objection to information about their care being disseminated, known as a type two objection, were removed from the dataset at source. The data providers pseudonimised the data at source using a unique identifier as the tool under development, and once in use by the service, would potentially need to generate lists of named individual candidates for the actual intervention.
The first dataset was a cross-sectional dataset with a census date of March 2014, and contained data concerning the regional population served by the CCG (190,466 individuals). In addition to basic demographic data, a number of long term conditions (LTC) for each individual was included (arthritis, low back pain, asthma, chronic renal failure, congestive heart failure, chronic obstructive pulmonary disease, depression, diabetes, hyperlipidaemia, hypertension, ischemic heart disease, age related muscular degeneration, bipolar disorder, glaucoma, hyperthyroidism immunosuppression transplantation, osteoporosis, Parkinson’s disease, schizophrenia, and seizure). It also contained the age, the Lower layer Super Output Area (LSOA) which is a geographic hierarchy used for reporting small area statistics in England and Wales, 46 the 2010 Index of Multiple Deprivation (IMD) and the pseudo-identifier. As part of the data pre-processing, we updated the IMD to the 2015 version. The index ranges from 1–32,844; the smaller the score the higher the area deprivation. 46 The 5 quintiles of IMD classifies these areas based on relative disadvantage, with quintile 1 being the most deprived and quintile 5 being the least deprived.
The second dataset was of a longitudinal nature and contained data regarding hospitalisations of those patients within the regional population contained in the first dataset. This dataset contained information on patients visiting the hospital between 14 March 2013 to 30 November 2015. The hospital activity dataset included information such as type of admission (emergency or elective), admission date, discharge date, diagnosis, procedures and all the fields found on official hospital data collected by the government, known as hospital episode statistics. The dataset also included the pseudo-identifier for each patient admission.
Data were firstly cleaned in their original datasets. The hospital activity dataset was then aggregated as many individuals had multiple hospital admissions. The hospital activity data were then split, based on admission date, reserving the last 12 months in order to be able to identify the outcome of interest which was 12-month emergency admission. This approach also made sure that any long term condition that was used in the resulting model existed before the last emergency admission. Only the first emergency admission was considered for patients with multiple emergency admissions in the 12-month period. A deterministic data linkage using the unique pseudo-identifier was then performed, generating the research dataset used to develop and test the prediction model.
Model development
The final dataset was randomly split into a development (75%) and a validation dataset (25%). A k-fold cross validation exercise was performed. The initial linked dataset was further split into 50 different random samples. All results presented in this paper are the average of the 50 different samples. The model was developed based on models found in the literature.26,44 This process led to a long-list of variables to consider as predictors of unplanned emergency admission within 12 months, such as gender, age and existing disorders (anxiety, asthma low back pain etc.). Variable transformations were performed to adjust for maximum model performance. Logistic regression was used to refine the choice of predictors and adjustments for possible confounding. Univariate regression was first used to shortlist potential explanatory variables. A significance cut off level of 0.05 was used for the selections. Model fits were assessed using the Akaike Information Criterion (AIC). All data cleaning and statistical analyses were performed on the statistical software STATA 14.1.
Performance and evaluation measures
The performance of prediction models, especially in health care, is predominantly measured using discrimination and calibration. 48 There are different metrics used for discrimination and calibration performance measures. Our choice of measures was based on familiarity of health care professionals with the specific metrics in order to improve the model’s uptake and utilisation.
Discrimination is a measure of how well the model distinguishes between those who will have the outcome under investigation and those who will not. To this end, we used the area under the curve (AUC) of the receiver operating characteristic (ROC) which is a plot of sensitivity over 1-specificity. A line described by the straight line equation y=x, thus a 45° angle indicates an AUC of 0.5 and poor discrimination and that the predicted probabilities are chance findings. An AUC of 1 indicates perfect discrimination although this is never achieved in practice. As a rule of thumb, an AUC score of 0.7–0.8 is considered acceptable discrimination and a score of >0.8 is considered as good discrimination. Discrimination between different models was assessed using the DeLong algorithm. 49 Calibration measures how close the predicted probabilities for the outcome under investigation are to the observed outcome. The tests used for the assessment of models of calibration were calibration plots and the Hosmer-Lemshow χ2 test. 49
Evaluation of the model was performed using the outputs of the contingency table, sensitivity, specificity, positive predictive value and negative predictive value, but we also reported the model’s prediction accuracy as this metric utilises information found in all the classes in the contingency table. For the purposes of this study, sensitivity refers to the model’s ability to correctly detect individuals who will have an emergency admission within the next 12 months. Specificity refers to model’s ability to correctly detect individuals who will not have an emergency admission within the next 12 months. We also reported on the Youden’s Index, Mathews Correlation Coefficient (MCC), the F score and the Balanced Classification rate (BCR). These measures were used since they are considered useful in classification problems especially when there is a large imbalance in size between the two classes, 50 in our case those who had an emergency admission in the next 12 months and those who did not.
Results
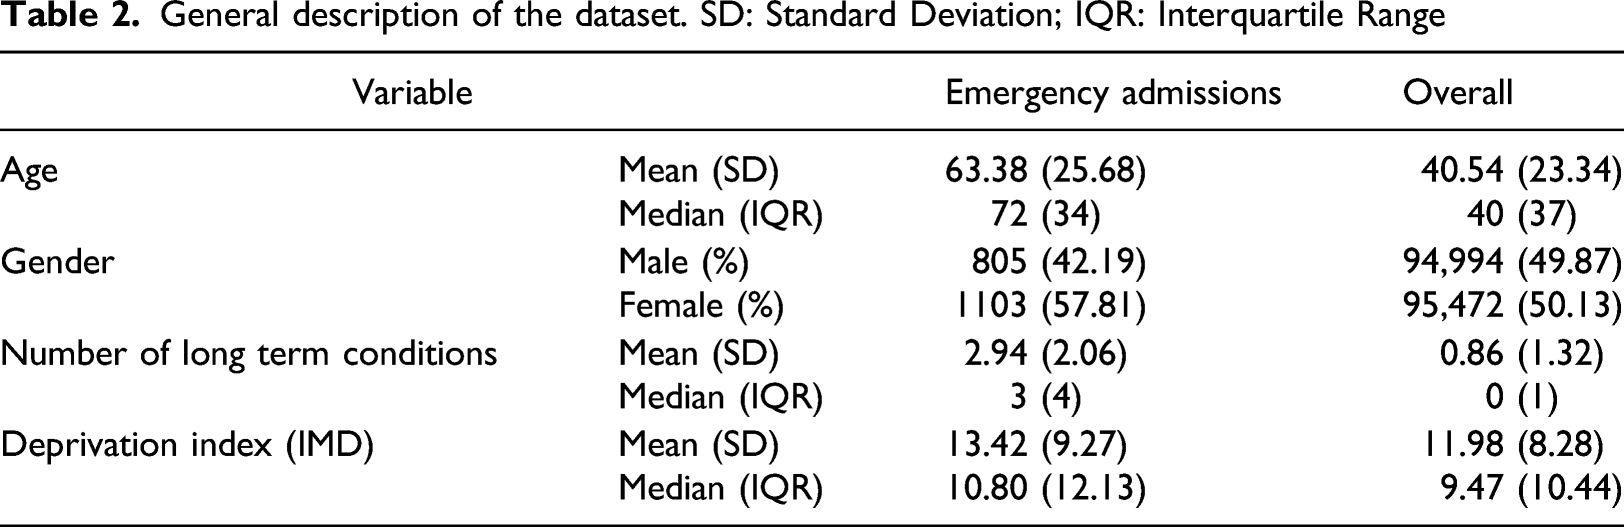
General description
General description of the dataset. SD: Standard Deviation; IQR: Interquartile Range
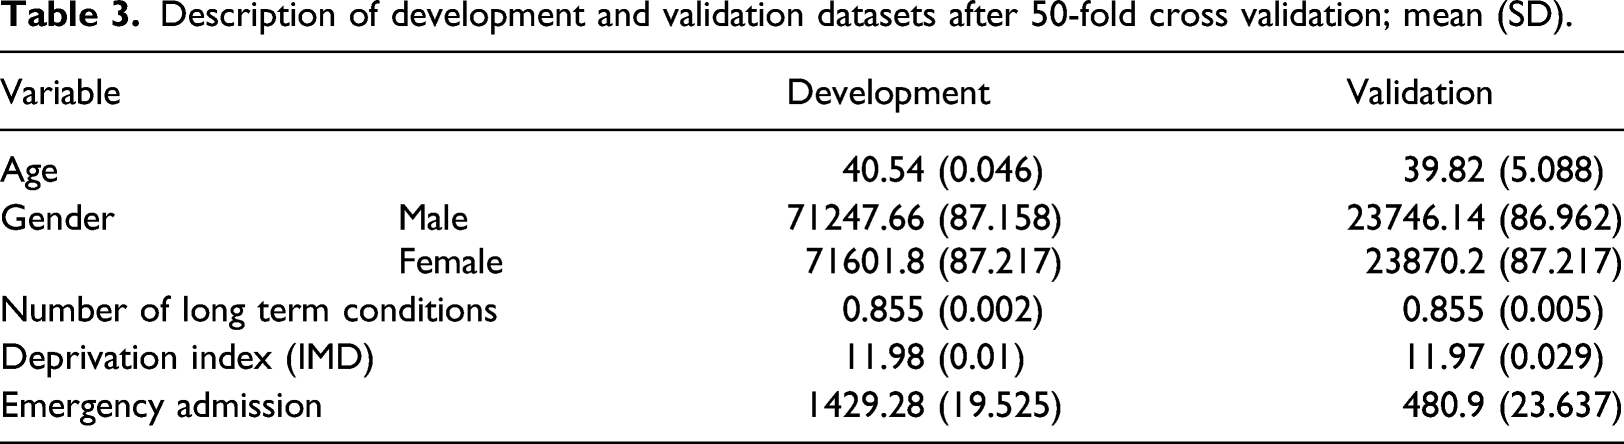
Development of the model
Description of development and validation datasets after 50-fold cross validation; mean (SD).
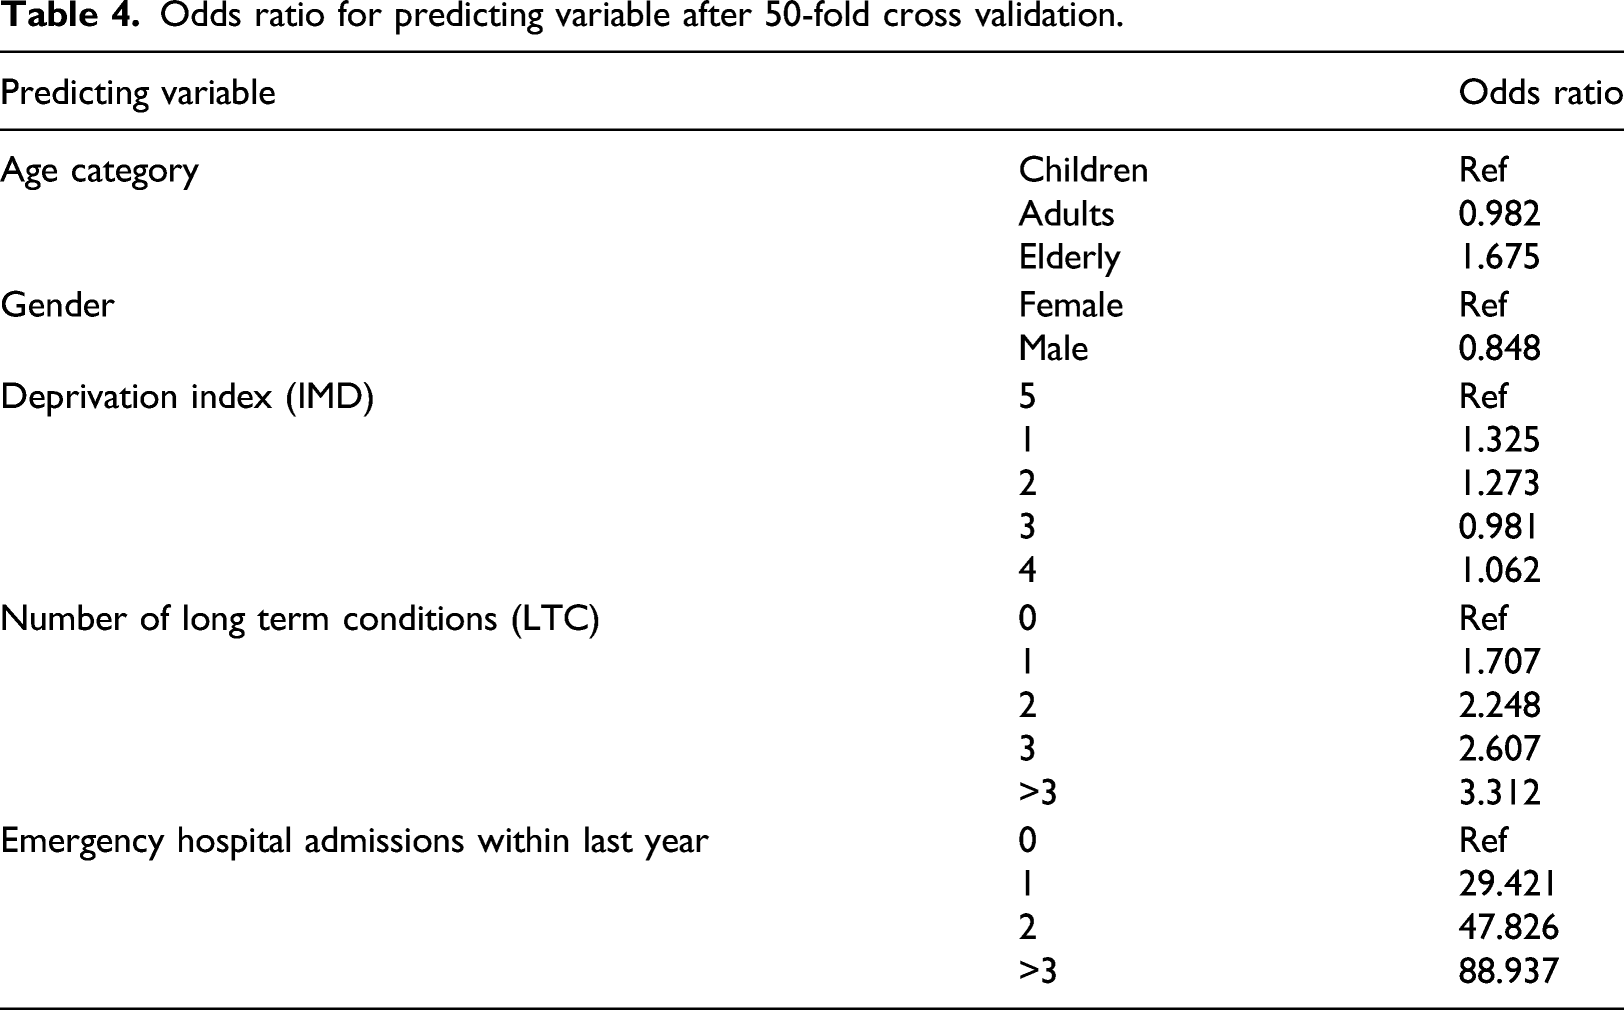
Odds ratio for predicting variable after 50-fold cross validation.
Validation of the model
For the internal validation (75% of the dataset) the model gave mean (SD) discrimination of 0.939 (0.002) area under ROC curve after the cross validation. The external validation sample (25%) showed equivalent characteristics to the derivation set (Table 3), highlighting the robustness of the methodology used and the results. The mean (SD) area under the ROC curve after the 50 different k-fold cross validation samples was 0.938 (0.006).
Model implementation
After consultation with the intended end users, our healthcare partners, the model was evaluated based on the number of people the organisation will realistically have the capacity to provide the case management intervention for. We tested the model’s performance on two different “cut-offs” thresholds. We ranked the population in ascending order of their predicted probabilities for emergency admission and took the top 2% and top 5%. These percentages are not just arbitrary numbers, but equate to a realistic number of individuals that can be supported by a relevant intervention. The probability for the 2% cut off was on average 0.1535 and for 5% 0.0502.
We identified the corresponding probability and used it as a cut-off in order to be able to calculate evaluation metrics. We performed this in all of the cross-validation development and validation datasets. Sensitivity, Specificity, PPV, NPV and Accuracy are illustrated in Figure 1. Overall, there was little variation between runs within the cross validation, and there were not any outliers. Sensitivity was around 50% for the 2% cut-off and 75% for the 5%. Specificity and NPV were much higher than 95% in both cut-offs. PPV was around 25% and 15% at the 2% and 5% cut-offs respectively. The accuracy of the model was above 95% in both instances. The results were almost identical between the development datasets and validation indicating good model definition. Mean model evaluation metrics at the 2% and 5% cut off points after 50-fold cross validation.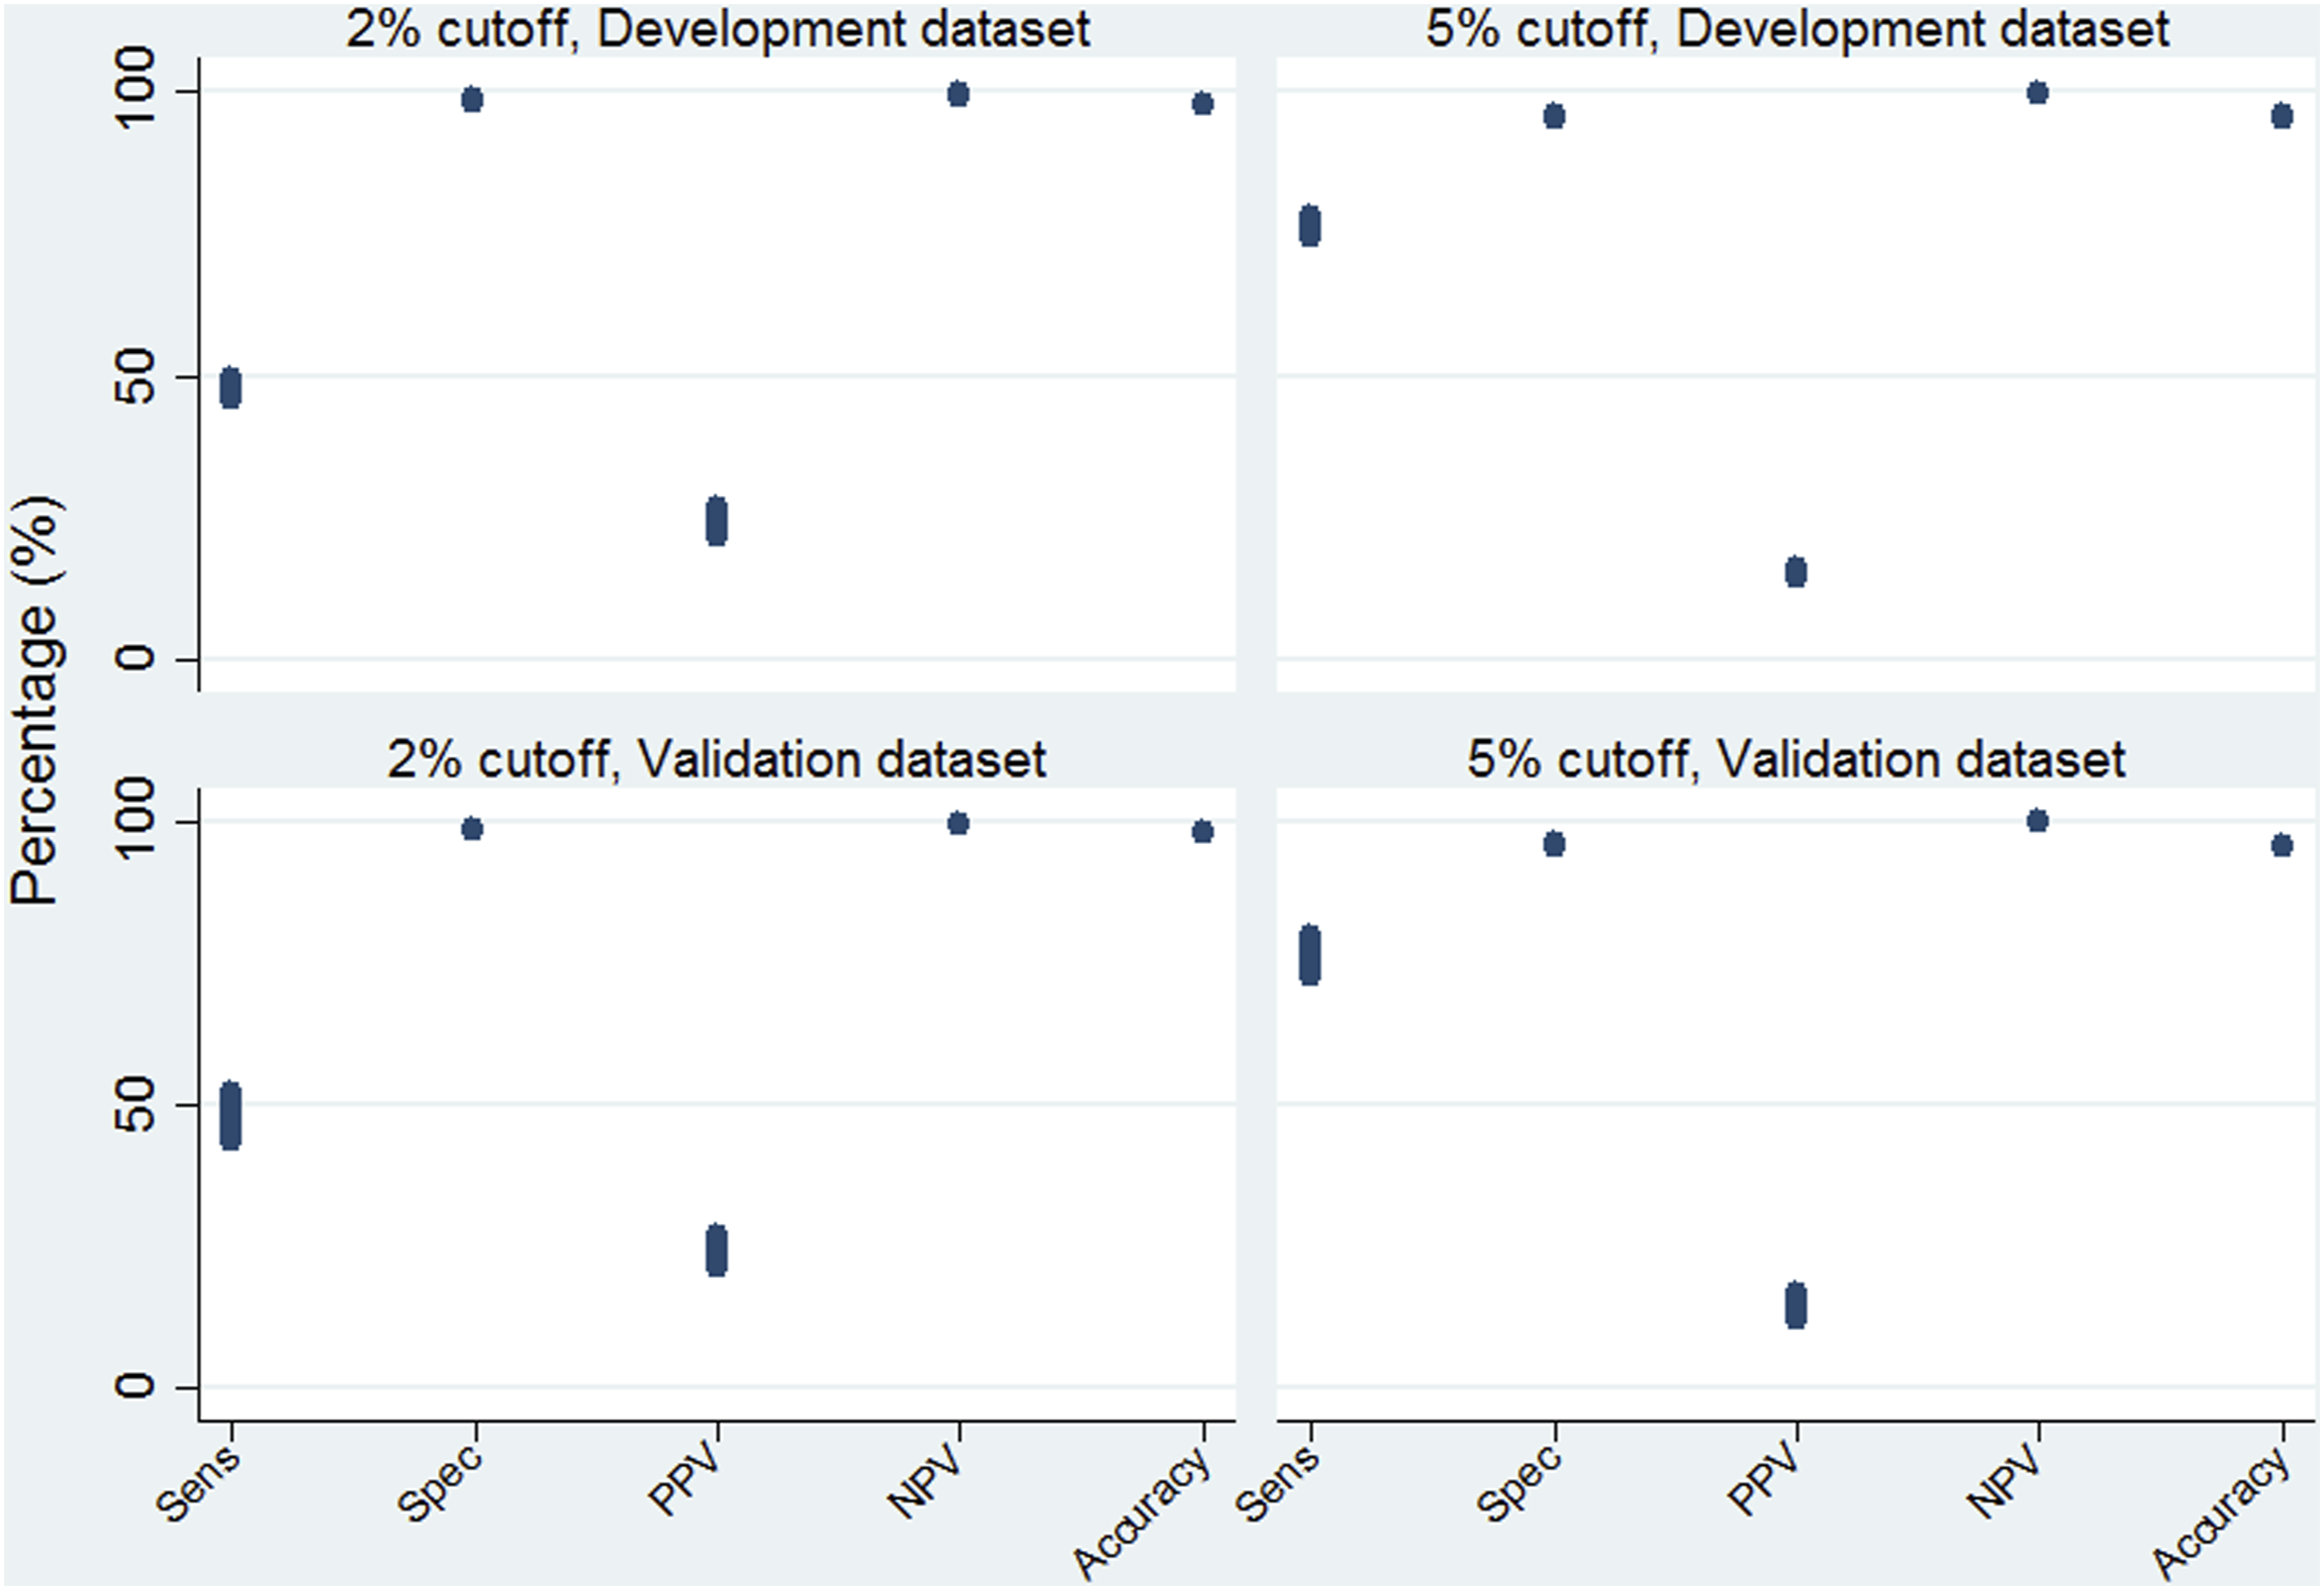
Emergency admissions prediction model with odds ratios and coefficient to be used in any health information system.
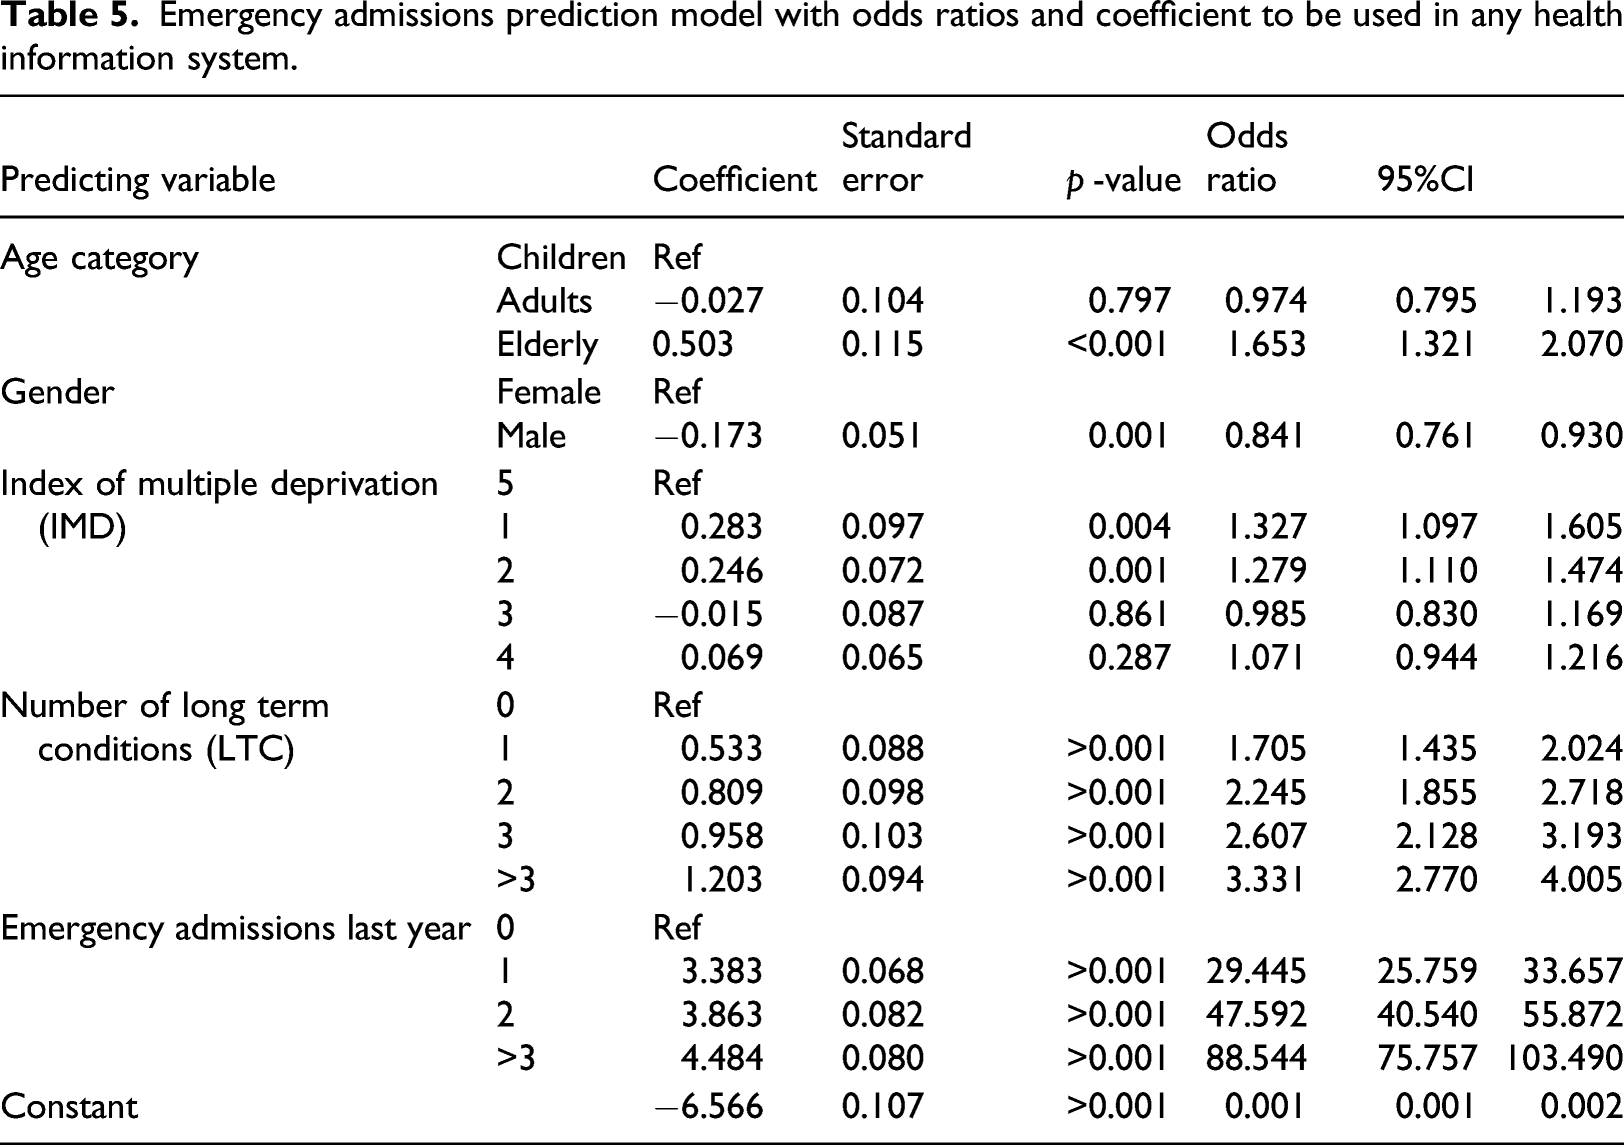
Table 4 and Table 5 illustrate that the coefficients and odds ratio of the 50-fold cross validation and the full model are almost identical, again indicating the robustness of the methods used in terms of the results being insensitive to noise and seemingly not prone to errors caused by variation. No significant difference between them at the p=0.05 value was observed. Overall, the older a patient is, the more likely they are to have an emergency admission over the next year compared to children, and provided that all other variables in the model are kept constant. Males are less likely to be emergently admitted to hospital compared with females. Socioeconomic status also has a role in the probability of emergency admission. Compared to the most affluent group (5th quintile) the least affluent (1st quintile) has raised odds of being admitted to the hospital. The same is true for the second quintile, but third and fourth socioeconomic status quintiles are statistically insignificant. The more LTC a patient has the more likely they are to be admitted to the hospital as an emergency admission. The last factor associated with increased odds of being admitted is the number of emergency admissions the patient had during the previous year.
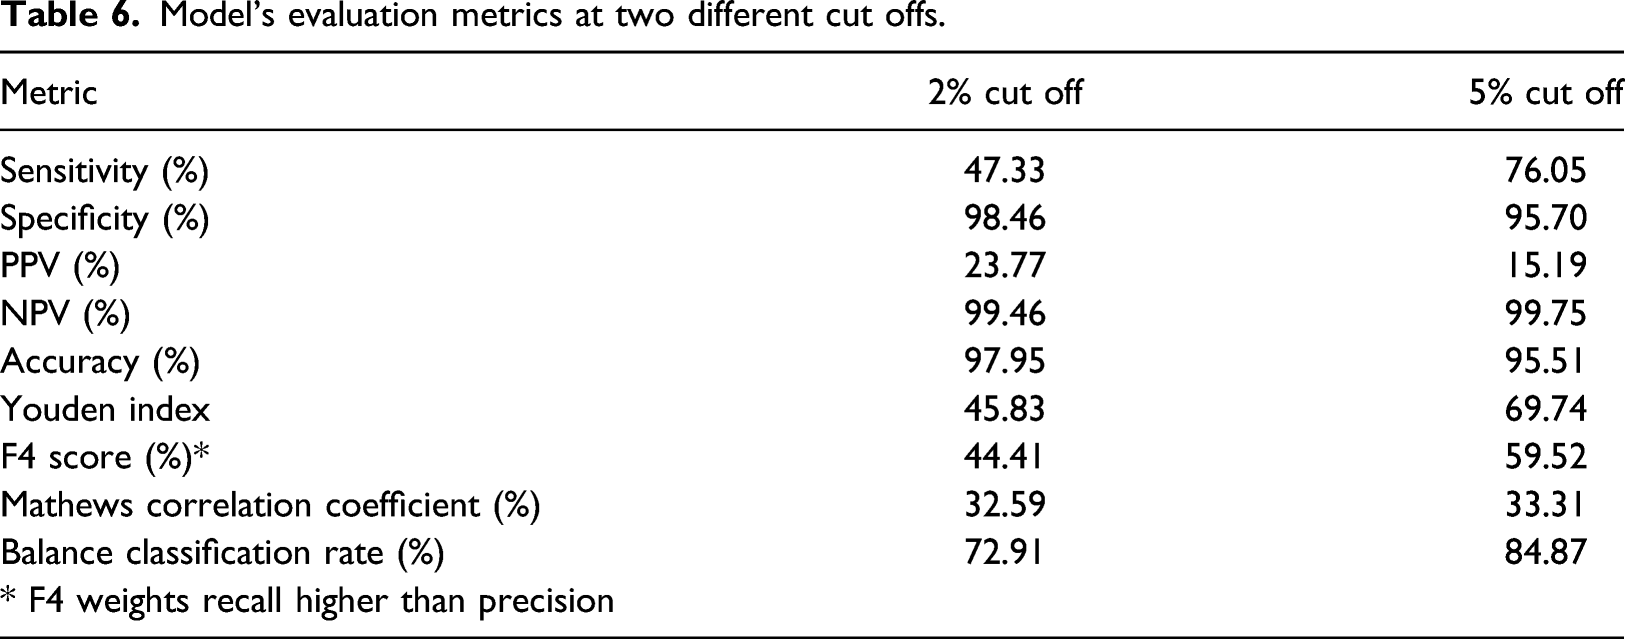
The model on the full dataset gave a discrimination AUC (95% CI) of the ROC curve of 0.9384 (0.9325–0.9443), Figure 2. This area under the curve is not significantly different to the mean AUC of the development and validation models discrimination metrics. The model on the full dataset was also evaluated on the same cut-offs as the cross validated samples, Table 6. The results were simillar to the cross validation runs of both the development and validation datasets. Sensitivity was around 457% for the 2% cut off and 756% for the 5%. PPV was 23.77% and 15.19% for the 2% and 5% cut off respectively. Specificity, NPV and Accuracy were above 95% in both cut offs. As our data were imbalanced, we also tested the models using additional methods such as Balance Classification rate, the F score and Mathews Correlation Coefficient, Table 6. As expected, the 5% cut-off generates slightly better performance metrics results as it is a bigger sample of people with higher probability of getting an emergency admission. The model has overall acceptable metrics, especially given its simplicity and associated perceived ease-of-use in different settings. ROC curve of the full model showing very good discrimination as indicated by the AUC statistic. Model’s evaluation metrics at two different cut offs.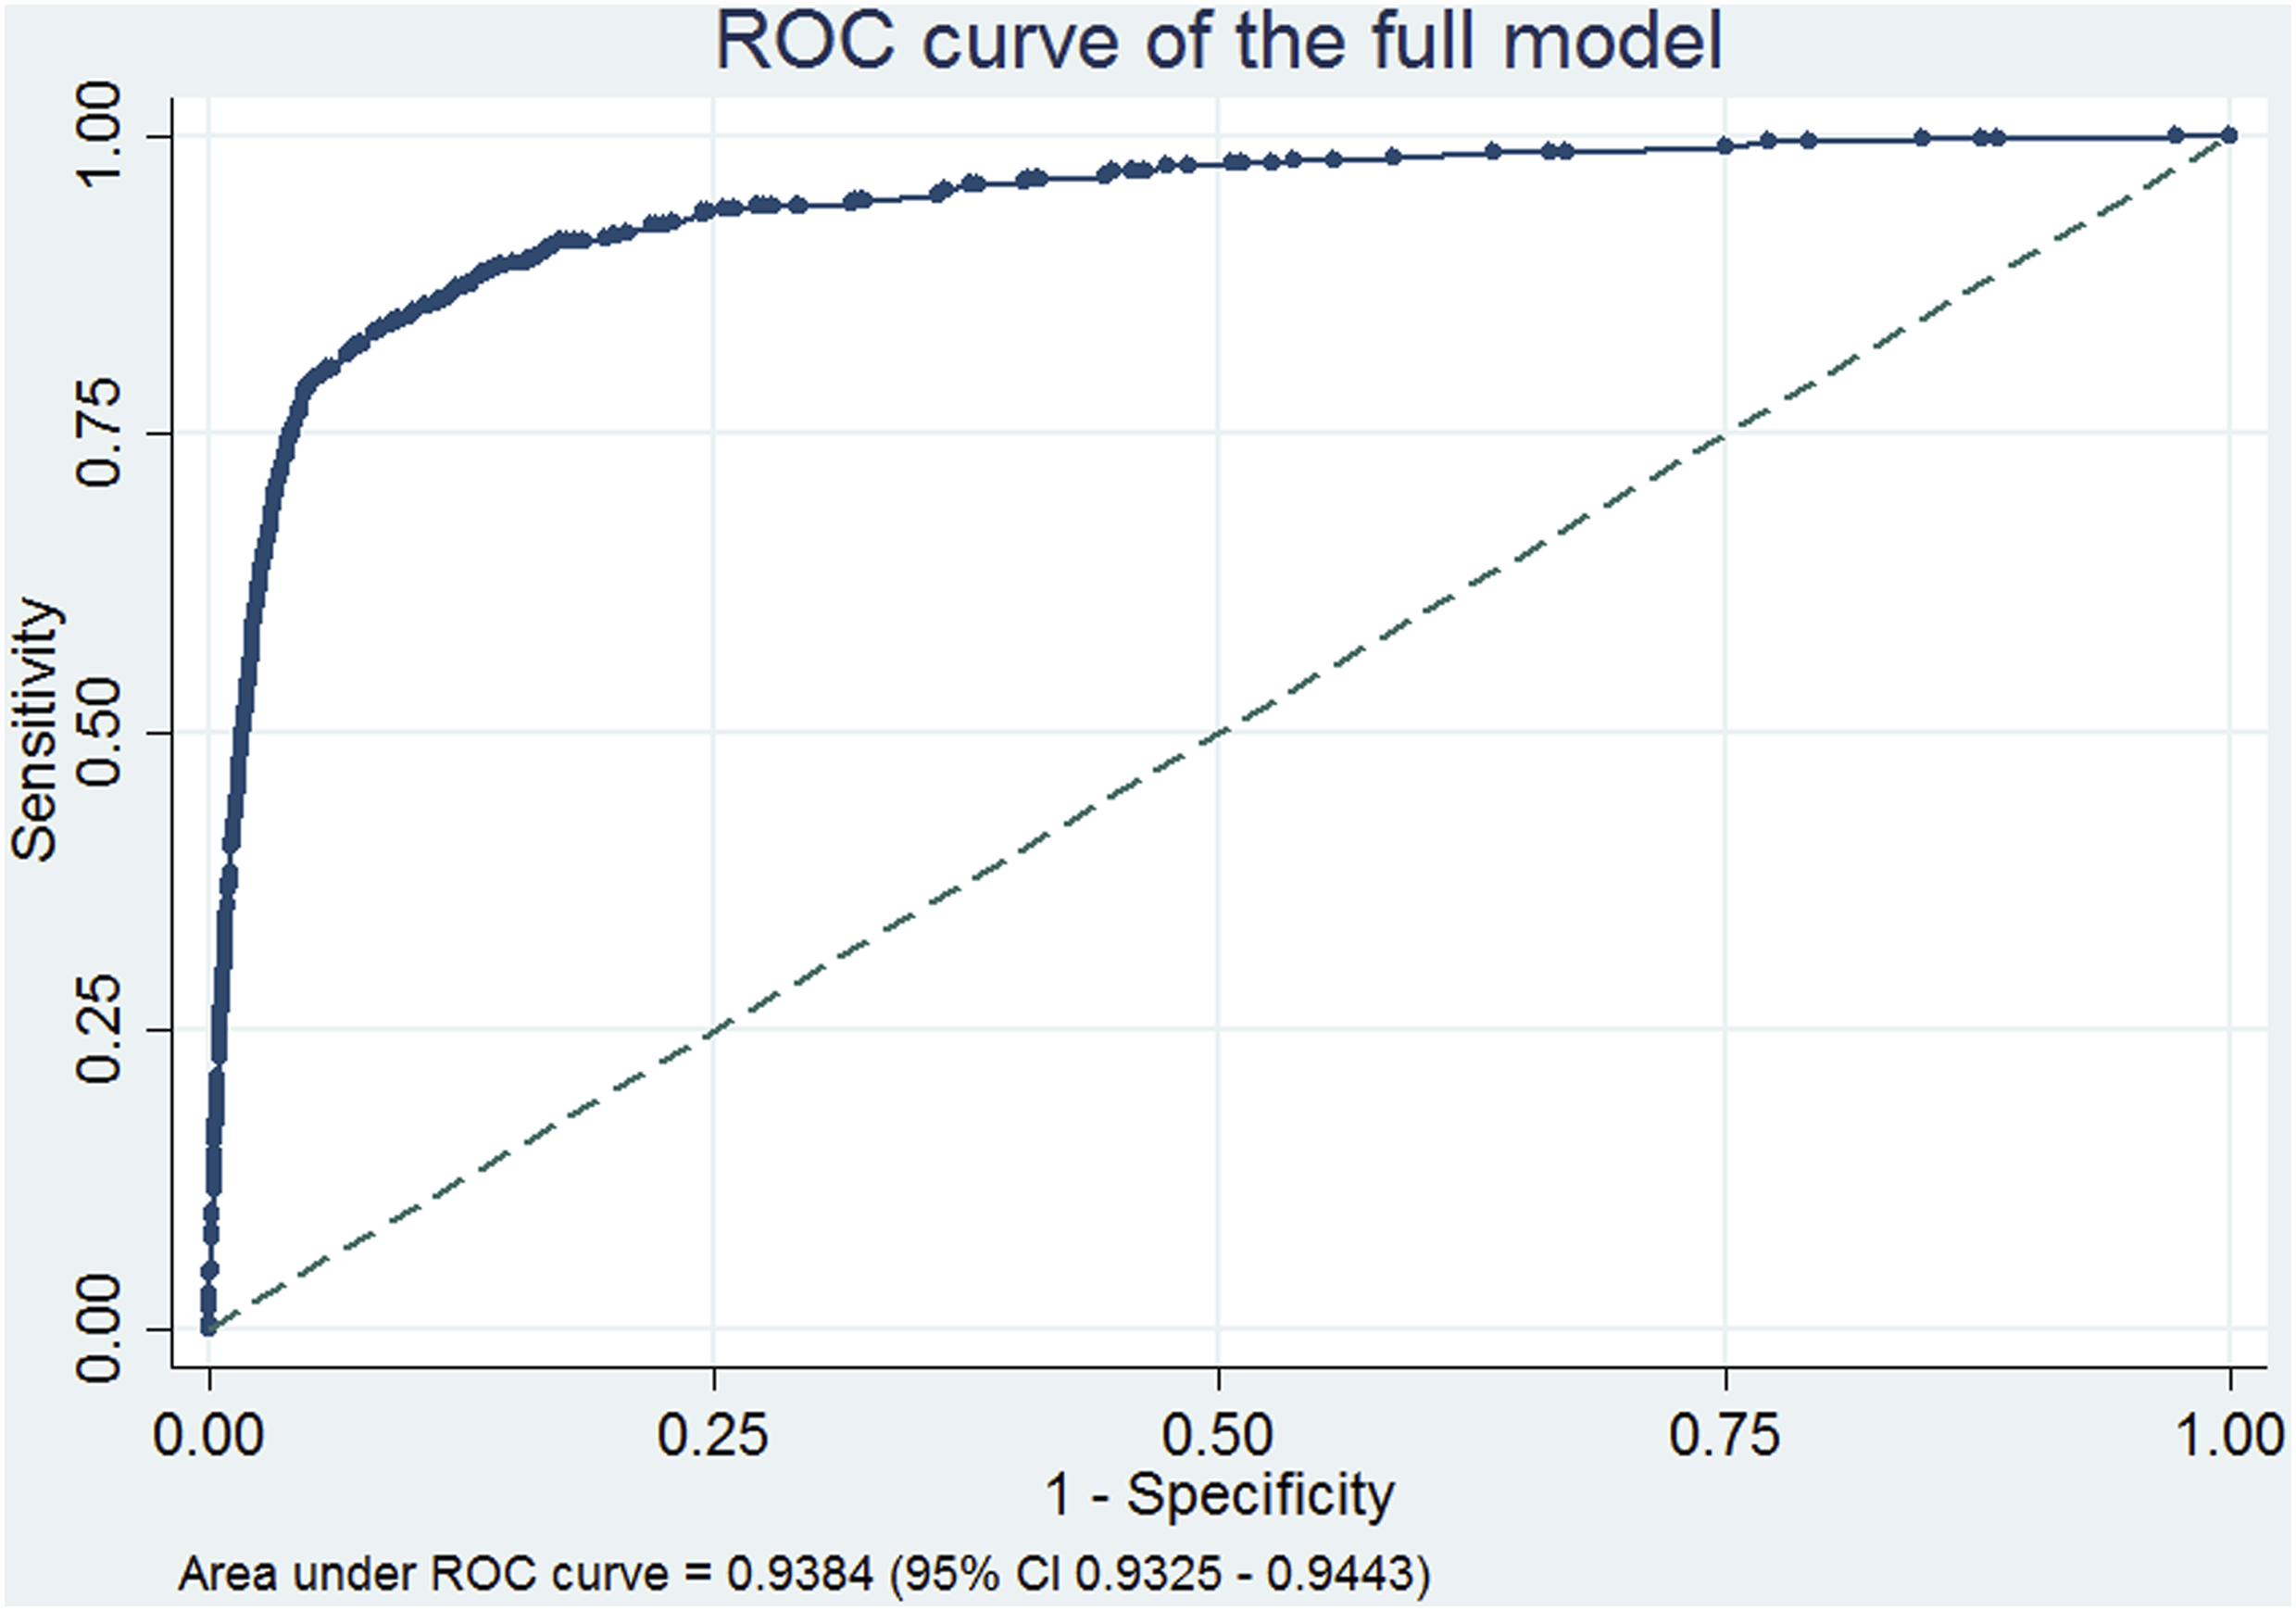
Discussion
In any health care system a small proportion of patients account for a large proportion of activity and costs. In England’s NHS approximately 50% of bed-days can be attributed to only 5% of all the population, in the US civilian population the top 1% of the population accounts for 22.8% of healthcare costs.51,52 Targeting individuals in the community that may present as unplanned emergency admissions by offering preventive care and support, not only has the potential of improving health outcomes but also of achieving substantial savings.
This research aimed to develop and validate a tailored made, statistically robust model capable of reliably predicting individuals at risk of emergency hospital admission. Our vision is that such a risk model can be implemented as part of a software tool that will support operationally the running of a case management intervention. This support will be provided either through identifying those individuals that are at high risk of admission (as determined by user-defined cut-off points) or by generating a ranked list of the population in order of calculated risk. This is in line with current trends of population health management efforts which aim at using data insights from multiple sources to develop services that are proactive and tailor made to the needs of individuals as well as the healthcare system.53–56
We did not only focus on routinely collected hospital activity data but combined this with primary care data. According to a recent systematic review looking at emergency admission prediction models, the risk models developed using a combination of data sources tend to perform better. 37 In addition to the benefit of a richer selection of variables that can be part of the prediction model, combining hospital activity with population data helps in minimising the ‘regression to the mean’ bias. In this particular case, this bias arises as people that are having frequent hospital admission at a particular point in time will, on average, have lower rates of unplanned hospital admission in the future even without intervention. 3 We attempted to minimise this bias by defining the study population at the entire community (regional) level as opposed to only those individuals that have been hospitalised.
A simplified scoring system was not developed since such approximations are redundant in the age of ubiquitous computing. 30 The model’s simplicity is also demonstrated in the choice of using number of LTCs with the simplifying assumption that they all contribute equally to the risk of 12-month emergency hospital admission. Part of the benefit is that it can then be widely applied in different setting that may be using different classifications for recording long-term conditions.
We specifically sought to make the model outputs as easy to use and interpret by end users, as possible. We cannot stress this enough, but the choice of the method used should always meet end-user expectations and expertise.57–60 Models developed using machine learning approaches are usually seen as black boxes by clinicians and policy makers, and are either abandoned or lead to inappropriate use.61–63 Sometimes simple models such as logistic regression provide greater interpretability inspiring more confidence in their use. We used relatively simple techniques and resampling methods in our effort to maximise the empirical value of the data. The model is not a black box and we are not adopting an approach that precludes us from publishing our regression formula. The coefficients can be used to calculate the predicted probabilities and can be added to any clinical information systems with ease.
As with all risk models, our model needs to be kept up to date as it may need to be recalibrated or reconstructed in response to a changing risk/treatment environment. It was constructed using best practice statistical methods, with the exception of external validation with a different data source.64–67
Limitations
The main limitation of the study is that external validation was performed by splitting of data from a single source rather than validation in a separately sourced dataset. Nevertheless, this is common practice in many similar studies. To overcome this limitation, we performed a cross validation exercise with 50 different samples drawn from the original dataset without restricting the characteristics of each sample. The results showed that samples had relatively similar characteristics and the coefficients of the models developed had very small variation between them.
Another limitation is the imbalance between the datasets and the outcome under investigation. This may also be a contributing factor to the issues in relation to the calibration test. In particular, the model’s Hosmer Lemeshow χ2 (10 degrees of freedom) was significant for all 50 samples. This is not expected in prediction models as calibration is a metric of model fit. We attribute this to the substantial imbalance between the two classes of the outcome, and the fact that the vast majority of the population has no emergency hospital admission within 12 months (approximately 99%). The Hosmer–Lemeshow test is known to be sensitive to small datasets as well as the number of groups the predicted probabilities are assigned to. Thus with 10 groups, which is the typical number used in such a test our model failed to pass this test, but this was not the case when we increased the number to over 100 groups. As we highlighted earlier, none of the relevant studies found in the extant literature reported on the models’ calibration tests. Despite this, the accuracy of the model was still very high.
Issues around model implementation
We have provided two examples of cut-off levels for people at high risk of emergency admission which we considered as realistic. These levels were chosen after discussions we had with stakeholders who were identified as potential end users of the model – something we did not observe in the literature. Models which have been published and their performance metrics were reported based on arbitrary cut-offs or the traditional 50% level. 68 The cut-offs we chose are not definitive and the model’s performance can be assessed at different levels. For a more definitive cut-off threshold, a cost effectiveness analysis should be performed which is outside the scope of this study. Lowering the cut-off threshold will result in flagging more individuals as candidates for receiving the intervention, thus incurring potentially increased costs.
The other potential challenge in implementing the risk model is that of the data. As the model uses a dataset resulting from linking population and hospital activity data, a platform would be necessary to host the linked datasets so that they will coexist as one. This can potentially be overcome by getting a fresh extract of both datasets at an agreed time interval (i.e. 3, 6 months) and rerunning the model. This can be used for recalibration of the model as well as avoiding provision of the intervention to individuals that have either been admitted or have already received intervention. This option would enable the formula of the risk model, with the specific coefficients for each predictor variable, to be applied providing an emergency admission probability on an individual basis. An additional challenge of implementing such a solution in a country with a stringent information governance framework (such as the UK) relates to obtaining the necessary approvals but such issues lie beyond the remit of this paper.
The proof of utility of any mathematical modelling linked to a potential intervention is to test the model and intervention in a clinical setting. The potential of using data analytics combined with clinical management to identify patients who will most benefit from target interventions is huge. 36 An online search of population health and data analytics reveals the major commercial interest in this area; the challenge is to combine the analytics with effective clinical interventions.
Another challenge faced by those developing statistical models is that of external validation, either through testing the model on different data or using the output of another model as benchmark for comparison purposes. The latter is not always feasible as relevant studies do not always report the statistical formula developed or the differences between the variables used as inputs. In the absence of such opportunities, we attempted to mitigate this shortcoming by splitting the data and performing the validation part of the process on the unused data. The purpose of this paper was to develop a statistical model based on a well-known and tested methodology so that end users would feel comfortable using and model comparison can be the aim of further research.
Conclusion
In conclusion, the internally validated model we reported here can predict with high accuracy the risk of emergency admisions to hospital within the 12 next months at an individual patient level. Its relative simplicity makes it easily implementable within a decision support tool to assist with the management of individual patients in the community. The risk model was developed in consultation with potential end-users and by involving them in various stages of its development. The model uses a combination of routinely collected hospital data and primary care data. The model’s very high predictive power points towards the type of predictive variables, data sources and statistical methods that need to be employed when developing such a tool in different real-life settings.
This study showed that relatively simple and computationally efficient statistical techniques and routinely collected data readily available in different health and care settings can be used to support the development of decision support tools capable of more precise targeting of at risk individuals. This increased precision should help health care providers in a cost efficient manner, to identify patients at risk of emergency admission enabling interventions to occur to avoid emergency care. Additional research and development would be needed to incorporate such a risk model into routine practice, and to assess its utility and effectiveness in real life settings
Footnotes
Declaration of interest
The author(s) declared the following potential conflicts of interest with respect to the research, authorship, and/or publication of this article: Jason Young was the Chief Information Officer of BaNES CCG at the time of this study, which provided the data for this study. BaNES CCG as an organisation has been superseded by BSW CCG.
Funding
The author(s) received no financial support for the research, authorship, and/or publication of this article.