
Abstract
There are concerns that physicians serving low-income, Medicaid patients, in the United States are less likely to adopt electronic health records and, if so, that Medicaid patients will be denied the benefits from electronic health record use. This study seeks to determine whether physicians treating Medicaid patients were less likely to have adopted electronic health records. Physician surveys completed during physicians’ license renewal process in Arizona were merged with the physician licensing data and Medicaid administrative claims data. Survey responses were received from 50.7 percent (6,780 out of 13,380) of all physicians practicing in Arizona. Physician survey responses were used to identify whether the physician used electronic health records and the degree to which the physician exchanged electronic health records with other health-care providers. Medicaid claims data were used to identify which physicians provided health care to Medicaid beneficiaries. The primary outcome of interest was whether Medicaid providers were more or less likely to have adopted electronic health records. Logistic regression analysis was used to estimate average marginal effects. In multivariate analysis, physicians with 20 or more Medicaid patients during the survey cycle were 4.1 percent more likely to use an electronic health record and 5.2 percent more likely to be able to transmit electronic health records to at least one health-care provider outside of their practice. These effects increase in magnitude when the analysis is restricted to solo practice physicians This is the first study to find a pro-Medicaid gap in electronic health record adoption suggesting that the low income patients served by Arizona’s Health Care Cost Containment System are not at a disadvantage with regard to electronic health record access and that Arizona’s model of promoting electronic health record adoption merits further study.
Introduction and background
Physicians have been slow to adopt electronic health records (EHRs), despite benefits that include the avoidance of duplicative testing and the minimization of medical errors.1–8 There are concerns that physicians serving low-income, Medicaid patients in the United States will be less likely to adopt EHRs and, if that is the case, that Medicaid patients will be denied the benefits from EHR use. This article addresses the question of differential use of EHRs between physicians serving Medicaid and non-Medicaid patients using a unique data set that combines Medicaid claims data with physician licensing data and a large survey of EHR use among physicians in the state of Arizona.
Previous research on EHR adoption offers mixed results. Physicians serving uninsured or Medicaid patients were 3 to 5 percent less likely to adopt EHR systems after controlling for provider and patient characteristics. 9 Shields et al. 10 found that Community Health Centers (CHCs) are less likely to have EHRs if the percentage of uninsured patients was above the survey median or the percentage of patients with incomes below the poverty level was above the survey median.
Other studies, however, do not find an adoption gap. Shields et al. 11 analyzed the 2008 HIT Adoption Initiative national survey, which asked physicians to describe their practice, the patients they serve, and the degree to which they had adopted EHR systems. They found no significant differences in EHR adoption between physicians who serve a high percentage of traditionally underserved patients and physicians serving more affluent patients. Using the 2005 Medical Group Management Association’s nationally representative sample of physician practices matched to the 2000 Census county-level characteristics, they also found no statistically significant relationship between the percentage of minorities nor the fraction of families below the Federal Poverty Level on EHR adoption after controlling for practice size and geographic region.
Jha et al. 12 found no evidence that practices in Massachusetts with a relatively large proportion of minority patients differ in EHR system adoption or perceptions of EHR usefulness than other practices after controlling for practice type, size, whether it was hospital based, had residents present in the practice, and urban location.
This article compares utilization of EHRs among physicians in the United States with predominantly low-income, ethnic minority patients (identified by Medicaid status) to physicians who primarily serve privately insured patients. The data are drawn from an ongoing survey on all allopathic and osteopathic physicians practicing in Arizona, merged with data collected for licensing and with Medicaid claims data.
Arizona includes an unusually high proportion of low-income and uninsured patients compared to other states. In 2009, 17.8 percent of the Arizonians under the age of 65 years were below the poverty line and 19.8 percent were uninsured compared to 15 percent below the poverty line and 17.2 percent uninsured nationally. Arizona’s below 65 years population is 33.7 percent Hispanics of which 29.2 percent are uninsured, and 4.9 percent are Native Americans, of which 36.4 percent are uninsured. 13 Arizona ranks ninth in the nation for the proportion of the total population below the poverty line and seventh for the proportion of uninsured people. Medicare, a national insurance program, guarantees access to health care to Americans of ages 65 years and older. Medicare covers approximately half the cost for its enrollees (http://facts.kff.org/chart.aspx?cb=58&sctn=168&ch=1785).
The relatively high levels of poverty in Arizona, and associated lack of health insurance coverage, provide an ideal environment for testing the potential impact of EHRs on the uninsured. The importance of this impact may be of limited importance in other developed Western countries because health insurance coverage is generally much greater in those countries than in the United States.
The survey was included with physicians’ licensing renewal applications for an entire renewal cycle. The allopathic physicians renew their licenses on their birthdays every 2 years. The osteopathic physicians renew their licenses during the Fall in every other year. The data cover the period July 2007–June 2009. Approximately one-half of all the practicing physicians in the state responded to the survey. The data also include the licensing information, which is required for every physician. We present results at the physician level, testing for the presence of an adoption gap between physicians who are Medicaid providers (the Arizona Medicaid system is named Arizona Health Care Cost Containment System (AHCCCS)) and those who are not.
Method and data
Design, survey instrument
The EHR survey was implemented on 17 July 2007 in cooperation with the Arizona Medical Board (AMB) for allopathic physicians and the Arizona Board of Osteopathic Examiners (ABOE) on 1 November 2007 for osteopathic physicians. Allopathic and osteopathic physicians must pass comparable state examinations. Both groups can practice primary or specialty medicine if they complete the appropriate residencies or fellowships. 14
Six optional survey questions with subparts were included with physicians’ license renewal applications. The response rate was 50.7 percent (6,780 out of 13,380 physicians practicing in Arizona). One important distinction between this study and the usual criterion for an adequate response rate for survey interviews is that all active physicians in Arizona are potential respondents (i.e. the population of physicians rather than a sample). Surveys are typically based on samples, and response rates are calculated based on potential respondents (the members of the sample). For example, consider a sample of 30 percent of the target population (that would be a generous sample size). A response rate of 70 percent would capture 21 percent of the population that the sample was selected to represent. In the current situation, we captured 51 percent of the population.
From AHCCCS administrative claims and lists of physicians who accept AHCCCS patients, we generated a Medicaid patient count total for all physicians in Arizona. We merged the Medicaid patient count total to the licensing renewal data. Survey responses were merged with individual physician license renewal information for all respondents. Our final data consisted of renewal applications with a Medicaid patient count total for the 2-year survey cycle merged with the survey responses. Some physicians were registered Medicaid providers with no patients. We define a Medicaid provider as a physician who had 20 or more Medicaid patients (not encounters) during the survey cycle. The 20-patient selection criterion is based on the results of a previous study of AHCCCS providers that indicated that providers with only occasional contact with Medicaid patients were not representative of the average Medicaid provider. 15
Measures of EHR access
In the survey, physicians were asked to identify how medical records are stored in their practice or organization:
4. Are patient’s medical records in your practice/organization stored as:

A separate question was asked concerning the practice’s ability to exchange information with other organizations:

Physicians whose EHR system was connected to one or more other health-care providers are defined as having a “connected” EHR (CEHR). EHR systems connected to all of the above were identified as having a “fully connected” EHR (FCEHR), recognizing that connectivity is not necessarily synonymous with functionality, such as that required by the meaningful use criteria.
Primary care is defined to include physicians whose specialty is either family care, general practice, geriatrics, internal medicine, or pediatrics. Physicians were permitted to report more than one specialty on the license renewal form. We adopt the first specialty reported and do not classify physicians by multiple specialties. Physicians reporting two specialties account for 34.29 percent of all the practicing physicians. Physicians in the survey were also asked to characterize their practice:
1. How would you best characterize your practice? (PLEASE DO NOT CHECK MORE THAN TWO
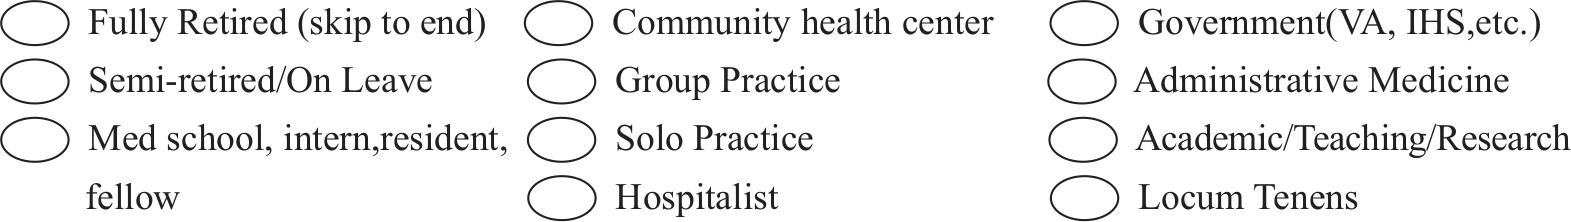
Approximately 5,974 of the 6,780 respondents selected only one practice category. An additional 714 physicians added a second category. For those physicians who indicated more than one characterization for their practice, we adopted the following classification scheme: First, if the physician checks fully retired or semiretired or med school/resident or locum tenens, then he or she is assigned to the category checked and not included in any other category. Second, if a physician is not included in the first step above and lists government, then he or she is included only in the government category. Third, if a physician is not included in the first or second step and lists administrative medicine, then he or she is included only in the administrative medicine category. Fourth, if a physician is not included in steps 1–3 and lists solo practice, then he or she is included only in the solo practice category. Fifth, if a physician is not included in steps 1–4 and lists group practice, then he or she is included only in the group practice category. Sixth, if a physician is not included in steps 1–5 and lists CHC, then he or she is included only in the CHC category. Seventh, if a physician is not included in steps 1–6 and lists academic research/teaching, then he or she is included only in the academic research/teaching category. Eighth, if a physician is not included in steps 1–7 and lists hospitalist, then he or she is included only in the hospitalist category. Ninth, any remaining cases are listed as missing for type of practice. The primary results of our analysis are not sensitive to the inclusion of the physicians with multiple practice characterizations, so the reported results include them in the analysis. We restrict our multivariate analysis to group, solo, hospital, and CHC practice physicians because these practice types are most likely to deliver health care to patients.
The data required for licensing for all physicians were used to compare the characteristics of the survey respondents to the nonrespondents, namely, age, gender, geographic location, Doctor of Medicine (MD) versus Doctors of Osteopathy (DO), primary care provider or specialist, and whether the physician had a Medicaid patient in the last 2 years. The summary statistics (two-tailed chi-square tests) partitioned by survey response are described in columns 1 and 2 of Table 1. The asterisks in column 1 indicate a statistically significant difference between respondents and nonrespondents. The differences between respondents and nonrespondents are small. Respondents are more likely to be Medicaid providers (63.9% compared to 60.7% for nonrespondents), more likely to be female, older, MDs versus DOs, and more likely to be primary care providers than specialists.
Summary statistics by survey response, Medicaid provider status for respondents.
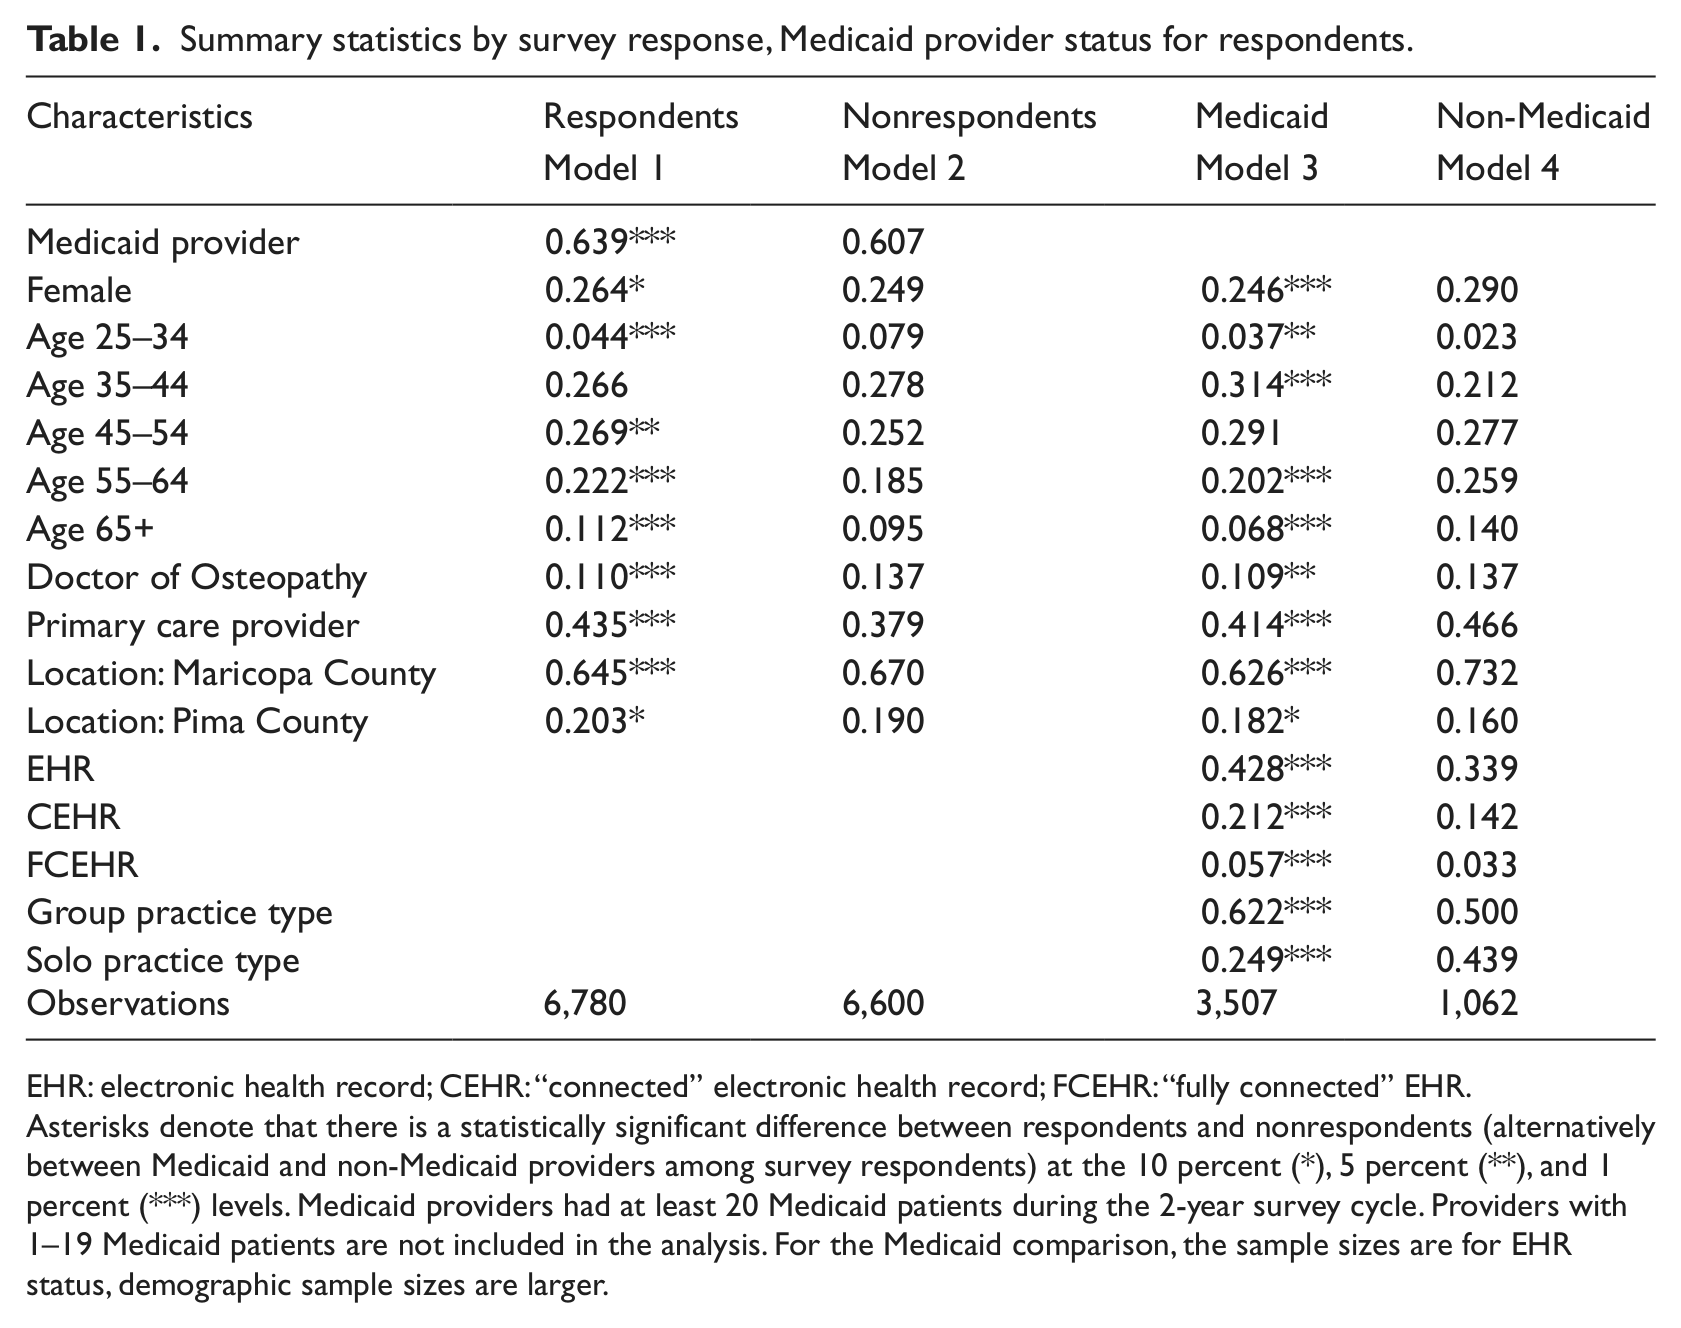
EHR: electronic health record; CEHR: “connected” electronic health record; FCEHR: “fully connected” EHR.
Asterisks denote that there is a statistically significant difference between respondents and nonrespondents (alternatively between Medicaid and non-Medicaid providers among survey respondents) at the 10 percent (*), 5 percent (**), and 1 percent (***) levels. Medicaid providers had at least 20 Medicaid patients during the 2-year survey cycle. Providers with 1–19 Medicaid patients are not included in the analysis. For the Medicaid comparison, the sample sizes are for EHR status, demographic sample sizes are larger.
Results
Statistical analysis
Table 1 compares Medicaid providers (column 3) to non-Medicaid providers (column 4), who responded to the survey, using two-tailed chi-square tests. The asterisks in column 3 indicate a statistically significant difference from non-Medicaid providers. Medicaid providers (physicians with 20 or more Medicaid patients) are more likely to be male, younger, allopathic physicians, and more likely to be in a group practice. Medicaid providers are 8.9 percent more likely (42.8 vs 33.9 percent) to have access to an EHR and 7 percent more likely (21.2 vs 14.2 percent) to have a CEHR, and 2.4 percent more likely (5.7 vs 3.3 percent) to have an FCEHR, all differences are statistically significant at the 1 percent level.
Multivariate analysis
Given the differences in demographic characteristics between Medicaid and non-Medicaid providers (particularly, age and practice type), we regressed each measure of EHR access (EHR, CEHR, and FCEHR) on various characteristics of the physicians, as given in equation (1) using logistic regression analysis

Medicaid is equal to 1, if physician i had at least 20 Medicaid patients during the 2-year survey cycle, and Pj indicates the different indicator variables for practice type (group is the omitted category). Age is classified into five categories: (1) 25–34, (2) 35–44, (3) 45–54, (4) 55–64, and (5) 65 or more years old (the omitted category). The analysis includes county-fixed effects, Ck The Xi matrix includes physician characteristics, namely, gender (male is omitted), primary care physician, and DO versus MD (omitted).
We performed alternate specifications of equation (1) with different Medicaid identifiers. In Tables 2 to 3, model 1 (column 1) is the baseline model where a Medicaid provider is defined as a physician with at least 20 Medicaid patients during the survey cycle. We also estimated equation (1) defining a Medicaid provider as a physician with one or more Medicaid patients. The results of that estimation (which are omitted) were quantitatively similar.
Logistic EHR average marginal effects.
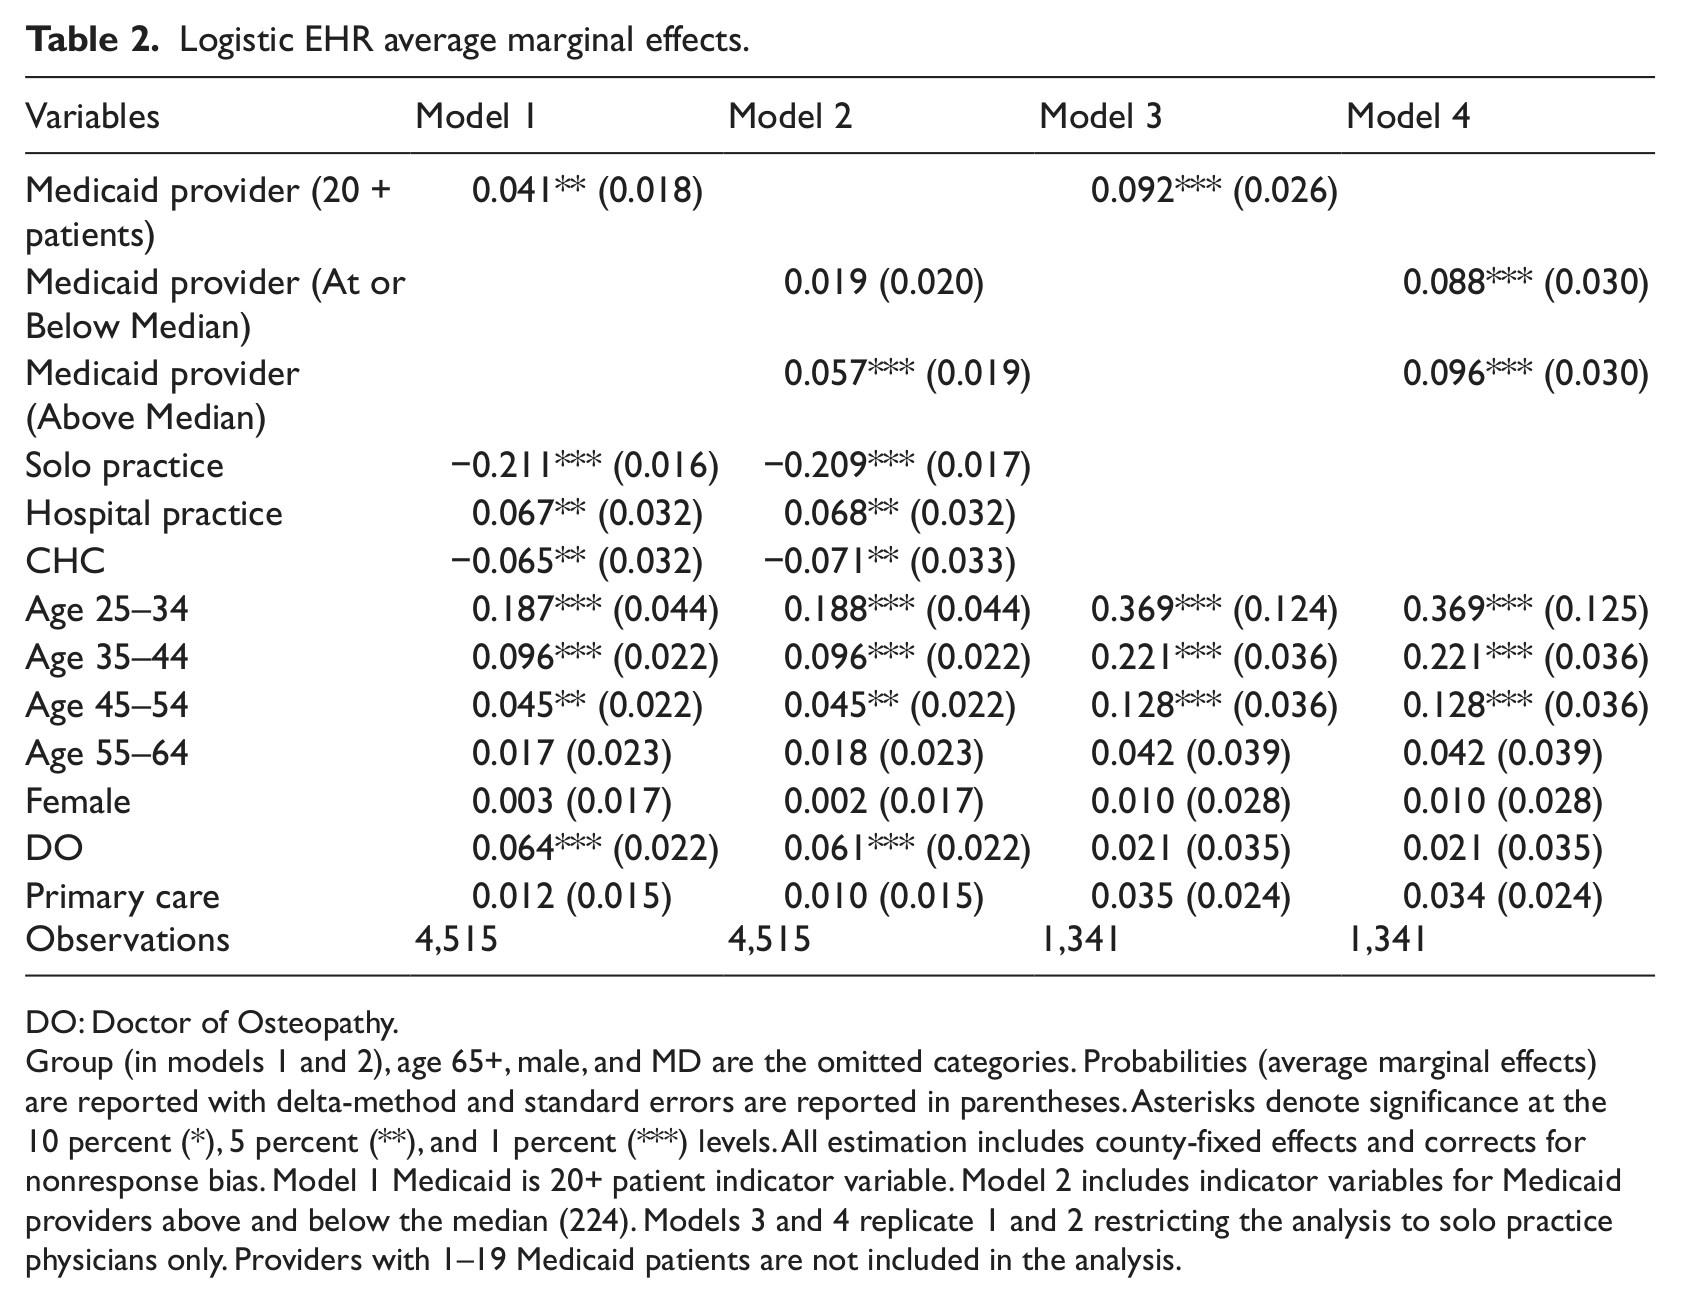
DO: Doctor of Osteopathy.
Group (in models 1 and 2), age 65+, male, and MD are the omitted categories. Probabilities (average marginal effects) are reported with delta-method and standard errors are reported in parentheses. Asterisks denote significance at the 10 percent (*), 5 percent (**), and 1 percent (***) levels. All estimation includes county-fixed effects and corrects for nonresponse bias. Model 1 Medicaid is 20+ patient indicator variable. Model 2 includes indicator variables for Medicaid providers above and below the median (224). Models 3 and 4 replicate 1 and 2 restricting the analysis to solo practice physicians only. Providers with 1–19 Medicaid patients are not included in the analysis.
Logistic “connected” and “fully connected” EHR average marginal effects.
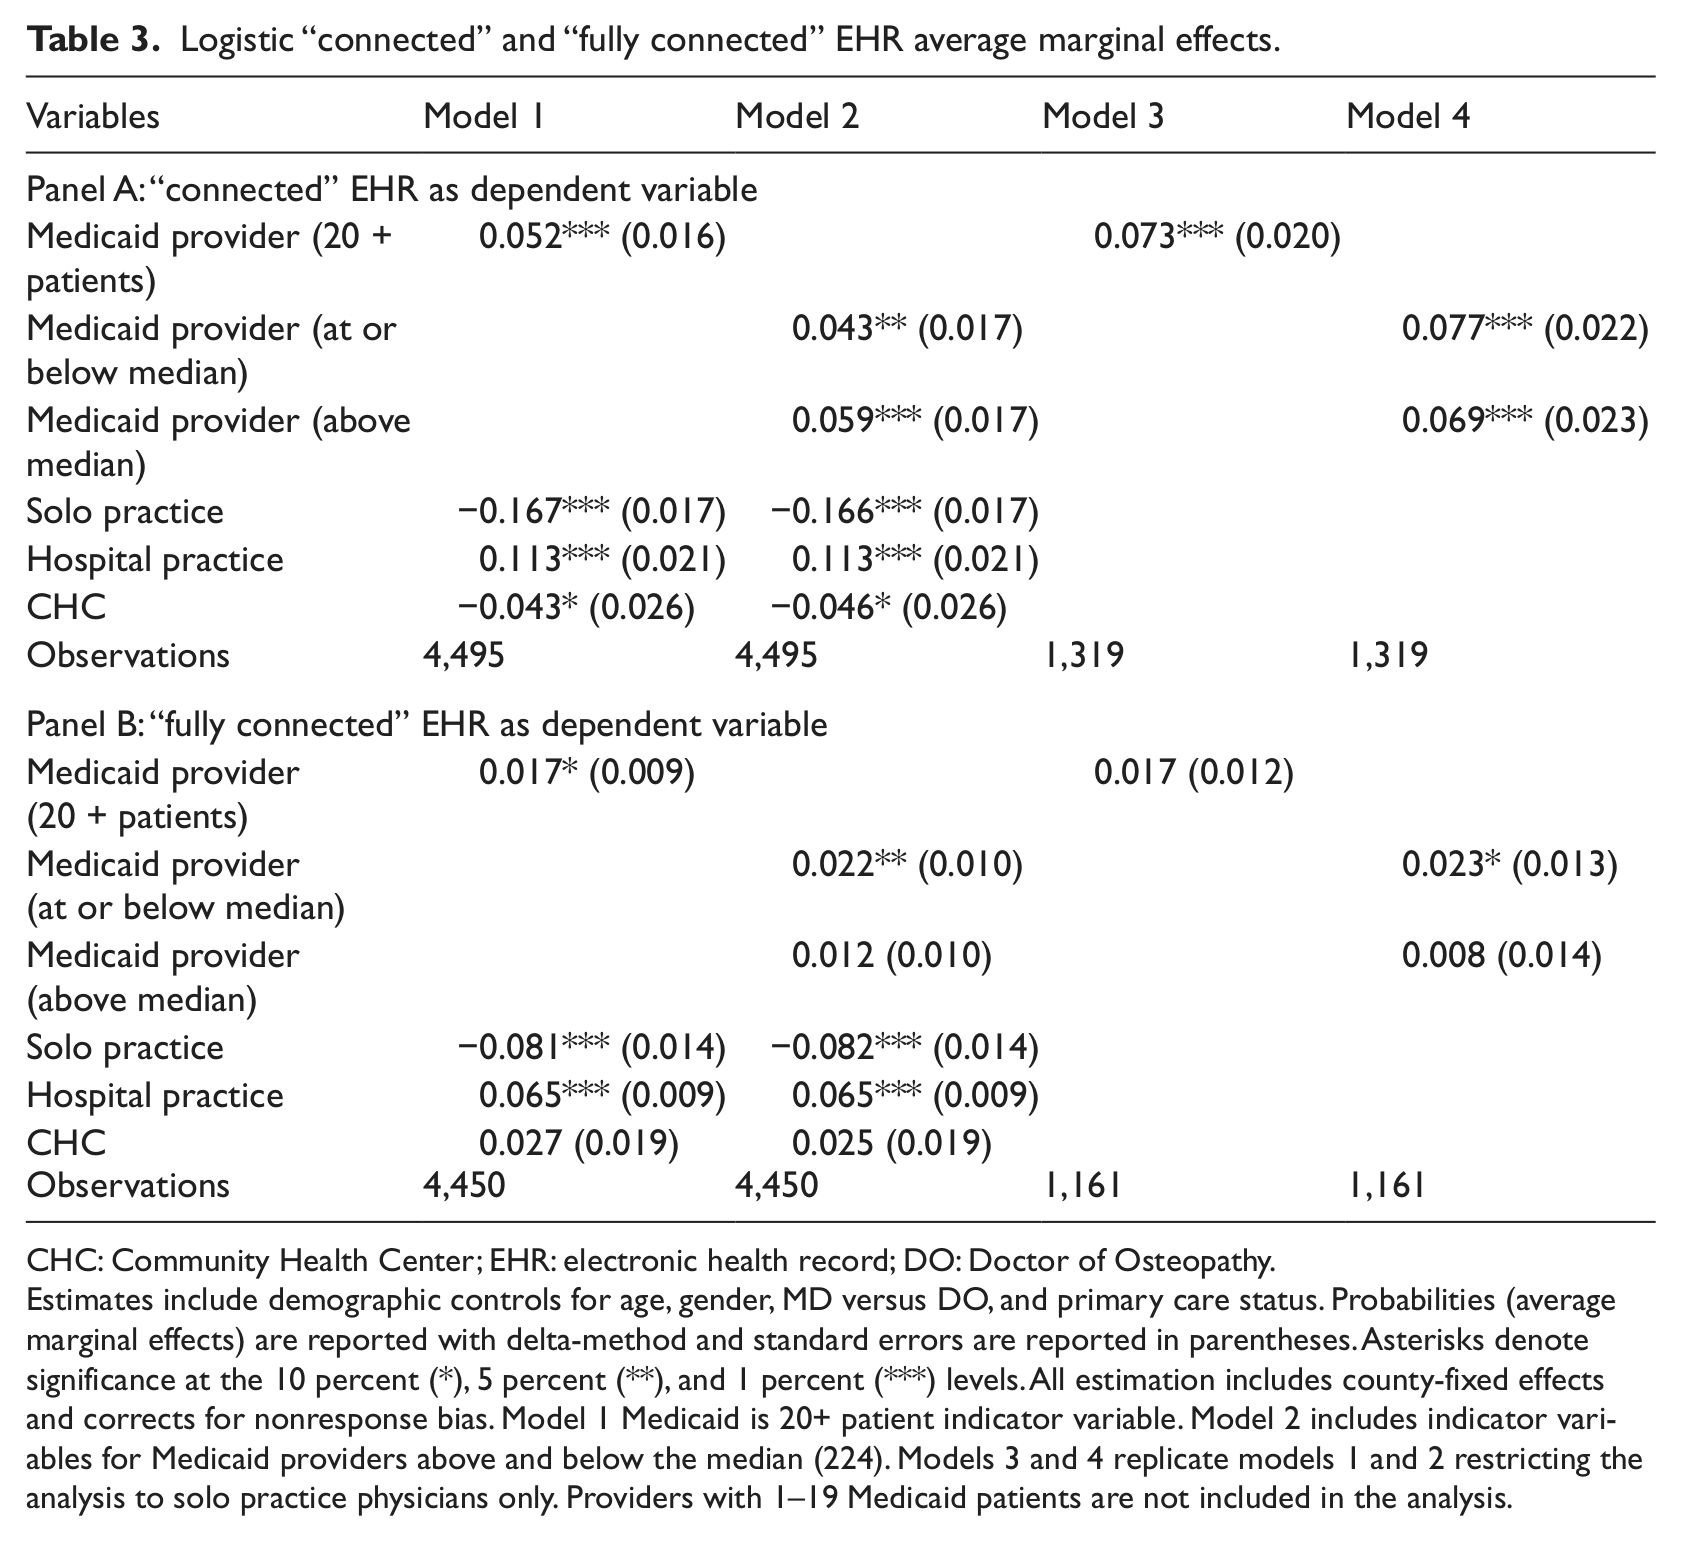
CHC: Community Health Center; EHR: electronic health record; DO: Doctor of Osteopathy.
Estimates include demographic controls for age, gender, MD versus DO, and primary care status. Probabilities (average marginal effects) are reported with delta-method and standard errors are reported in parentheses. Asterisks denote significance at the 10 percent (*), 5 percent (**), and 1 percent (***) levels. All estimation includes county-fixed effects and corrects for nonresponse bias. Model 1 Medicaid is 20+ patient indicator variable. Model 2 includes indicator variables for Medicaid providers above and below the median (224). Models 3 and 4 replicate models 1 and 2 restricting the analysis to solo practice physicians only. Providers with 1–19 Medicaid patients are not included in the analysis.
Model 2 (column 2) includes two indicator variables, one indicator variable identifying physicians who treated 224 or less patients (224 was the median number of Medicaid patients treated by Medicaid physicians) and one indicator variable for physicians treating more than the median number. This allows us to distinguish between low- and high-volume Medicaid providers. Previous research finds practice type and size to be important predictors of EHR adoption.1,4–8 Because we do not directly observe practice size but only practice type, we duplicate our estimation of models 1 and 2 in models 3 and 4 (columns 3 and 4), restricting the analysis to solo practice physicians. The models 3 and 4 provide a robustness check to our results and mitigate any impact that unobserved practice size might have on the unrestricted analysis.
Although our response rates are quite high relative to the common practice, we have evaluated the potential effect of selection bias associated with nonresponse because we have the licensing information on nonrespondents as well as the respondents from the population not usually available when surveys are based on samples (see Table 1). We use the information from that analysis to adjust for potential nonresponse bias in the multivariate estimates. Our multivariate estimate adjusts for nonresponse bias by estimating the probability of responding to the survey for each physician, given their renewal license demographic data. Age categories, gender, MD versus DO, county identifiers, primary care versus specialty care, and whether the physician is a Medicaid provider were used to calculate individual response probabilities. We use the inverse of the estimated probability to weight all multivariate analysis. We report the average marginal effects for coefficients with standard errors in parentheses below the coefficients in Tables 2 to 3. We performed all statistical analyses using STATA version 11.
Table 2 reports the average marginal effects for the control variables with the dependent variable being access to EHRs. In model 1, Medicaid providers are 4.1 percent more likely (significant at the 5% level) to have EHRs, controlling for age, gender, physician type, practice type, and county identifiers. Younger physicians are more likely to have EHR access. CHC and solo practice physicians are less likely to have an EHR than physicians in group practices.
In model 2, both Medicaid provider coefficients are positive but only the coefficient on whether Medicaid providers were above the median of the distribution of Medicaid patient is statistically significant. The statistical significance on the higher volume Medicaid provider measure indicates that the model 1 results may be driven by unobserved practice size. CHCs, group practices, and hospitals may all vary in size, including the number of practicing physicians. Larger group practices and hospital systems are better able to bear the capital costs of installing EHRs and are more likely to benefit from economies of scale associated with EHR use.
Given the results from model 2, we re-estimate models 1 and 2 restricting our analysis to solo practice physicians only to minimize the possibility of scale bias. The Medicaid provider coefficient increases in magnitude, to 9.2 percent in model 3. The size effect and significance also increase when restricting model 2 to solo practice physicians. In model 4, both low- and high-volume Medicaid providers are more likely to have an EHR than non-Medicaid providers.
The relationships between Medicaid provider status and CEHR and FCEHR are similar. For CEHR, shown in Table 3 panel A, the Medicaid provider coefficients are positive and statistically significant in all four models. Medicaid providers are between 4.3 and 7.7 percent more likely to have a CEHR than non-Medicaid providers.
The FCEHR Medicaid provider coefficients (Table 3 panel B) range in value from 1.2 to 2.3 percent and are not always statistically significant. The lack of significance reflects the very low prevalence of FCEHR access. From Table 1, only 5.7 percent of Medicaid providers and 3.3 percent of non-Medicaid providers have FCEHR access.
Discussion and conclusions
The cooperation between the physician licensing boards in Arizona and the ongoing workforce study at The Center for Health Information and Research (CHIR) provides a rich set of data, which we use to evaluate whether an EHR adoption gap is present in Arizona. Physicians serving AHCCCS (Medicaid) patients are more likely both in a direct and multivariate comparison to have access to EHR. Thus, the low-income patients served by AHCCCS are not disadvantaged with regard to the benefits that may be obtained through the use of EHRs.
Nonresponse bias could influence the estimated level and marginal effects of our analysis in two ways. First, if survey nonrespondents were systematically less likely to utilize EHR, our analysis has over-reported the level of EHR utilization in Arizona. This, however, is not the focus of our analysis. Rather, we focus on the relative EHR utilization differential between Medicaid and non-Medicaid providers. If there was an interaction between Medicaid provider status, EHR utilization, and survey response such that Medicaid providers utilizing EHR were systematically more likely to respond to the survey, it would produce an upwardly biased marginal effect on Medicaid provider status. This potential source of bias is present in any study utilizing survey data. We have attempted to correct for nonresponse bias by estimating the probability that each individual physician in Arizona would respond to the survey by utilizing physician-specific data from administrative records. We used the inverse of that estimated probability in all multivariate analyses to give greater weight to physicians with profiles less likely to respond. DesRoches et al. 1 employ the same nonresponse bias correction. This correction yields unbiased estimates under the identifying assumption that survey response is driven by observable characteristics. The cross-sectional nature of our analysis does not allow us to analyze the role that specific public policies or features of Arizona’s Medicaid system might have played in leading to an adoption gap in favor of Medicaid beneficiaries. One can speculate that one contributing factor to the answer to our primary question is the fact that AHCCCS was an early leader in attempts to increase physician use of EHRs. A large federal grant was used to encourage adoption of EHRs and develop a health information exchange. Although the grant did not achieve all of its ambitious objectives, the efforts to promote EHR use may have influenced the AHCCCS physicians.
The preceding is speculation. What is known from this study is that the results are consistent with those from previous research that show that physicians who treat Medicaid patients are not less likely to adopt EHRs than physicians whose patient population is privately insured. In fact, we find that physicians serving Medicaid beneficiaries are more likely to have adopted EHR. To our knowledge, this is the first study to find a pro-Medicaid gap, suggesting that AHCCCS’s model of promoting the rate of EHR adoption merits further study.
Results from the state of Arizona are not strictly generalizable to other states. The results can be interpreted, however, as one more segment of an expanding panorama of individual state studies that can complement the aggregated results of national surveys. The European approach to health insurance coverage is so different from that of the United States that the most likely value of these results are the insights into a system that, unlike Europe, fails to cover very large numbers of the most vulnerable citizens. It is also true that coverage by Medicaid programs varies widely among states rather than adhering to a single standard. Despite the numerous gaps in coverage, the results suggest, at least, that the current systems do not work to deny lower income patients the benefits to be derived from the use of electronic medical records.
Footnotes
Acknowledgements
The authors are grateful to the Arizona Health Care Cost Containment System Medicaid for the unconditional use of this data in their analysis. The authors gratefully acknowledge the cooperation of Lisa Wynn and the staff of the Arizona Medical Board (AMB), Elaine LeTarte and the staff of the Arizona Board of Osteopathic Examiners (ABOE), and Miwa Edge and Yue Qiu from The Center for Health Information & Research (CHIR). They are also thankful for the helpful comments provided by Dr Anita Murcko (former Medical Director, AHCCCS), Richard Butler, Ben Harris, Gage Love, Barbara Wilson, and Patrick Wightman.
Funding
The data collection phase of this project was sponsored in part by Arizona Health Care Cost Containment System Medicaid Transformation Grant 1U0C30211A.