
Abstract
Background
Autonomy over working times—work time control (WTC)—is a crucial factor determining and structuring not only working hours but also non-work time [1,2]. Low levels of WTC were found to be related to sickness absence [3], sleep disturbances [4] and work–life conflict [5], which can be related to lower levels of recovery as predicted in the effort-recovery model [6].
WTC can be defined as an individual’s autonomy regarding duration and distribution of working time. This definition is adapted from Knauth [7], excluding the location of work (e.g. flexplace, telework). The factorial structure of WTC, reflecting the distinction between duration and distribution of work, has been investigated in only a few studies and results often have to be deduced from the number of factors used in further analyses [8–10]. Past factor analyses have resulted mostly in best model fit for a two-factorial structure, however, items and item allocation to factors have been inconsistent. Moreover, the measurement and analysis of WTC has been found to be diverse in the literature, ranging from single-item and global to multidimensional index scores, sometimes with a specific focus on control over daily working hours, time off and overtime hours [11]. These methodological problems reflect discordances regarding the construct of WTC and have hampered the gathering of evidence on its effects on workers’ health [11].
Previous studies have identified large differences in the extent to which workers can self-determine working times. Women, public-sector and shift workers reported lower levels of WTC in Finnish [9], Japanese [12] and cross-national samples [13]. Results are less consistent for other demographic characteristics such as age, civil and parental status [e.g. 4,5,10]. In any case, comprehensive analyses of the distribution of WTC within subgroups of workers are often about a decade old and representative samples are scarce. Working-time schedules are quickly evolving towards increased flexibility [14] and the need for WTC is high among workers [15]. Since WTC can be related to enhanced recovery, and hence can prevent overload and burnout of workers, it is useful to examine current levels of WTC with respect to demographic and work-related characteristics.
Aim
Prior research has often neglected the sub-dimensions of WTC [11]. The present study investigated the factorial structure underlying a well-established, multi-item measure of WTC. Best model fit was expected for a two-dimensional structure with the factors ‛control over daily hours’ (duration of work) and ‛control over time off’ (distribution of work).
Distribution of WTC within the labour sector has never been assessed in a large, representative sample and results are inconclusive in some areas (e.g. age, family situation). We examined the differences in WTC by demographic and work characteristics in a Swedish, approximately representative sample, focussing on gender, age and family situation, as well as working-time schedules and employment types.
Methods
Study design and population
The study was based on the Swedish Longitudinal Occupational Survey of Health (SLOSH), which is a follow-up of the Swedish Work Environment Surveys (2003–2011). Thus, SLOSH consists of an approximately representative sample of the Swedish working population aged between 16 and 64 years. Respondents were followed up via self-administered, biennial questionnaires (for either working or non-working individuals) since 2006. The current study was based on the survey from 2014 to which 20,316 participants replied (response rate 52%). The valid sample size was n=14,974 (excluding those replying to questionnaires for non-working individuals and 305 respondents with missing data on WTC). Ethical approval for SLOSH and the present study was obtained from the Regional Research Ethics Board in Stockholm.
Measures
Work time control
WTC was measured using an adapted 6-item Swedish scale originally developed by Ala-Mursula et al. [9]. It assesses perceived control over the length of a work day; starting and ending times; which days to work; taking breaks at work; running private errands during work; and scheduling vacation and other leave (the latter item being based on the combination of two items from the original scale). Items were rated on a 5-point Likert scale regarding the level of control from 1 (= very little) to 5 (= very much). In past studies, index scores were either calculated by averaging across all items or within factors. In addition, median splits were performed to differentiate between high or low levels of WTC.
Demographic variables
SLOSH includes information on gender, age at the end of 2014 and educational level (all register-based), as well as civil status (living alone/single/married/cohabiting) and parental status (at least one child/no children living at home; both self-reported). Age clusters were built from 16–30, 31–40, 41–50, 51–60 and 61–76 years.
Work-related factors
Self-reported data was collected regarding: type of employer (private company, association/non-profit organization, government (district/regional/state), farmer, entrepreneur with/without employees); type of work schedule (daytime work, evening work, permanent night work, rotating shift work (with/without nights), rostered work (with/without nights), non-regulated/varying working hours, other); overtime (at least once a week, less than once a week); working contract (full-time, part-time with fixed working time, varying working hours, non-employed/self-employed); length of actual weekly work hours (in steps of 9 hours from less than 10 hours up to 60 hours or more per week); and number of colleagues within workplace (none, 1 to 9, 10 or more). Private employment types were categorized as private sector, governmental employment as public sector and work for associations as voluntary sector. Entrepreneurs and farmers were categorised as self-employed, all others as employed.
Statistical analysis
Exploratory factor analysis (EFA) with promax rotation and the Weighted Least Squares Mean and Variance-Adjusted (WLSMV) estimator for categorical data was performed on a random 90% sub-sample (n=13,725) to assess the factorial structure of the WTC measure. Loadings of at least .3 and cross-loadings lower than .3 were considered satisfactory [16]. The achieved best model fit was tested in a confirmatory factor analysis (CFA) using the remaining 10% sub-sample (n=1554) for cross-validation. Two indices of goodness of fit were used to evaluate model fit: the root mean square error of approximation (RMSEA) is an absolute fit index indicating acceptable model fit with values of less than 0.06 to 0.08 [17]. The comparative fit index (CFI) indicates good incremental fit with values higher than 0.95 [18]. Chi-Square statistics and related p-values were regarded only tentatively as these tend to be influenced by large sample sizes, hence rejecting a model in practically all cases [19].
Independent samples t-tests and one-way ANOVAs (with Tukey post-hoc tests) were performed to assess mean differences (MD) between groups. If homogeneity of variances was violated in the ANOVAs (as assessed by Levene’s test), Welch’s robust test and Games-Howell post-hoc tests were calculated. Pearson correlation was calculated to examine the association of age and WTC. Binomial logistic regressions were calculated to ascertain the effects of demographic and work-related characteristics on the likelihood of experiencing low WTC. Variables were reduced stepwise and best model fit was assessed using Chi-square difference testing and Hosmer and Lemeshow tests of goodness of fit. Confidence intervals (CI, 95%) are reported for means, MD and odds ratios (OR) and were, if necessary, attained by bootstrapping based on 1000 samples.
Factor analyses were run with the Mplus version 7.0 [20]. All other analyses were executed using SPSS 22.0 [21].
Results
Factor analysis
The EFA revealed a better fit for a two-factor model (χ2(4)=755.28; p<0.001; RMSEA=0.12) than a one-factor model (χ2(9)=3101.83; p<0.001; RMSEA=0.16). However, model fit indices were non-satisfactory for either model. One item (control over which days to work) showed low loadings and cross-loaded on both latent variables. This item was excluded in further analyses. Repetition of the EFA yielded best model fit for a two-factor model (χ2(1)=1.92; p=.17; RMSEA=0.01), which explained 43% of the variance. The first factor, ‘control over daily hours’, contained two items (length of working day, starting and ending times); the second one, ‘control over time off’, three items (vacation and other leave, running private errands, taking breaks). The two-factorial structure was tested in a CFA. Variance for control over daily hours was fixed to 1 as this latent variable was measured by only two items for which item loadings were freed. The two-factor model showed better model fit (χ2(4)=29.51; p<0.001; RMSEA=0.06; 95% CI 0.04 to 0.09; CFI=0.99) than the one-factor model (χ2(5)=1200.37; p<0.001; RMSEA=0.39, 95% CI 0.37 to 0.41; CFI=0.96). High internal consistency was found with Cronbach’s alpha at 0.88 for the five WTC items, 0.93 for the subscale of control over daily hours and 0.77 for control over time off. The final two-factor model is presented in Figure 1.
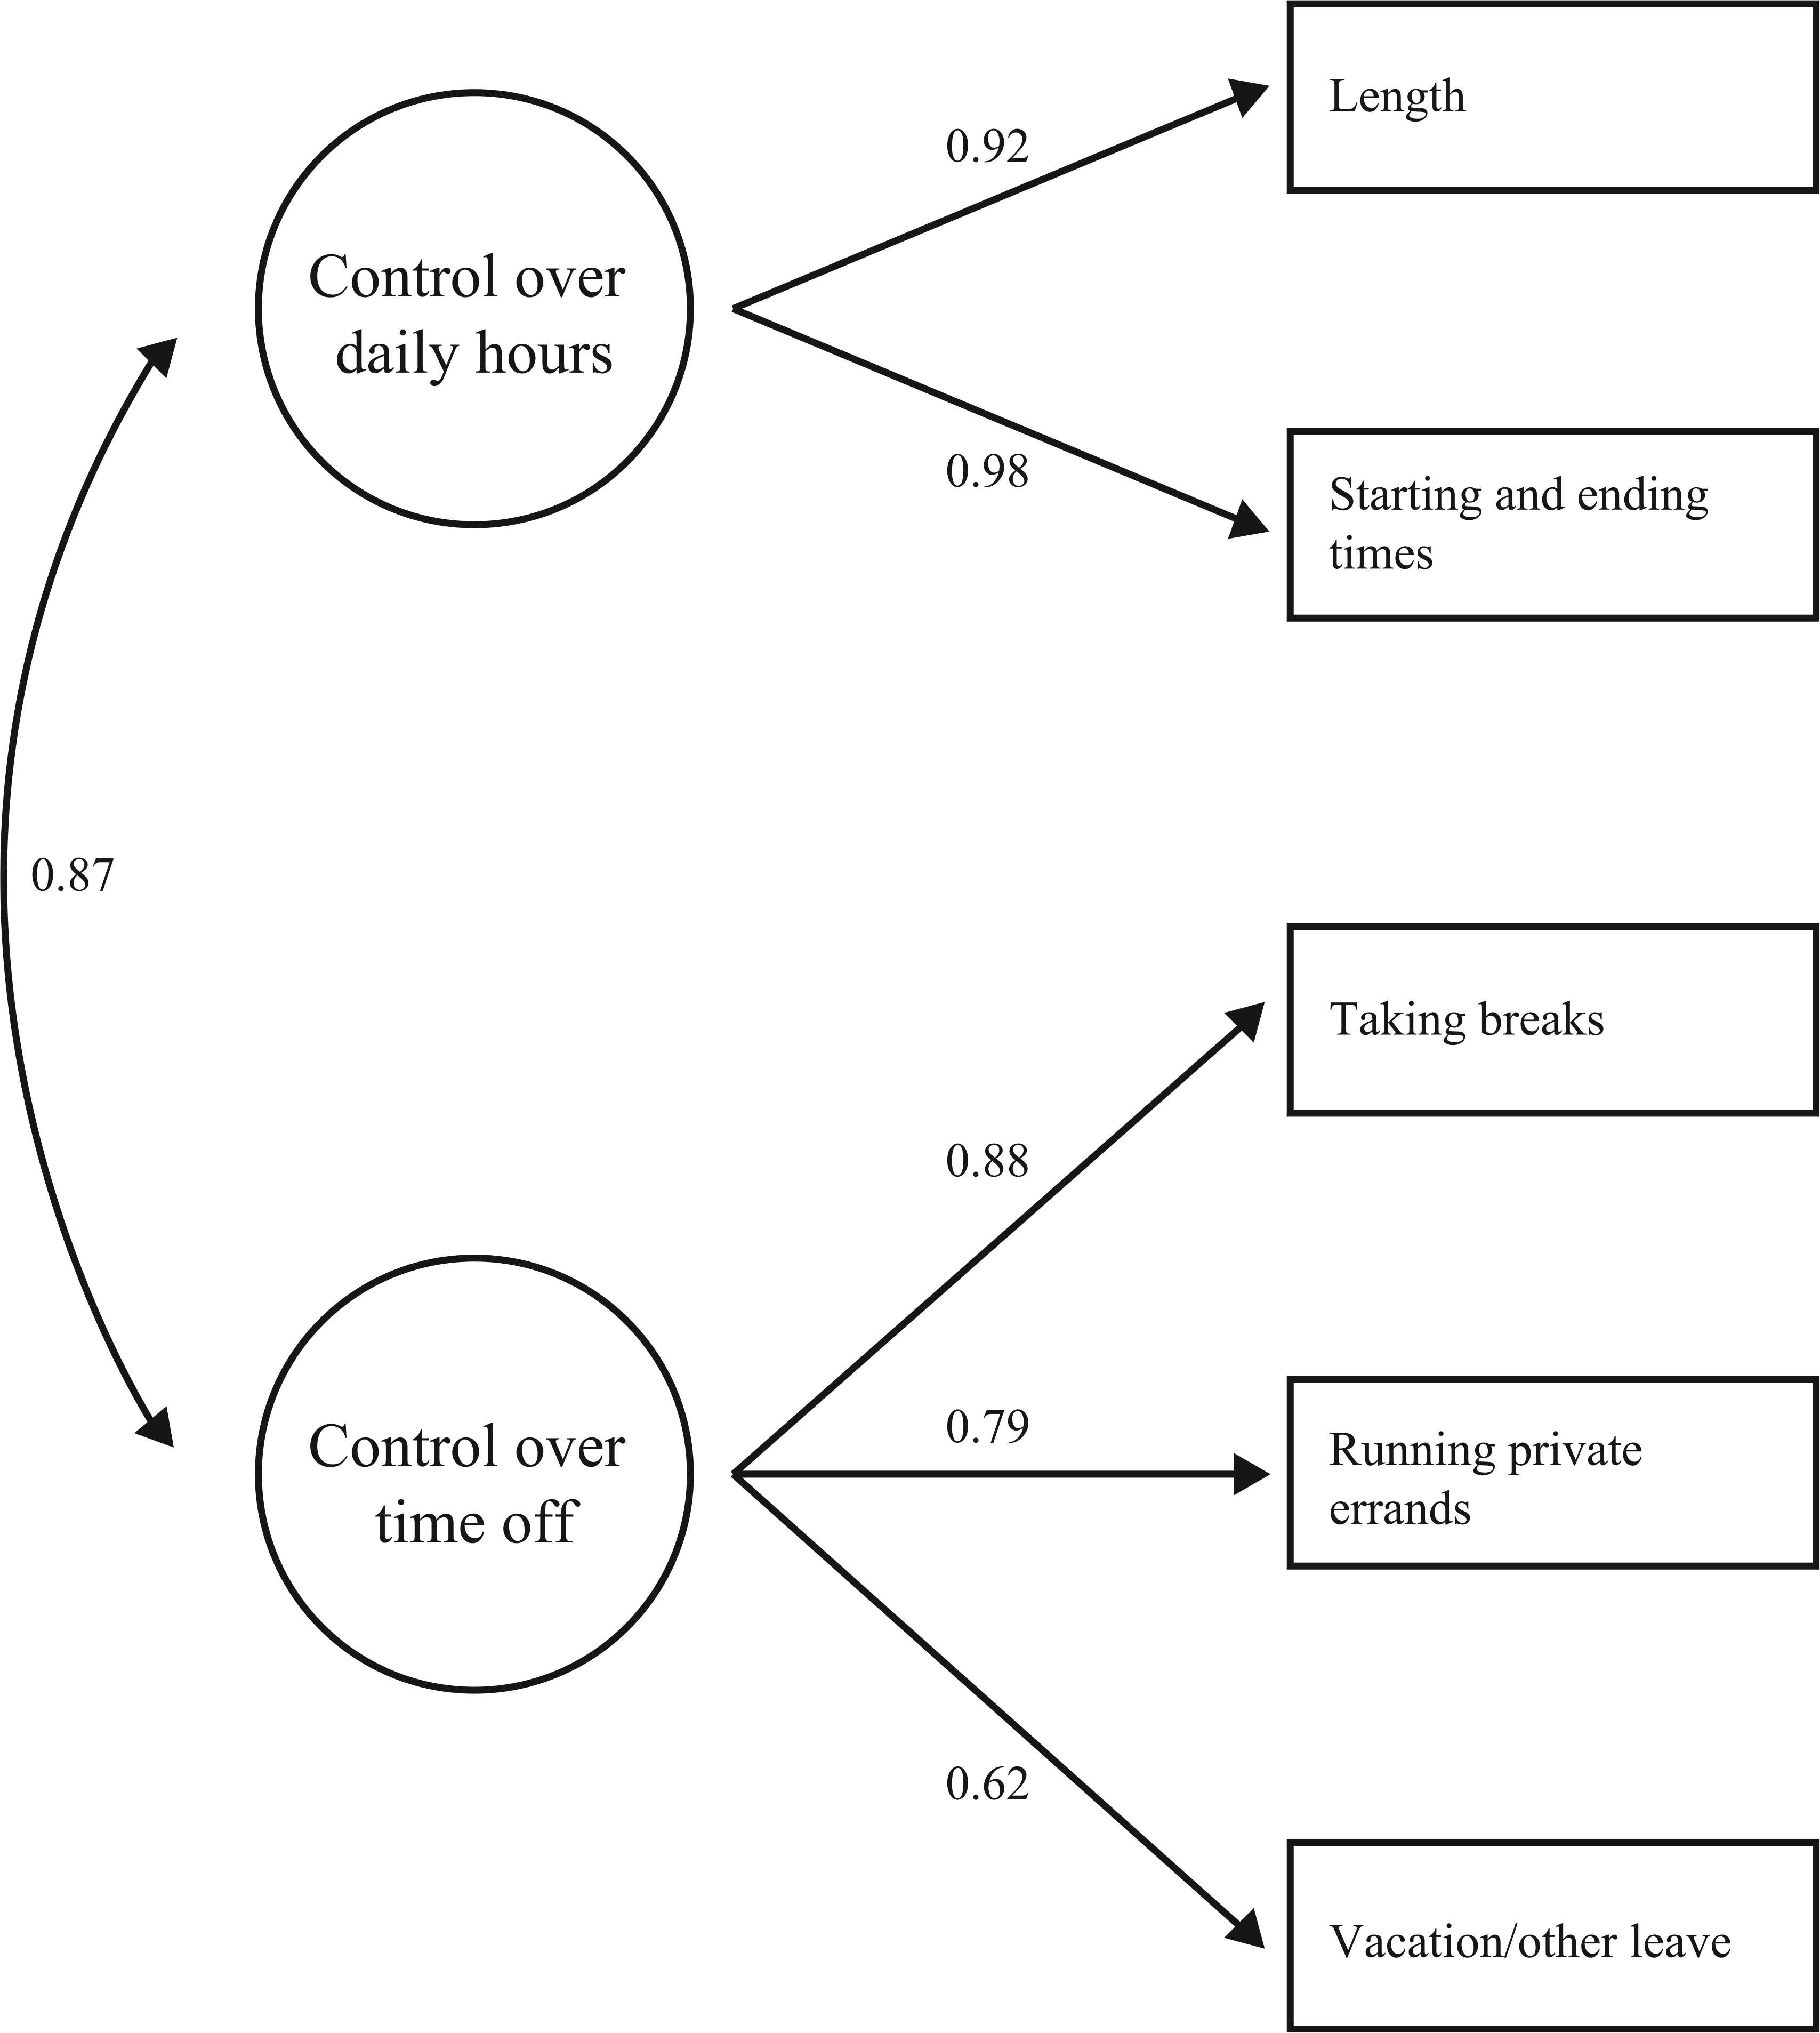
Factor loadings/correlation in the two-factor model of WTC with the latent variables control over daily hours and control over time off.
Group differences
Control over daily hours
Overall, a mean score of 2.88 (SD=1.38, median=3.00, min=1.00, max=5.00) was found for control over daily hours. Table I displays the results regarding demographic and work-related factors.
Differences in levels of control over daily hours between women and men by demographic and work-related characteristics.
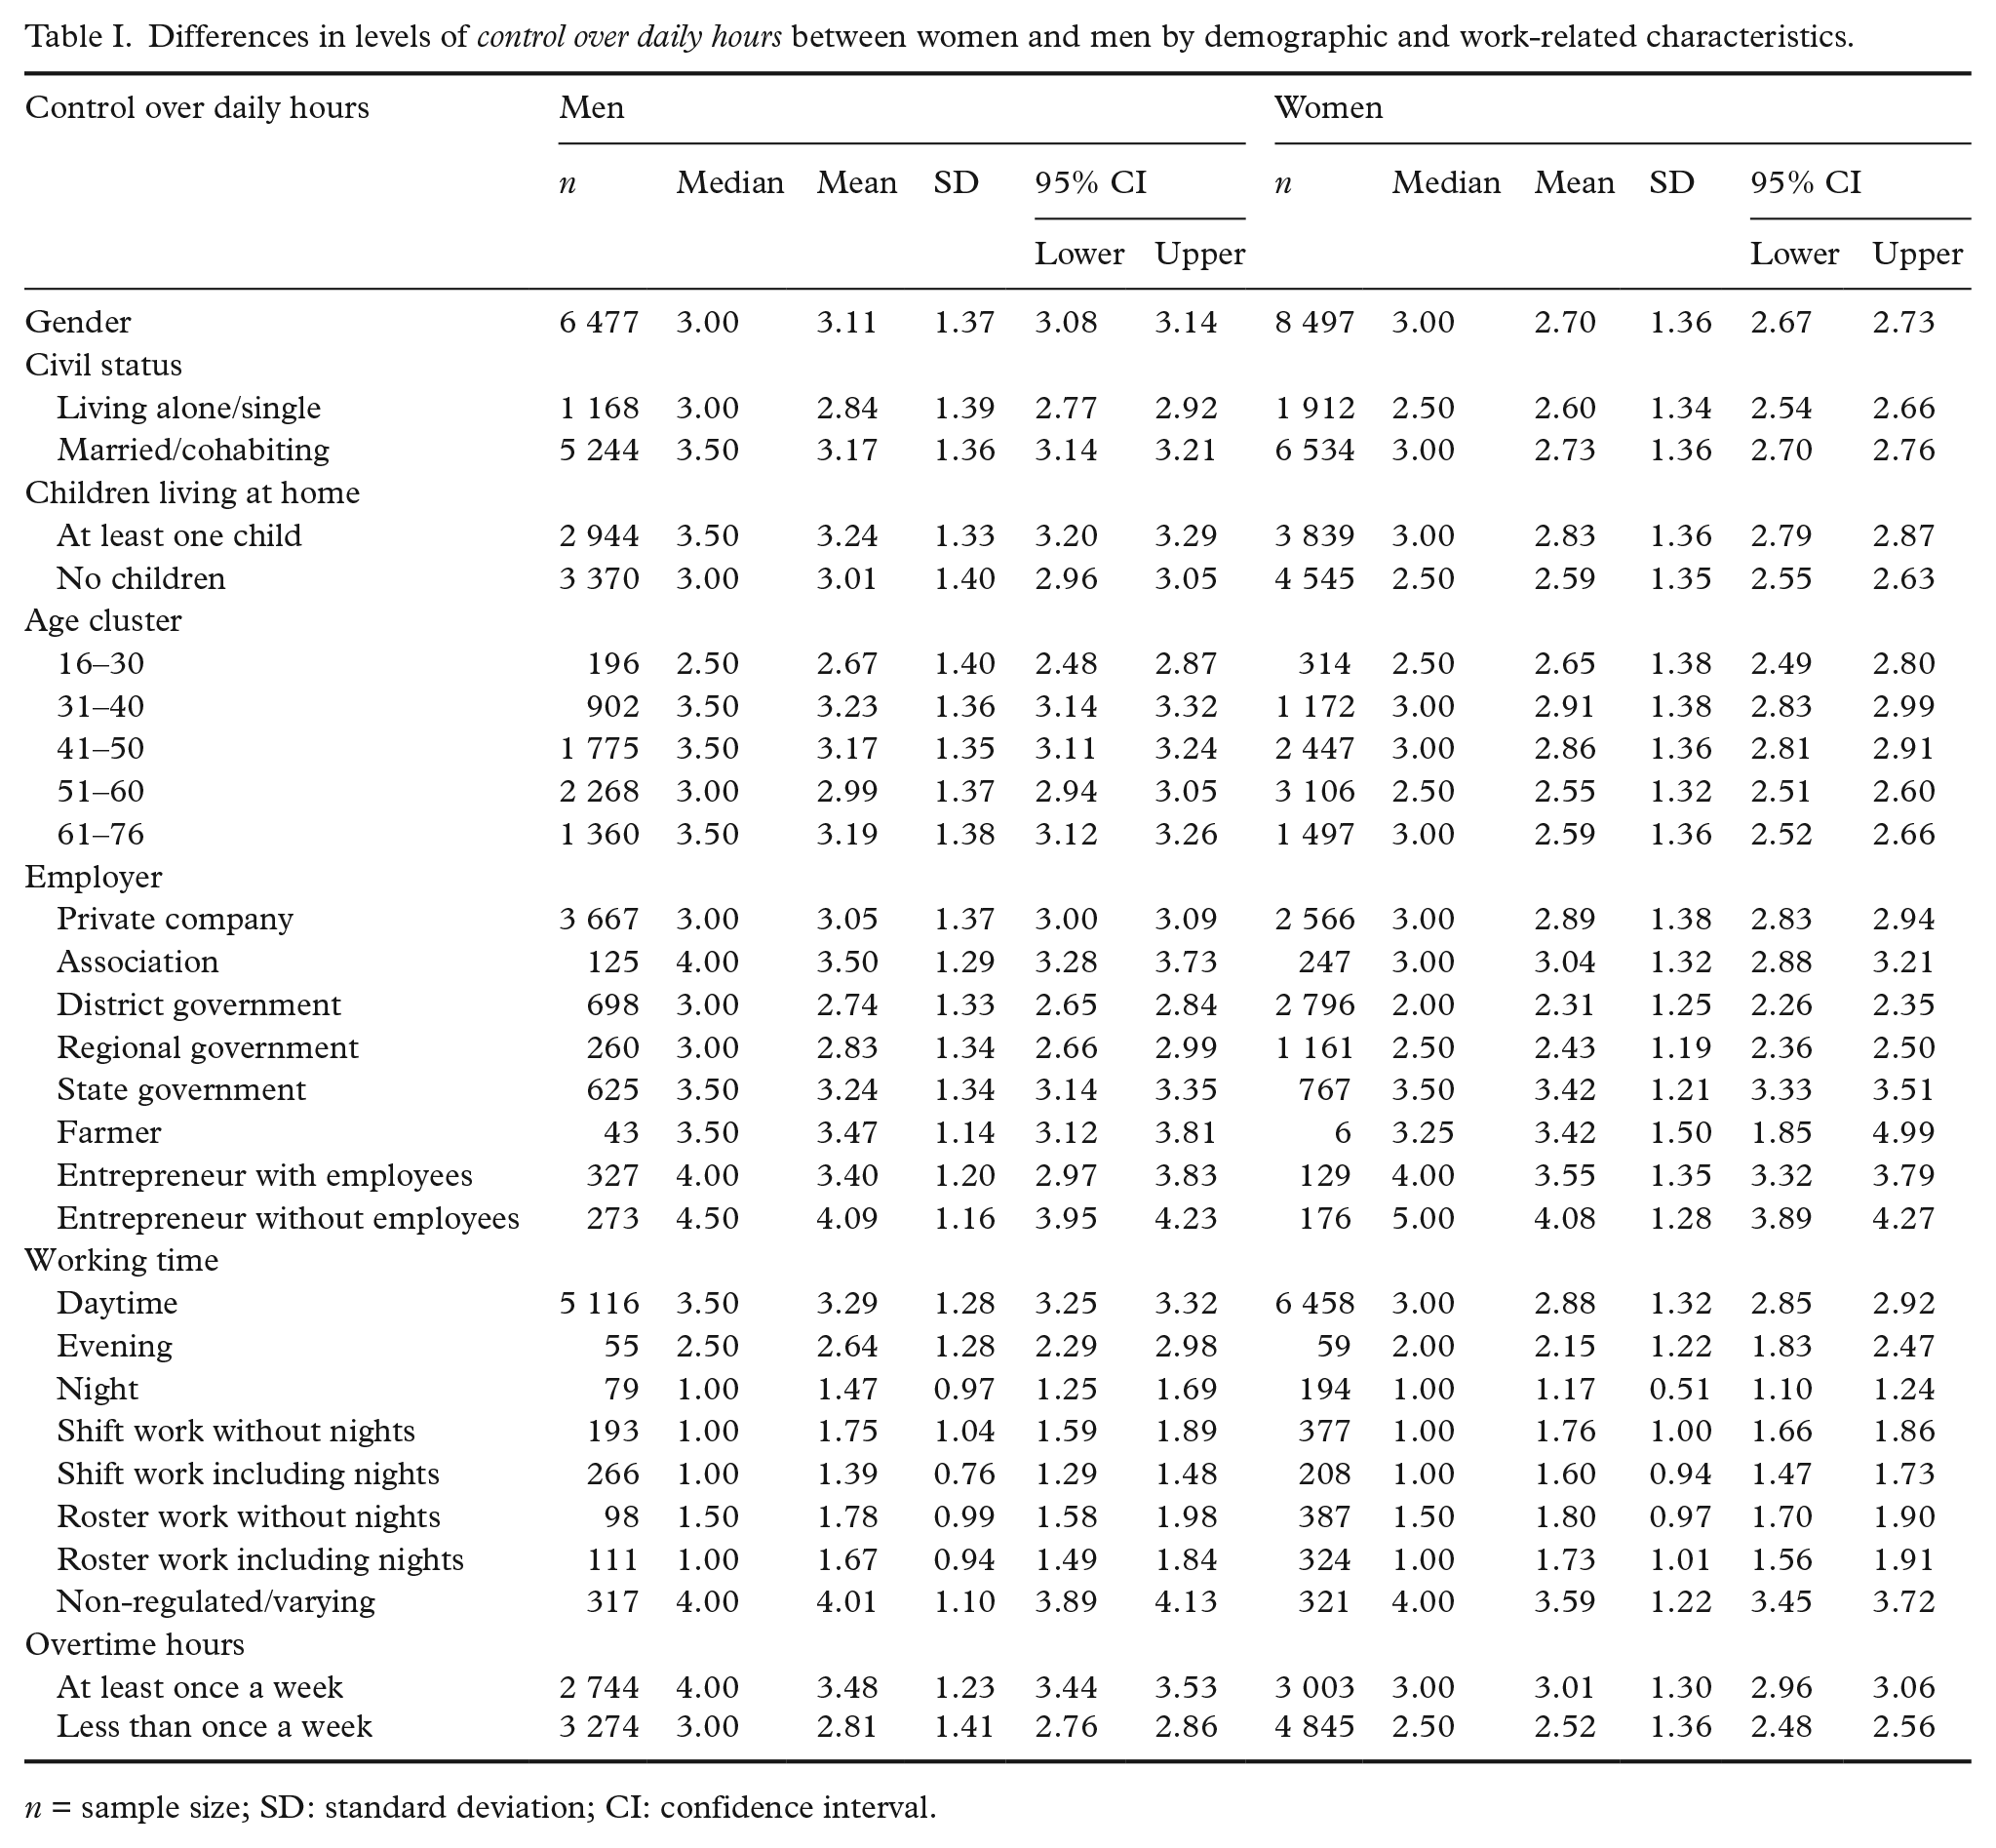
n = sample size; SD: standard deviation; CI: confidence interval.
Men reported higher control over daily hours than women (MD=0.41, CI 0.36 to 0.45). Those who were single/living alone reported lower levels of control than married/cohabiting individuals (MD=−0.24, CI −0.29 to −0.18). This difference was larger for men. Parents with at least one child living at home reported higher levels of control than individuals without children (MD=0.24, CI 0.20 to 0.29). Age showed significant though very low correlations with control over daily hours (r=−.04, CI –.06 to −.02). Pairwise comparisons revealed that the age groups 31–40 and 41–50 reported the highest levels of control.
Private sector workers reported significantly higher control compared to those in the public sector (MD=0.48, CI 0.43 to 0.54). The MD between private and public sector was generally larger among women. Self-employed workers reported higher levels of control than employed individuals (MD=0.52, CI 0.45 to 0.59). This difference was larger among women. Results by employer type are displayed in more detail in Table I.
Daytime work significantly differed from all other types of work schedule with respect to control over daily hours, with higher levels of control compared to shift, roster, evening and permanent night work, and lower levels compared to non-regulated working hours. The largest MDs were found comparing daytime work to permanent night work (MD=1.81, CI 0.30 to 1.06), rotating shift work including nights (MD=1.59, CI 1.46 to 1.71) and rostered working hours including nights (MD=1.36, CI 1.16 to 1.56). Individuals working overtime hours at least once a week reported higher levels of control over daily hours than those working overtime less than once a week (MD=0.59, CI 0.55 to 0.63). These differences were larger for men than for women. Results regarding differences in control over daily hours by educational level, working contract, actual working hours and workplace size are presented in supplements available online.
Control over time off
Overall, a mean score of 3.18 (SD=1.06, median=3.33, min=1.00, max=5.00) was found for ‘control over time off’ ratings. Table II displays the results for demographic and work characteristics.
Differences in levels of control over time off between women and men by demographic and work-related characteristics.
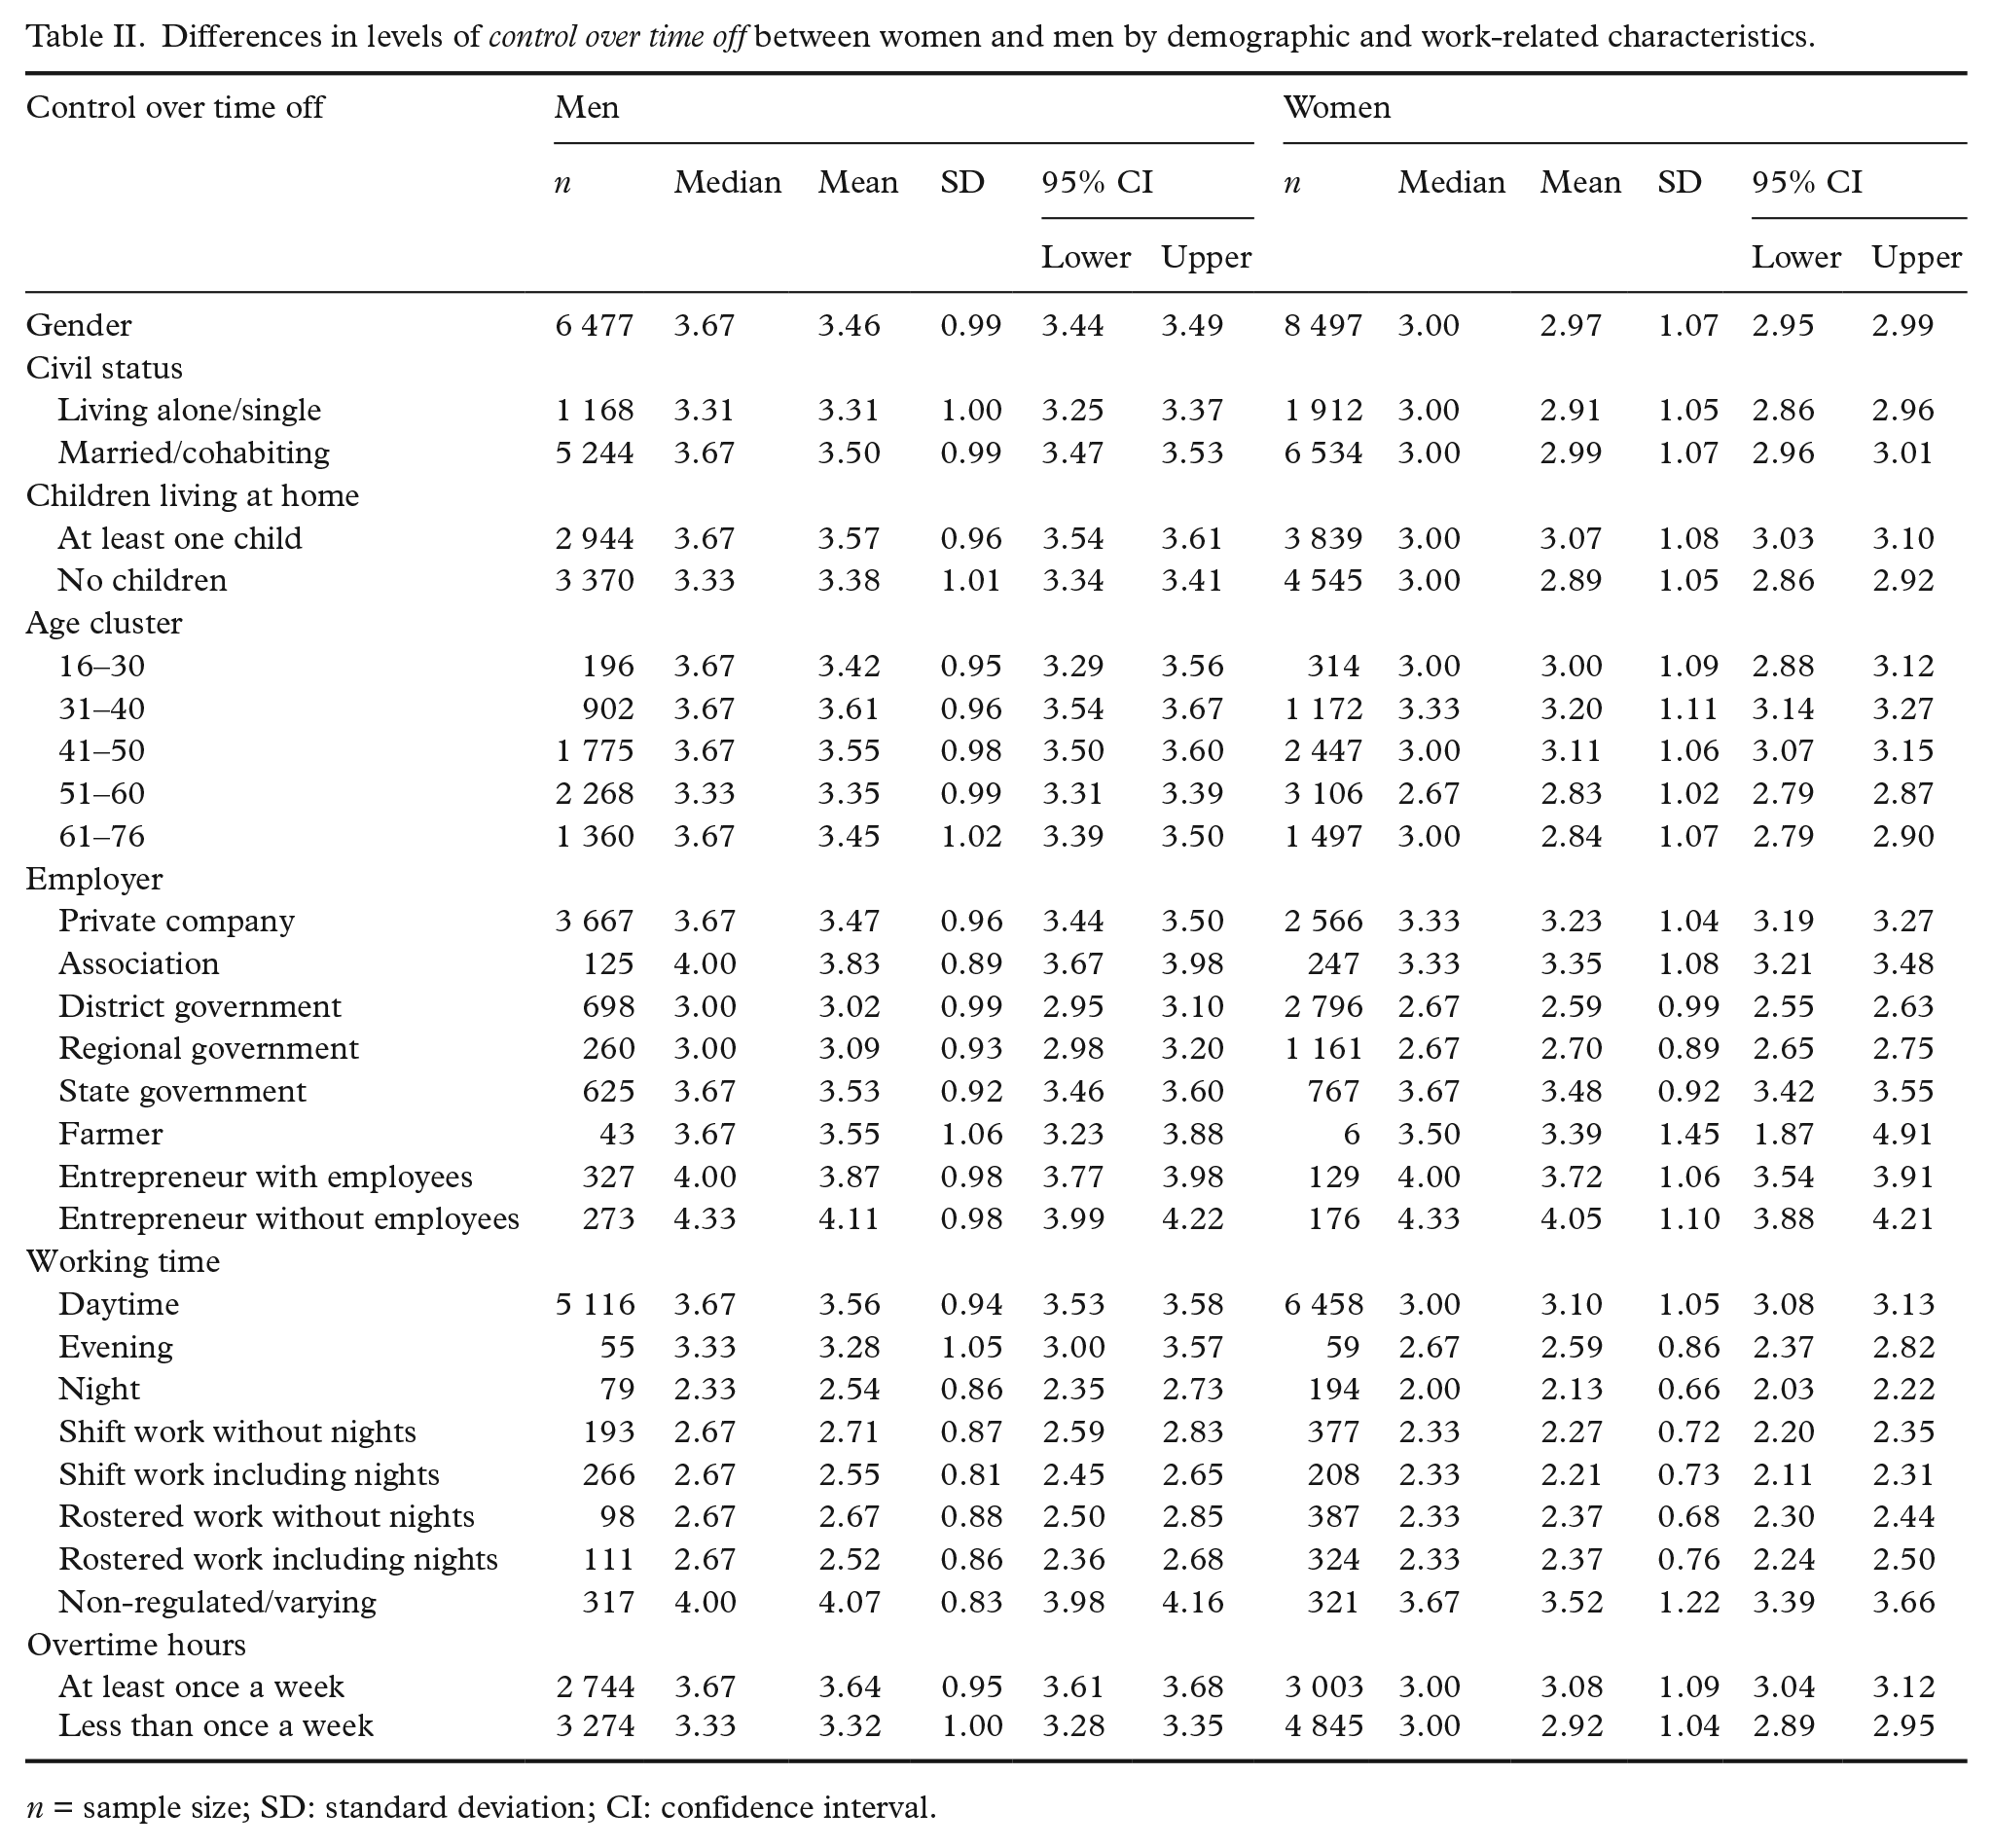
n = sample size; SD: standard deviation; CI: confidence interval.
Men reported higher control over time off than women (MD=0.49, CI 0.46 to 0.52). Individuals who were single/living alone reported lower levels of control than those being married/co-habiting (MD=−0.16, CI −0.20 to −0.11). This difference was larger for men. Parents with at least one child living at home reported higher levels of control than individuals without children (MD=0.19, CI 0.16 to 0.23). Age showed very low correlations with control over time off (r=−.09, CI –.10 to −.07). Again, the age groups from 31–40 and 41–50 reported the highest levels of control.
Private-sector workers reported higher control over time off compared to those in the public sector (MD=0.58, CI 0.54 to 0.62). Self-employed respondents perceived higher levels of control than employed ones (MD=0.36, CI 0.31 to 0.41). This effect was only significant among women (MD=0.57, CI 0.51 to 0.64).
Regarding type of work schedules, differences in control over time off were smaller than in control over daily hours. Compared to daytime work, MDs were 1.06 for permanent night work (CI 0.91 to 1.20), 0.90 for rotating shift work including nights (CI 0.79 to 1.02) and 0.87 for rostered working hours including nights (CI 0.70 to 1.03). Individuals working overtime at least once a week reported higher levels of control over time off than those working overtime less than once a week (MD=0.27, CI 0.23 to 0.30). Again, the results regarding educational level, working contract, actual working hours and size of workplace are presented in online supplements.
Regression analysis
Results from gender-stratified binomial logistic regressions for control over daily hours and control over time off are displayed in Tables III and IV. Best model fit for control over daily hours was found when including the variables ‘type of work schedule’, ‘employer’, ‘overtime work’, ‛civil status’ and ‛number of children living at home’. The model was statistically significant for men, χ2(18)=1144.66, p<.001 and women, χ2(18)=1345.16, p<.001. It explained 23% of the variance in men and 22% in women (Nagelkerke’s R2). The same variables resulted in best-fitting model for control over time off for men, χ2(18)=847.68, p<.001 (18% of variance explained) and women, χ2(18)=1463.37, p<.001 (23%). For both genders, the most influential factors on reporting low control over daily hours, as well as time off, were permanent night work, roster and rotating shift work (with or without nights). Civil status was a significant factor for reporting low control over time off in men only.
Gender-stratified binary logistic regression model assessing predictors of reporting low control over daily hours.
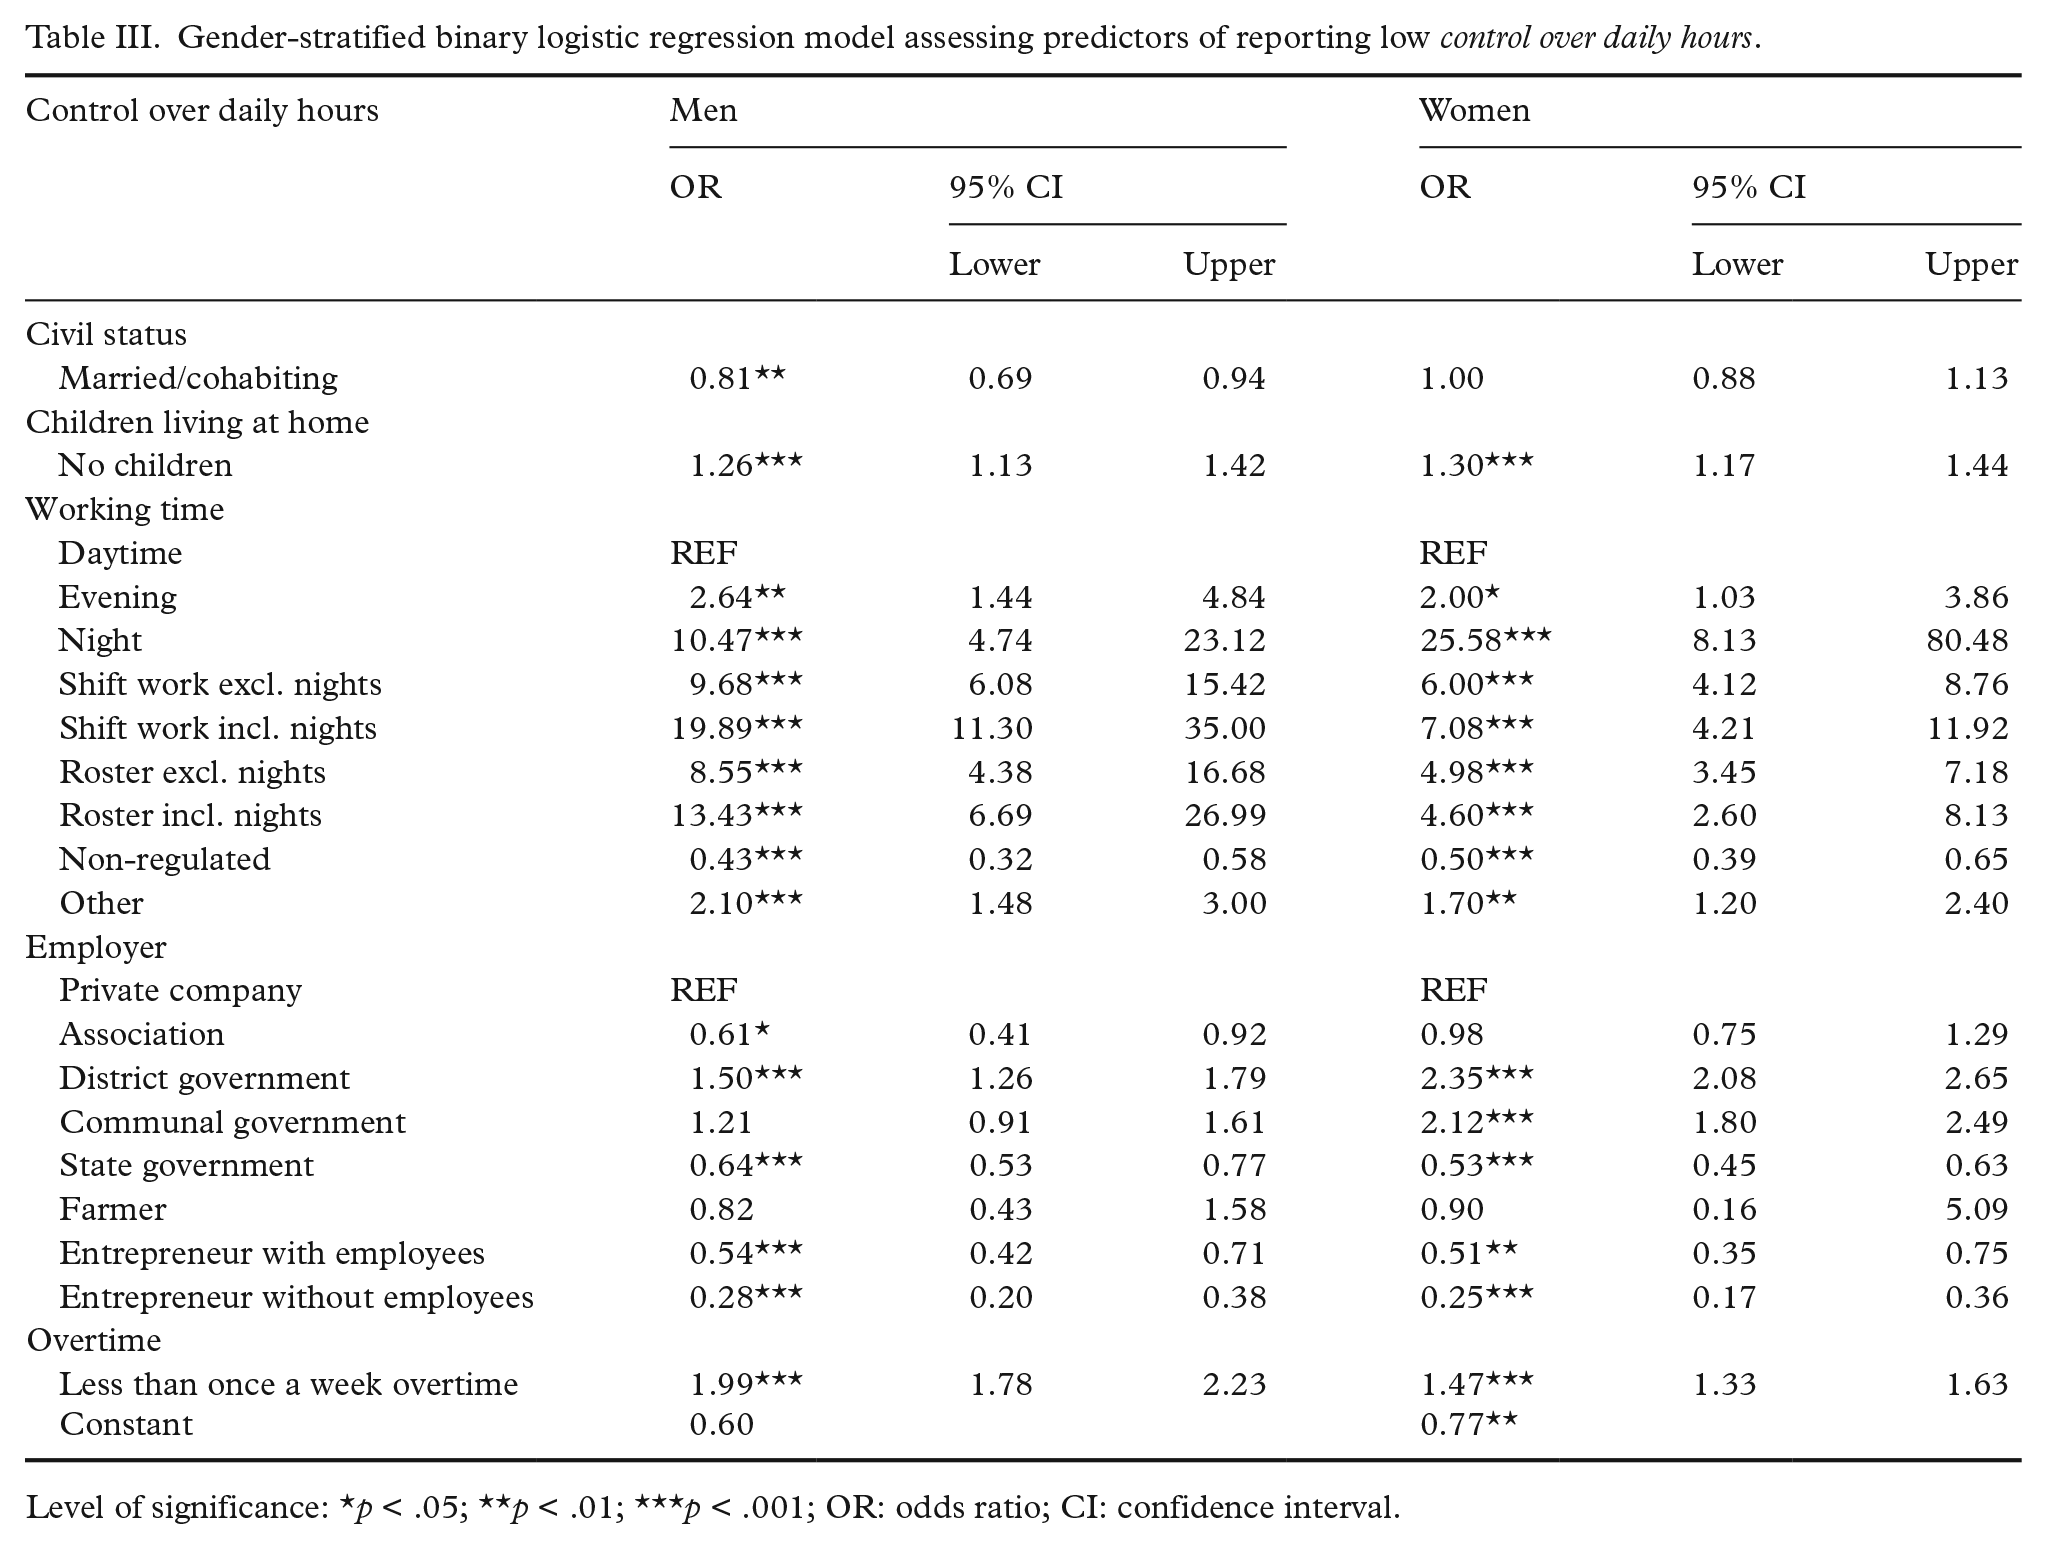
Level of significance: *p < .05; **p < .01; ***p < .001; OR: odds ratio; CI: confidence interval.
Gender-stratified binary logistic regression model assessing predictors of reporting low control over time off.
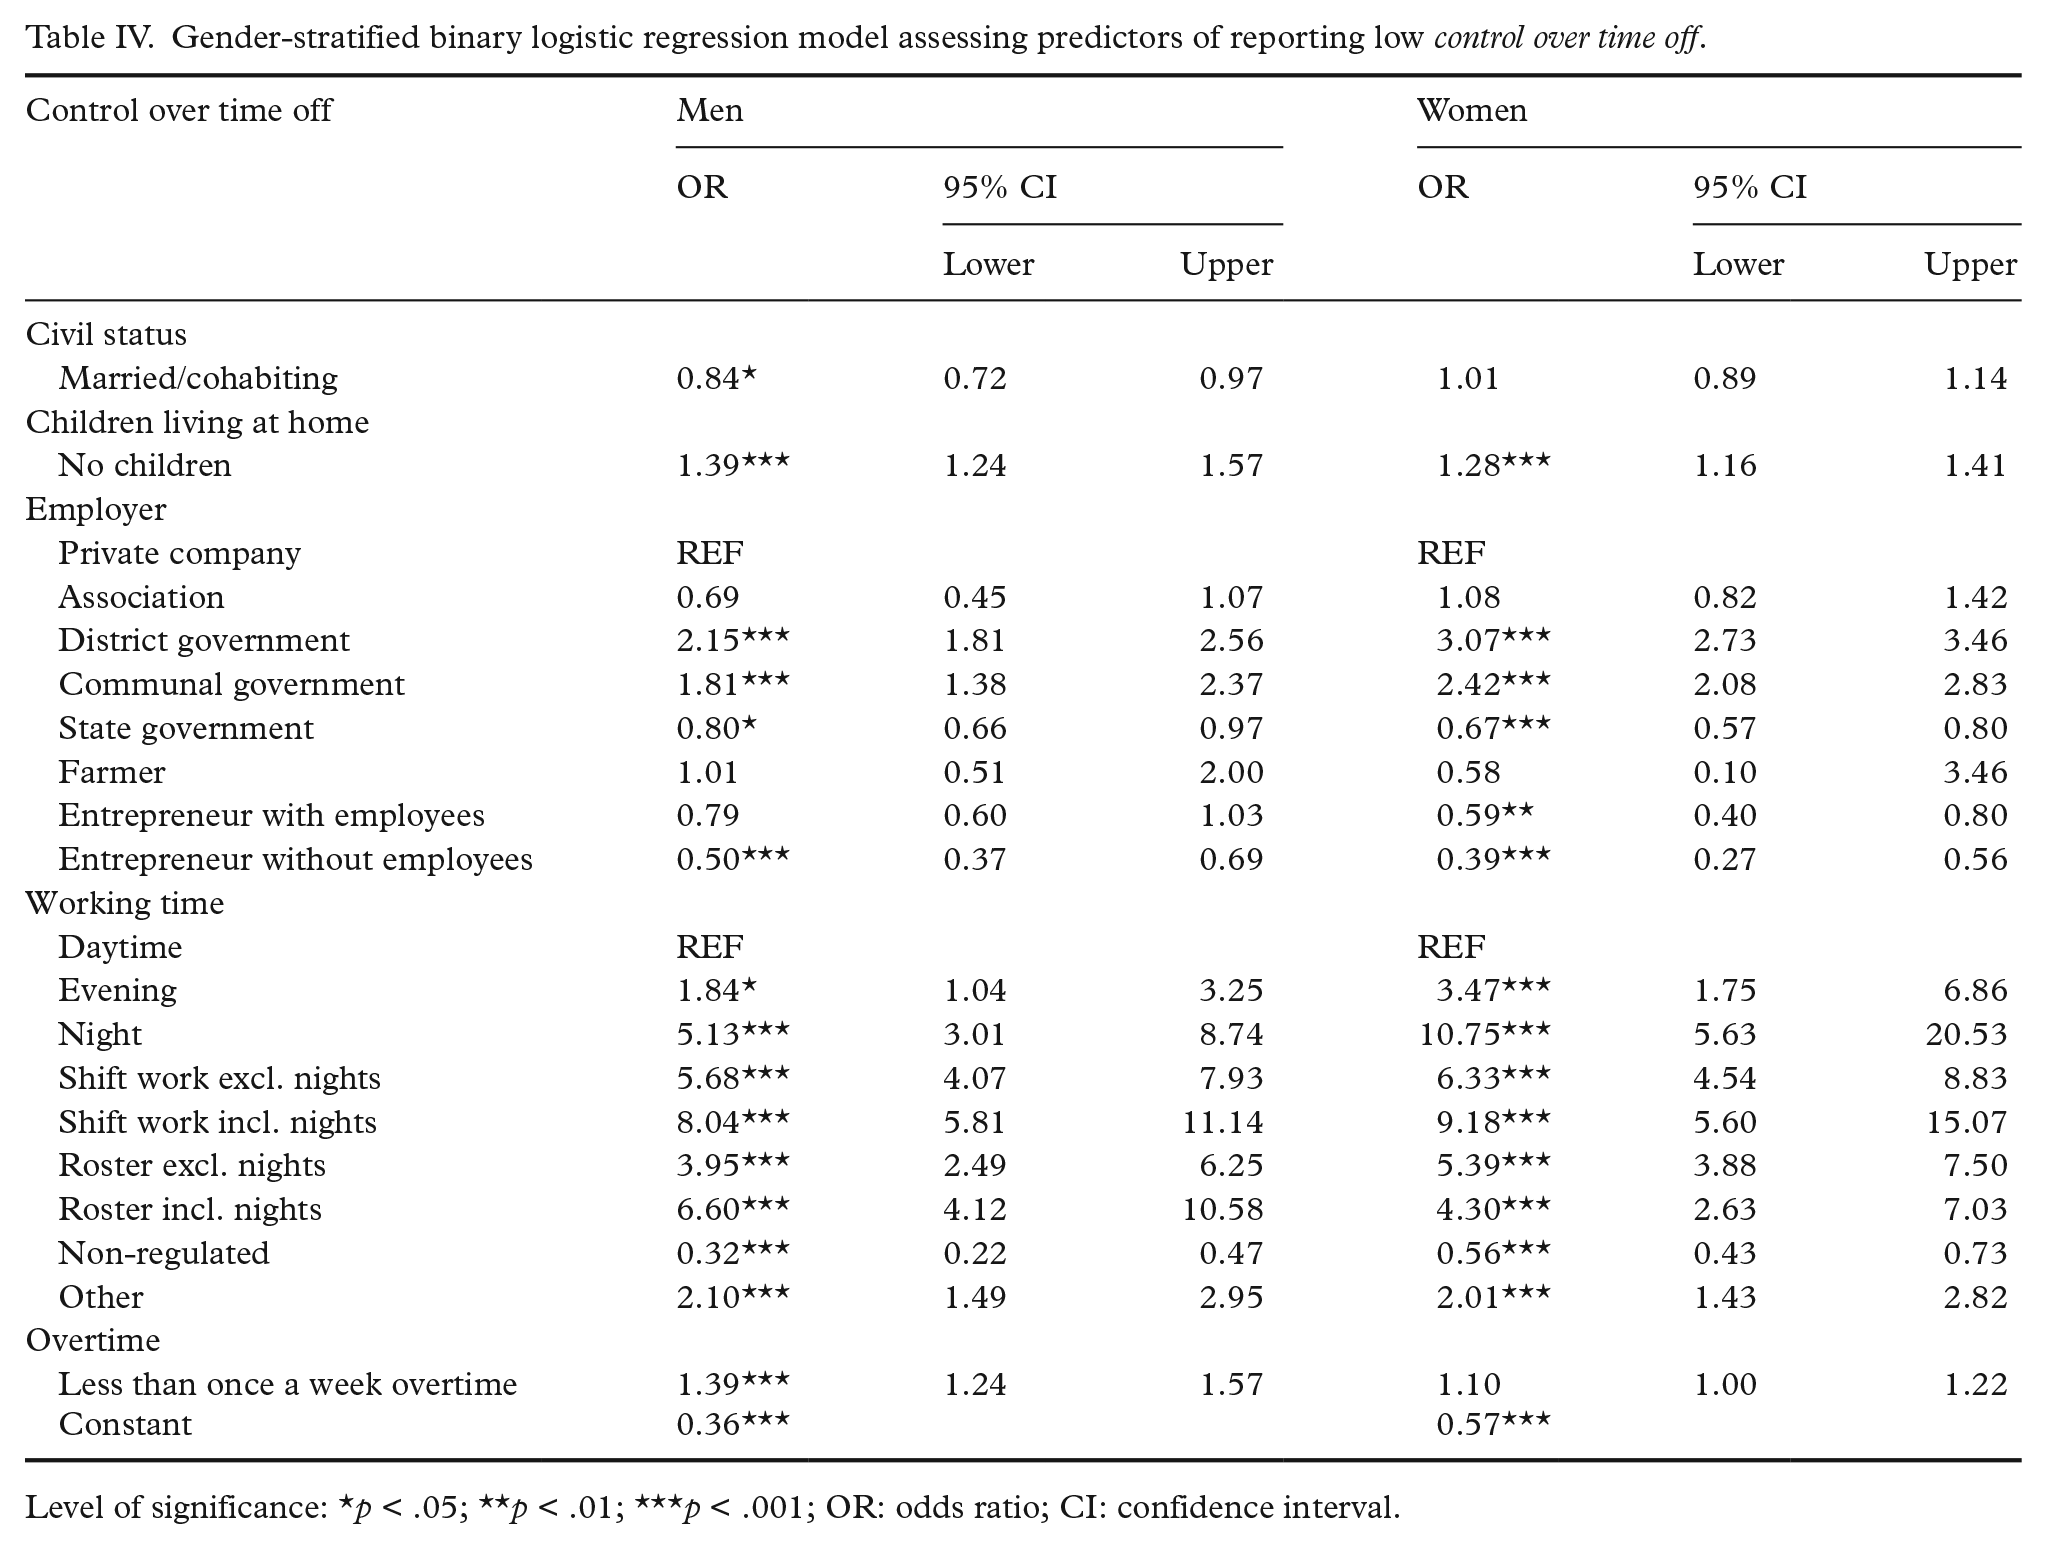
Level of significance: *p < .05; **p < .01; ***p < .001; OR: odds ratio; CI: confidence interval.
Discussion
The present study aimed at confirming a two-factorial structure underlying the measure of WTC as well as describing availability and group differences in levels of WTC within the Swedish working sector. With regard to the factorial structure of WTC, we found best fit for a two-dimensional model with the factors ‘control over daily hours’ (duration, starting and ending times of work) and ‘control over time off’ (taking breaks, vacation, other leave and running private errands during work). The distribution of both factors by work and demographic characteristics was similar, but respondents reported higher levels of control over time off. We found that lower levels of control over daily hours and time off were reported by women, individuals who were single/living alone or without children, shift workers, public-sector workers, those in employment (in contrast to self-employment) and those working less overtime. Differences between age-groups were negligibly small. The most influential factors on reporting low levels of control over daily hours and time off were shift, roster and permanent night work, for both women and men.
Our confirmation of the two-factorial structure corresponds to both existing definitions of WTC and previous factor analyses [7,9,22]. Having control over time off does not necessarily mean having control over daily hours, although both factors correlate strongly. The example of shift workers clearly illustrates that, while control over taking vacation might be available, self-determination of start and ending times of shifts is often difficult if not impossible, depending on the nature of the work. Within some occupations, the employer’s need to ensure continuity of work substantially restricts opportunities for control over daily hours [23,24]. While previous studies have measured and analysed WTC in various ways, the present study adds compelling evidence to existing literature [e.g. 9] to differentiate two factors within the concept of WTC.
One of the main findings was gender inequality in the distribution of both factors of WTC. This trend has seemingly persisted over time as well as national borders [9,13]. Future research should consider whether gender differences in WTC underlie other gender effects in outcomes that are associated with WTC (e.g. work–life balance, job-related outcomes) [11].
Although we did not find strong evidence for differences in WTC by age, our results show small but consistent associations of family situation with levels of control. Being childless was associated with low control. Civil status was a significant predictor of WTC among men only, with married or cohabiting men being less likely to report low WTC.
Compared to other variables, shift, roster and night work were the strongest predictors of reporting low WTC. In Sweden, shift work is strongly associated with working within the public health sector [25]. This could explain why public-sector workers were also more likely to report low control. Other studies found similar results regarding the association between shift work and WTC [9,12,15]. The present study gives a more detailed picture with even lower levels of WTC being reported when shifts included nights. Shift workers’ lack of WTC may account for some of the negative effects on health and well-being associated with non-standard working hours. In particular, the fit between private and work life could suffer at lower levels of WTC [26]. Family life has repeatedly been found to be negatively influenced by varying, short-notice schedules [27]. A study by Kubo et al. [28] found that highly variable working times combined with high levels of WTC resulted in less negative effects on work–life balance than variable working times with low control. WTC could be one essential measure to buffer negative effects on health and well-being caused by unfavourable schedules.
WTC should, however, not exclusively be viewed as a positive working condition. While higher control can be beneficial for managing time challenges in and outside working life, it is possible that high control over daily hours itself becomes a strain as it removes fixed structures of working times. In our sample, we found respondents working overtime hours at least once a week reporting higher control over daily hours than those working less overtime. This could be due to overtime hours being more common among highly educated workers. Too much flexibility, especially regarding control over daily hours, could play a critical role in blurring boundaries between work and private life. Differential effects on health comparing voluntary and involuntary overtime hours need to be assessed in that regard. A study by Hofäcker and König [5] found that while women used control over daily hours to decrease work–family conflict, men more often used it to increase commitment (including working more hours) and hence, exacerbated work–life imbalance. Investigating the threshold of when flexibility becomes overwhelming can have significant implications for recommendations on ‛ideal’ levels of WTC and healthy working conditions.
Limitations
Due to the cross-sectional nature of our design, no causal inferences can be made from the distribution of WTC. However, the focus of the present paper was not on assessing causality but rather on confirming the two-factorial structure of WTC within a representative sample using robust statistical procedures, as well as describing differences in levels of WTC.
Since self-reported data were used, known issues with these kind of data apply to our study. Likewise, representativeness is only given to a certain degree despite the satisfying response rate. As our measure of WTC was ordinal, we validated our findings by comparing results from parametric and nonparametric tests. Differences between results were non-existent or minor at most. Full panel data were used to reduce bias due to missing data. Some group differences in WTC could be the result of self-selection. For instance, self-employed individuals may choose this form of employment specifically for reasons of higher autonomy.
Conclusion
Our findings argue for analysing WTC in terms of two, distinguishable factors: ‘control over daily hours’ and ‘control over time off’. Future research should avoid assessing WTC with a single-item or index score. The two factors may have differential effects on outcomes such as health and work–life interference [5,10]. In our study, women, shift and public-sector workers reported lower control over daily hours and time off. Public health implications should be examined in future research, in particular if increased levels of either factor of WTC can ameliorate health problems associated with unfavourable working schedules.
Footnotes
Acknowledgements
We would like to thank the Swedish Longitudinal Occupational Survey of Health participants.
Declaration of Conflicting Interests
The author(s) declared no potential conflicts of interest with respect to the research, authorship, and/or publication of this article.
Funding
The author(s) disclosed receipt of the following financial support for the research, authorship, and/or publication of this article: This work was supported by the Swedish Research Council for Health, Working Life and Welfare (grant number 2013-0448), the Swedish Research Council (grant number 825-2013-1645) and NordForsk, the Nordic Programme on Health and Welfare.
References
Supplementary Material
Please find the following supplemental material available below.
For Open Access articles published under a Creative Commons License, all supplemental material carries the same license as the article it is associated with.
For non-Open Access articles published, all supplemental material carries a non-exclusive license, and permission requests for re-use of supplemental material or any part of supplemental material shall be sent directly to the copyright owner as specified in the copyright notice associated with the article.