
Abstract
The research regarding high entropy alloys (HEAs) has proved them to be suitable for engineering applications. Nevertheless, assessing their processability is key for industrial deployment. Of special relevance in terms of processing techniques arised welding. In this work, Gas Tungsten Arc Welding (GTAW) was chosen as a processing method to attest for the suitability of the equiatomic CoCrFeMnNi HEA for one of the most common real-world mechanical solicitations, tensile loading. We delve into an in-situ synchrotron X-ray diffraction analysis of the mechanical behavior of a high-performing GTAW CoCrFeMnNi HEA joint. Local analysis of the microstructure evolution, considering the base material, heat affected zone and fusion zone, was performed by tracking changes in the diffracted intensity and lattice strain. Orientation-dependent evolution is highlighted by considering partial azimuthal integration detailing texture impact across the joint. Evidence of strain concentration at specific locations is correlated with the microstructure and overall macroscopic mechanical behavior.
The equiatomic CoCrFeMnNi high entropy alloy (HEA) was first presented in 2004 by Cantor et al. 1 This material has attracted significant attention since the inception of HEAs, whose concept is based on composition, microstructure and mechanical behavior customization for case-specific purposes, typically surpassing conventional engineering alloys.2–4
The CoCrFeMnNi HEA is known to yield a single-phase face centered cubic (FCC) solid solution that has been thoroughly studied to unveil its behavior in a wide array of corrosion environments5,6 and temperature regimes.7–9 Nevertheless, research on its processability is imperative to guarantee their implementation in key engineering applications.
For such, welding has been widely used to address the increasing interest in exploring the processability phenomena arising from the high temperature/pressure required to achieve strong and permanent joints in similar and dissimilar combinations.10–19 Among these studies, gas tungsten arc welding (GTAW) of the CoCrFeMnNi high entropy alloy on the as-rolled condition was performed by Oliveira et al. 12 and stands as the basis of the present paper. There, the excellent weldability of the CoCrFeMnNi system was highlighted by means of advanced microstructure and mechanical characterization. This allowed to observe the transition from the base material (BM) to the fusion zone (FZ), as well as the solid-state mechanisms occurring in the heat affected zone (HAZ). Additionally, the mechanical performance of the joints was assessed by tensile testing (reaching ≈519 MPa at a ≈8.4% of strain) and microhardness mapping, showcasing a decreasing hardness transition from the BM to the FZ. Of special notice is the use of synchrotron X-ray diffraction (SXRD) to complement the electron microscopy analysis, evidencing that the actual extension of the HAZ is larger than that determined by microscopy techniques. This was related to the different microstructural features captured by each characterization technique, highlighting the potential for their combined use.
With this in mind, we propose to infer on the (in-situ) mechanical performance of such welded joint using high-energy SXRD. Such allows for a time-resolved understanding of the microstructural changes occurring at each region of the weld, during tensile loading, enabling to correlate those variations with the experienced thermal cycle. Our results yield the detailed role of local microstructure on the strain partitioning and deformation behavior, on both qualitative and quantitative analysis concerning diffraction data taken during mechanical loading.
The experimental procedure is depicted in Figure 1 and can be comprehended as follows. With prior knowledge of the stress-strain behavior of the joints (detailed in, 12 the in-situ tensile test (performed at the P07 beamline in DESY) was paused at specific strain stages until eventual fracture of the weld occurred. At each stage, a series of consecutive scans were conducted along the full extension of the joint, where the material, located at 1.396 m from the detector, was exposed to an energy X-ray beam of 87.1 KeV, corresponding to a wavelength of 0.14235 Å. A beam spot size of 0.25 × 0.25 mm was utilized, and each analyzed spot was located at a distance of 0.25 mm from the previous one. This setup allowed to work in transmission mode permitting to acquire bulk information at each scanned region in the form of the Debye–Scherrer rings (see Figure 1(b))). The obtained raw-data was analyzed using a combination of PyFAI 20 and python-based scripts to retrieve the diffraction peak specific reaction to the externally applied load. The analysis was conducted via full azimuthal integration and by the integration in 10° segments oriented in the loading (LD) and transverse (TD) directions (see Figure 1(b)) for the schematic representation).
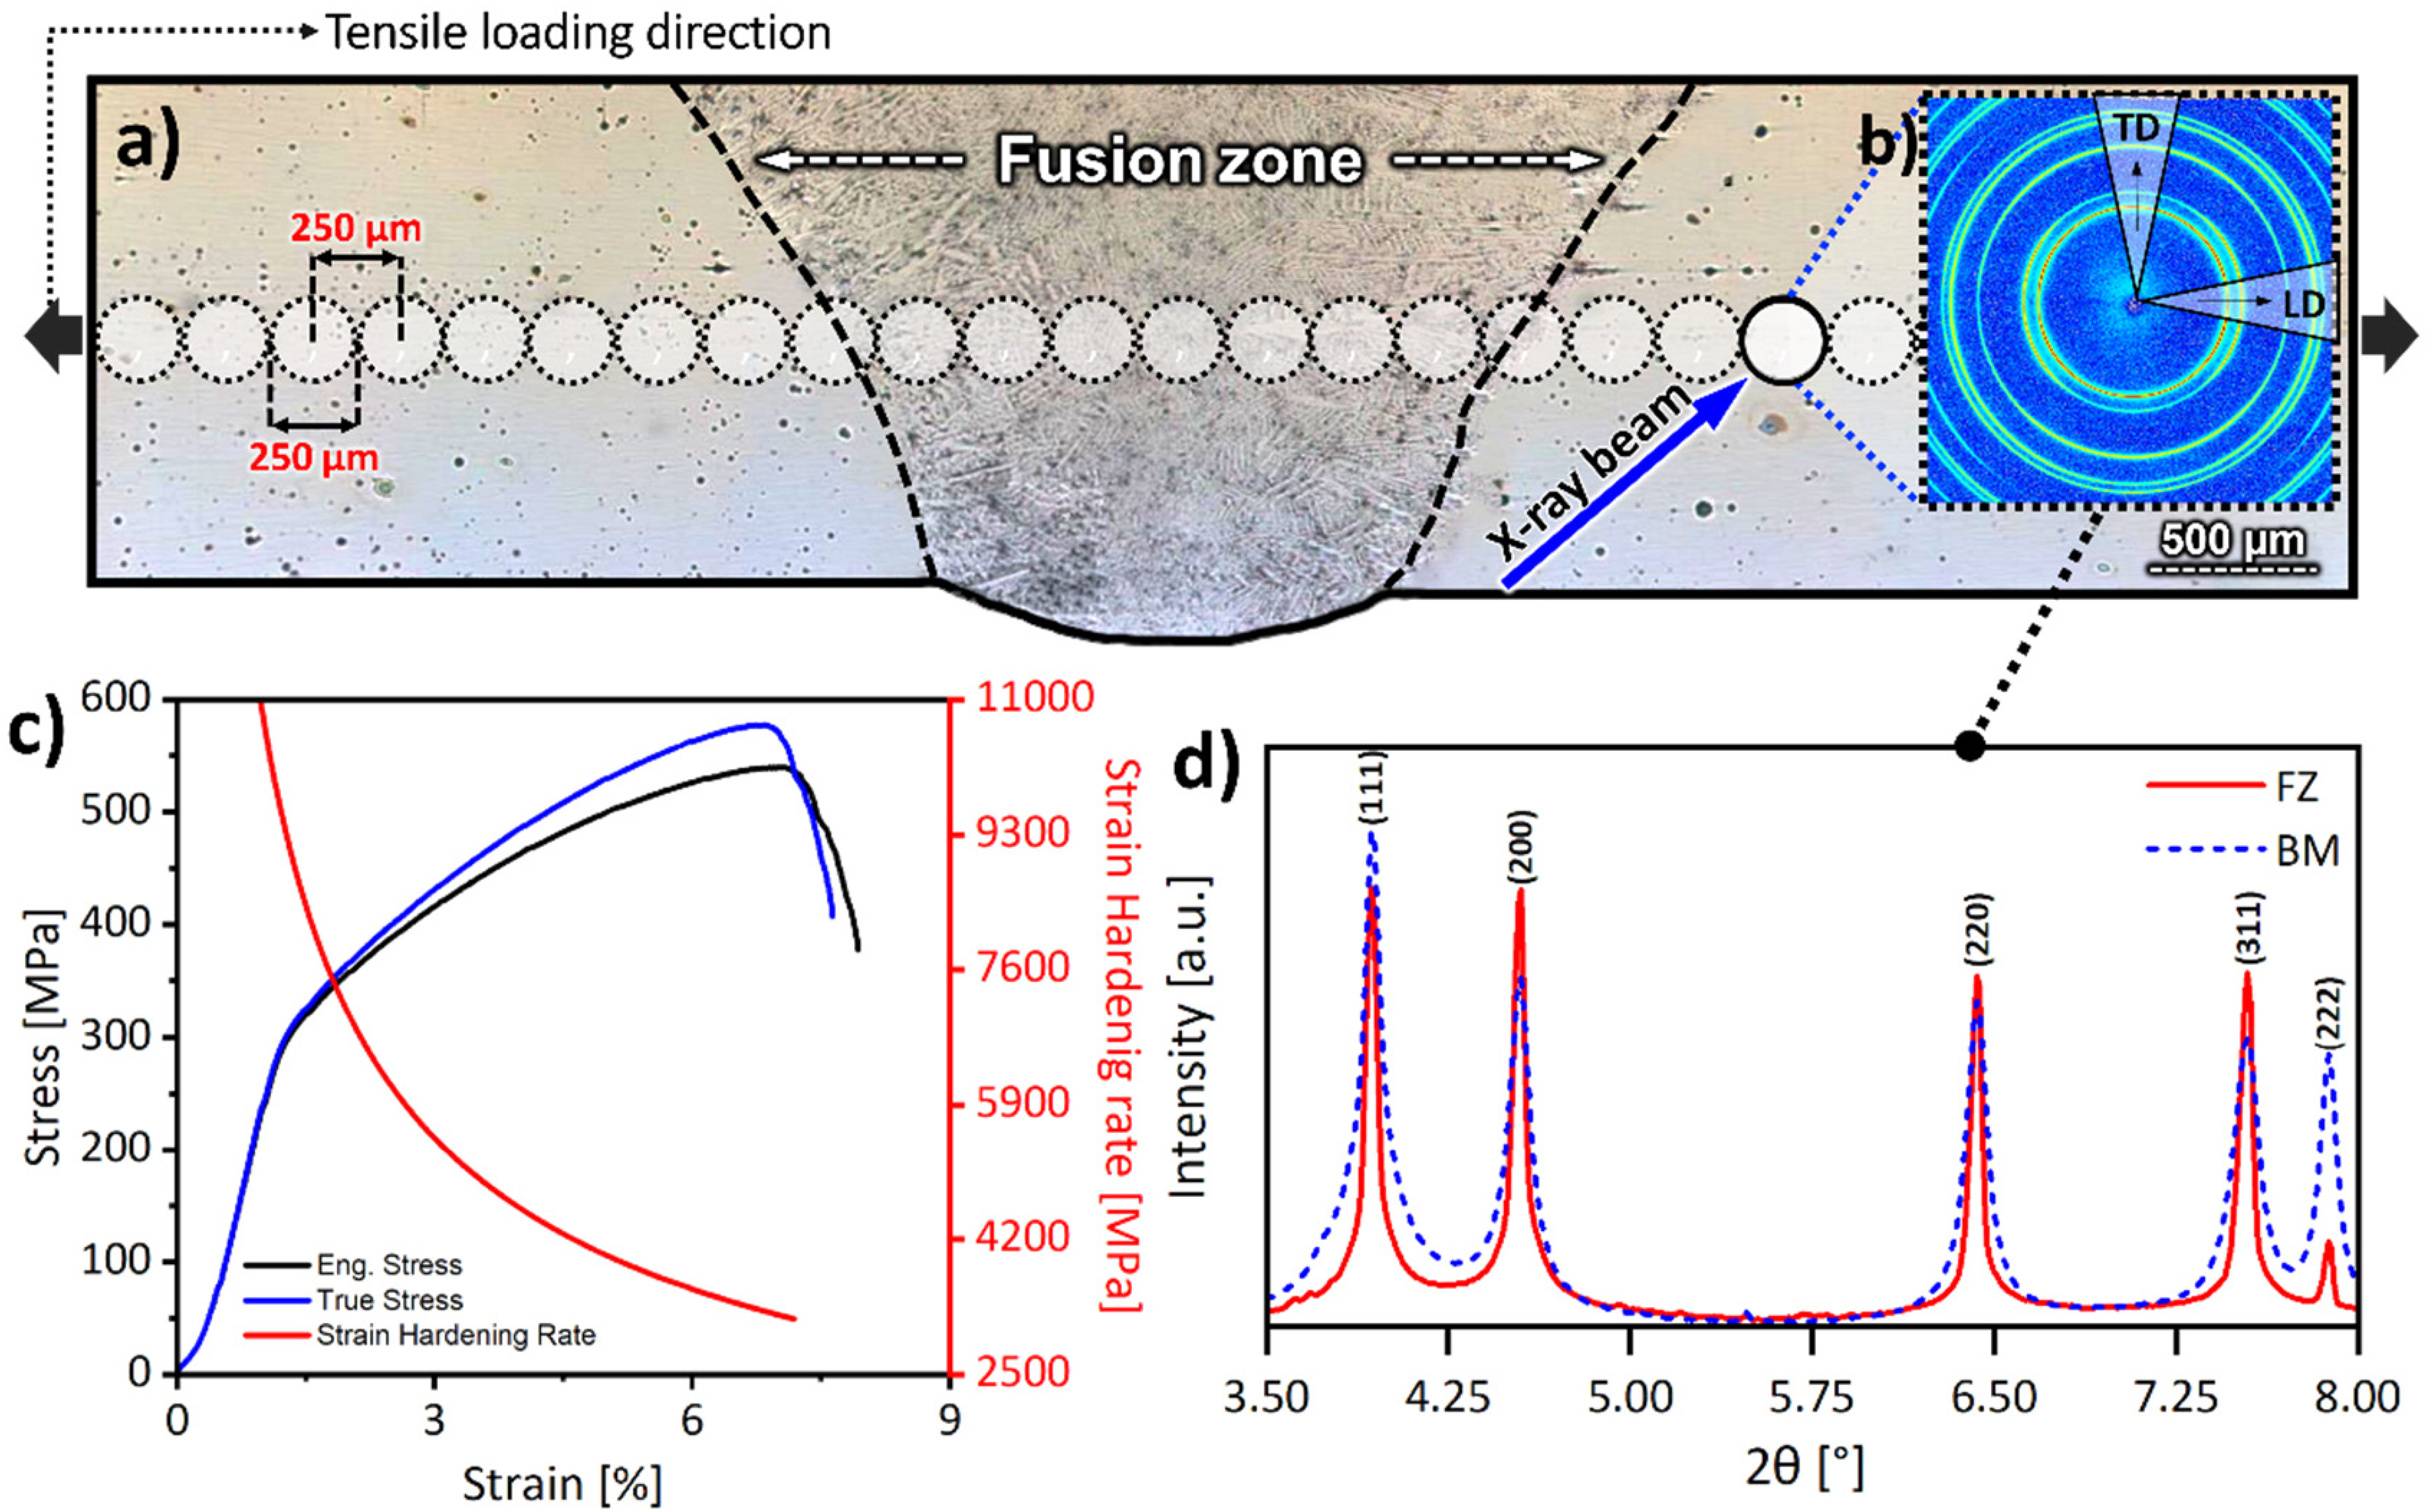
Depiction of the experimental procedure and conditions: (a) Optical micrograph of the welded joint complementing a graphical explanation of the SXRD in-situ tensile test; (b) Debye–Scherrer rings captured by the 2D detector during one scan of the welded joint; (c) mechanical performance of the welded joint under tensile stress; (d) Representative diffraction patterns of the BM and FZ prior to loading.
In Figure 1(a)) we can observe a representative optical micrograph of the welded joint utilized in the in-situ tensile test. The mechanical results obtained during the test are depicted in Figure 1(c)). There, the engineering and true stress-strain curves are exhibited alongside the strain hardening rate. Overall, an ultimate tensile strength (UTS) of 541 MPa was achieved, with eventual fracture occurring at 7.93% of strain (all engineering values). Accordingly, the strain hardening rate tends to decrease with increasing levels of stress. This is to be expected, provided that with more deformation, the hardening capacity of the joint is reduced, directly affecting the rate at which hardening caused by increasing strain occurs.
Concerning the diffraction data, in Figure 1(d)) it is possible to observe a rough comparison between the resulting diffraction patterns obtained for the BM and FZ prior to load applied to the joint. There, the diffraction reflections of the FCC phase characteristic of the CoCrFeMnNi alloy, obeying Bragg's law, are visible. As expected, throughout the weld this phase is dominant, although the presence of Cr-Mn oxides can also be observed to occur in the material. 12 However, these particles are not considered in this study due to their low intensity (and relatively low phase fraction). Rather, we turn our focus to the FCC phase diffraction peaks and their evolution.
Figure 2(a)) introduces the region-specific behavioral changes with increasing stress through the evaluation of the normalized integrated intensity of the (3 1 1) peak variation (chosen due to its intrinsic insensitivity to intergranular strains. 21 There it is possible to observe the increasing lengths of both the FZ and HAZ during the tensile test, which are also graphically represented in Figure 2(b)), as the progression of the tensile test causes the cross section of the weld to increase in the LD and decrease in TD.
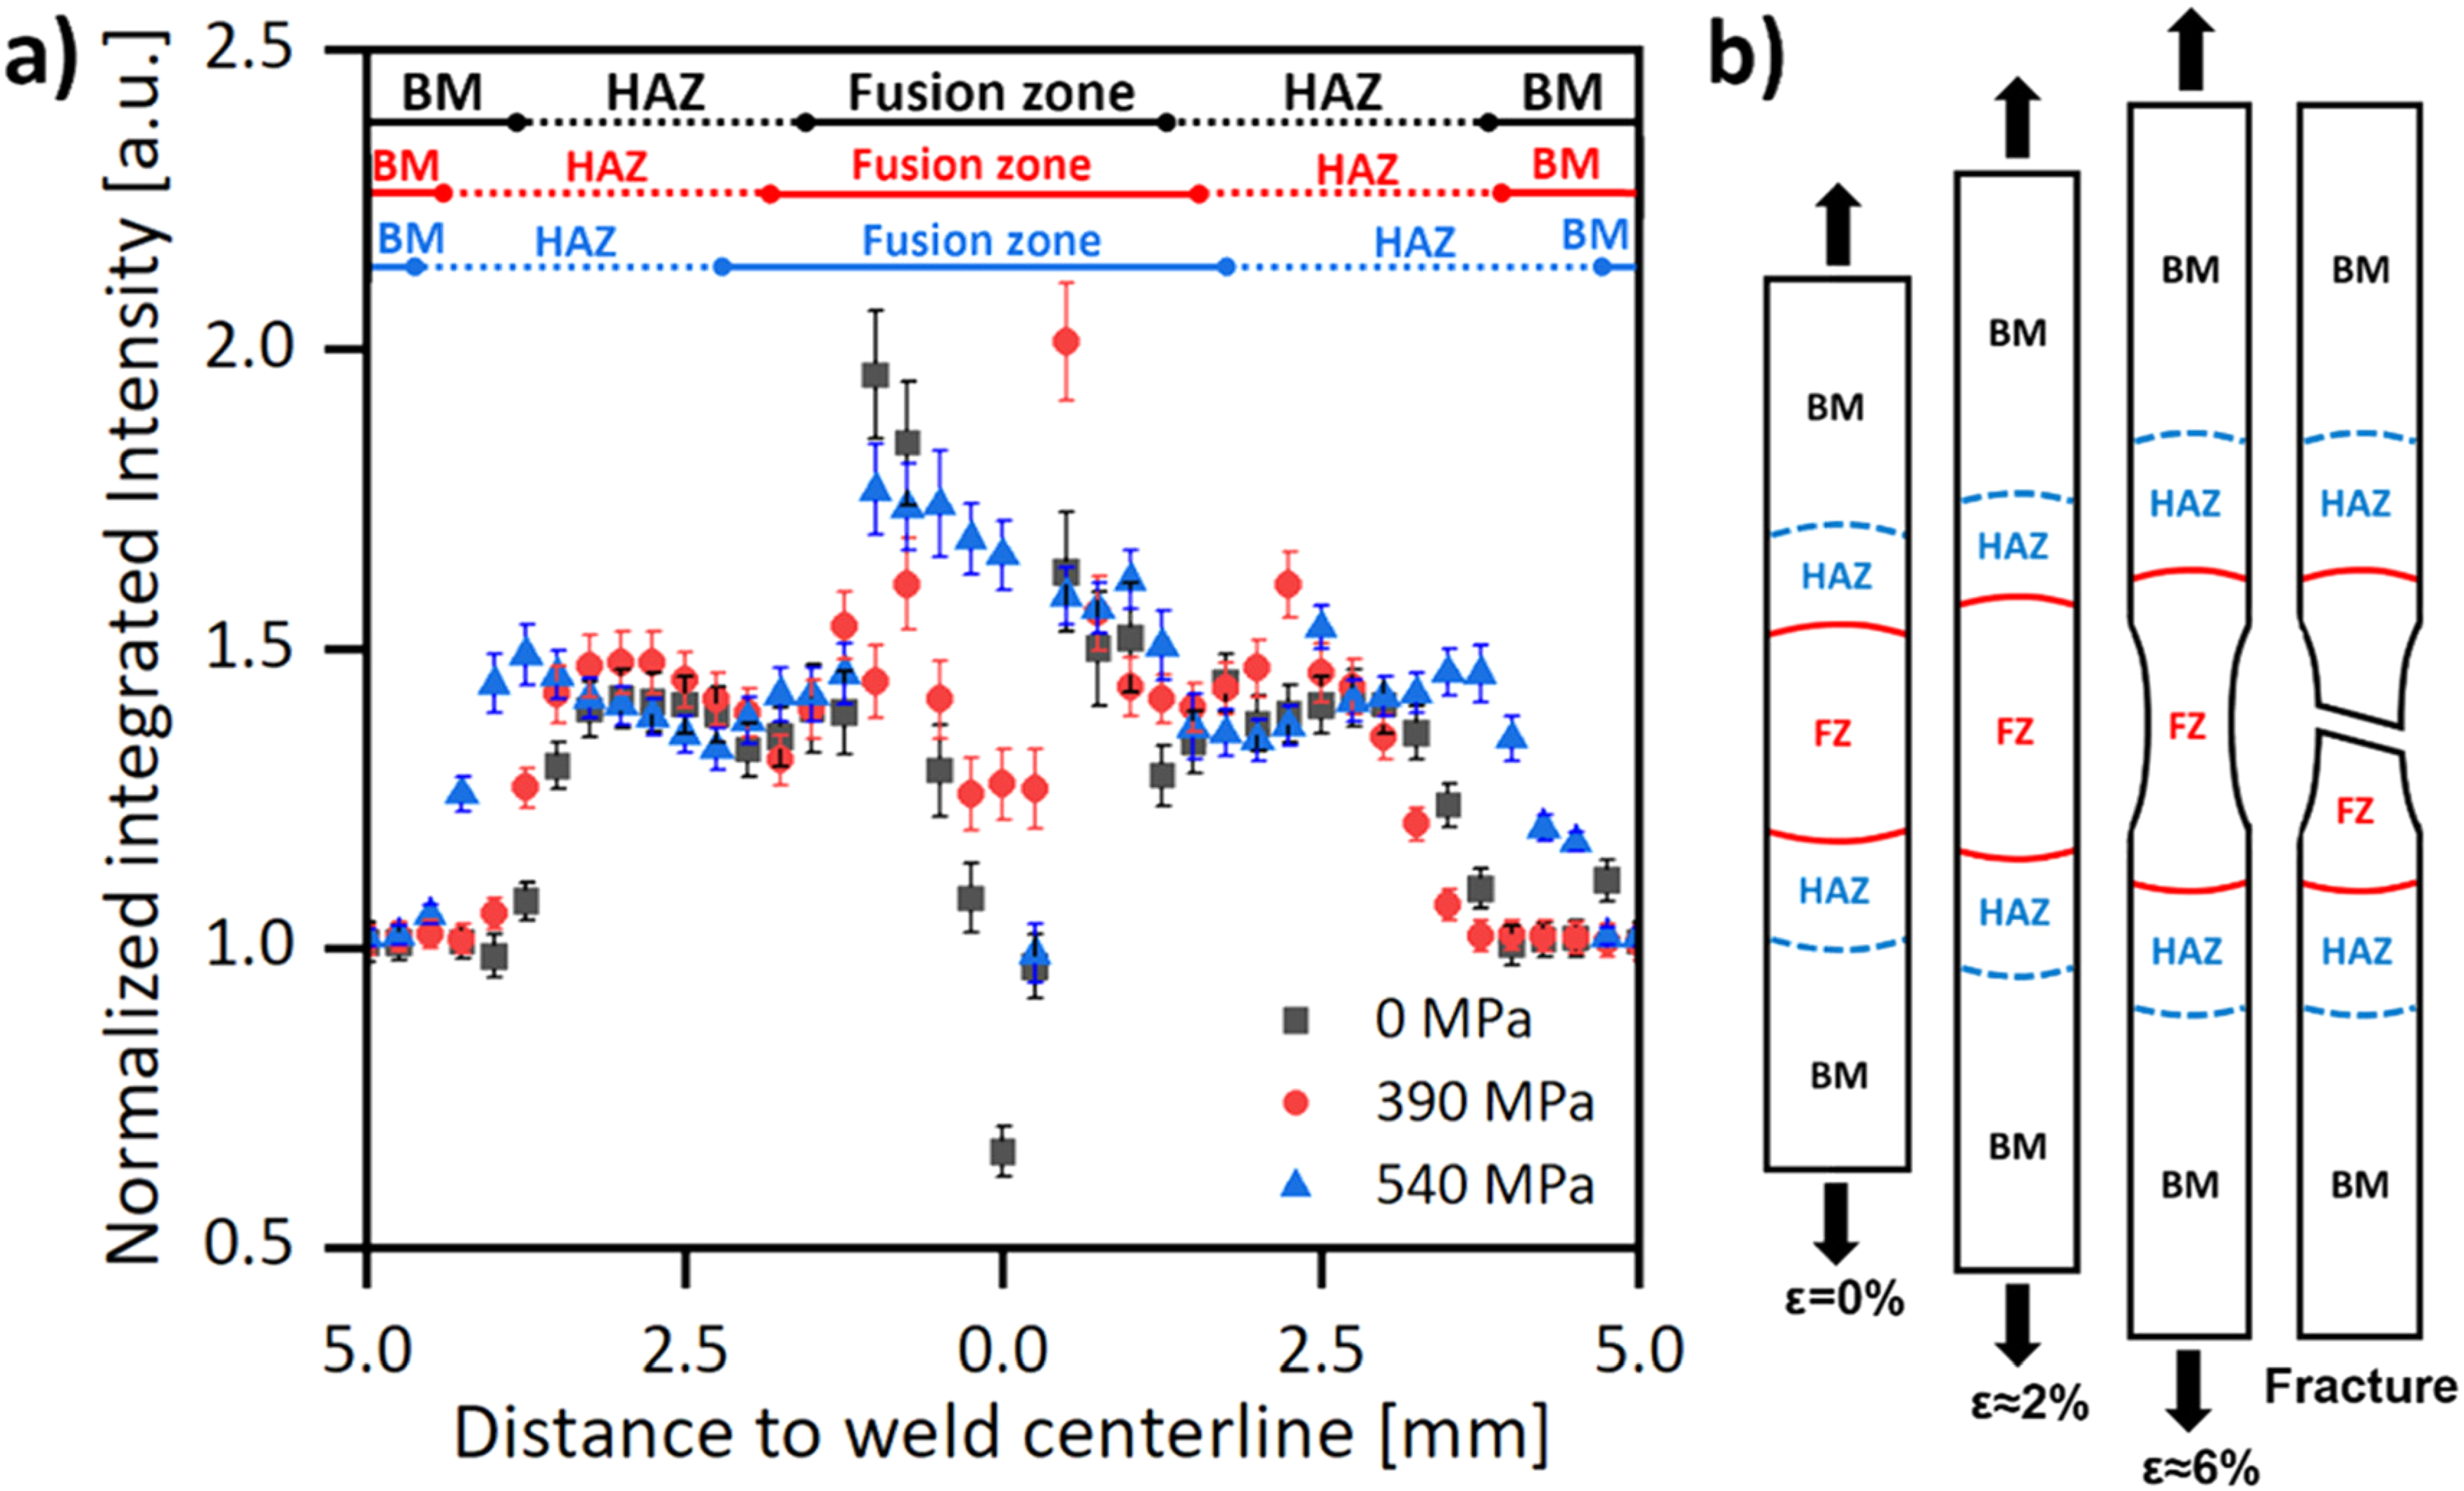
(a) Normalized integrated intensity variation of the (3 1 1) diffraction reflection obtained throughout the full extension of the weld, at different loading stages. The joint regions (BM, HAZ and FZ) are marked considering the 0 MPa loading condition. Data was obtained using full azimuthal integrated data. (b) Schematic representation of the cross-section evolution during tensile testing.
Starting from the stress-free condition (0 MPa) to the point where failure occurred, at 540 MPa, it is observed that in the BM practically no changes are observable from the microstructural evolution visible from the normalized integrated intensities. Such is due to its comparatively smaller grain size amidst the weld regions and given that this area is already strain-hardened due to previous cold rolling, causes plastic deformation to be delayed and transferred to other regions of the joint. Given this, the HAZ and the FZ are more prone to undertake several microstructure alterations during tensile testing, given their relatively lower hardness and varying microstructure (i.e., larger grain size), which will impact the diffracted intensity. In fact, although the intensity values of the HAZ also exhibit some variation throughout the test, it is in the FZ that this parameter presents itself with a more unstable behavior. That is, showcasing a more scattered intensity distribution at the beginning than in the later stages. Such is due to the large grain size present in this region. Conversely, with the increasing level of strain such distribution becomes steadier, indicating the realignment of the (3 1 1) grains as the tensile test progresses.
The differences noticeable through the normalized integrated intensity will also be visible in other meaningful peak parameters. Such is the case of peak center which allows to compute the peak-specific lattice strain evolution throughout the joint during the tensile experiment. By using Bragg's law, the lattice strain, ε, can be calculated using ε=d/d0, where d0 corresponds to the interplanar spacing at 0 MPa. Given this, Figure 3 displays a comparison in evolution of ε along the TD and LD, for the (2 0 0) and (3 1 1) peaks. Here, it is important to mention that in the FZ, these are the only visible reflections in the LD. Such occurs because the LD is aligned to the favored direction for heat flow extraction during welding. This, combined with the fact that the (2 0 0) peak is the crystallographic equivalent to the easy growth direction of FCC metals (corresponding to the (0 0 1) planes), provides the means for these grains to be oriented in a higher fraction towards the LD. 22 Additionally, beyond the aforementioned characteristics of the (3 1 1) peak, the (2 0 0) reflection corresponds to the softest plane in FCC material, 23 meaning that, of all the visible diffraction peaks, it showcases the higher deformation values with increasing levels of stress.
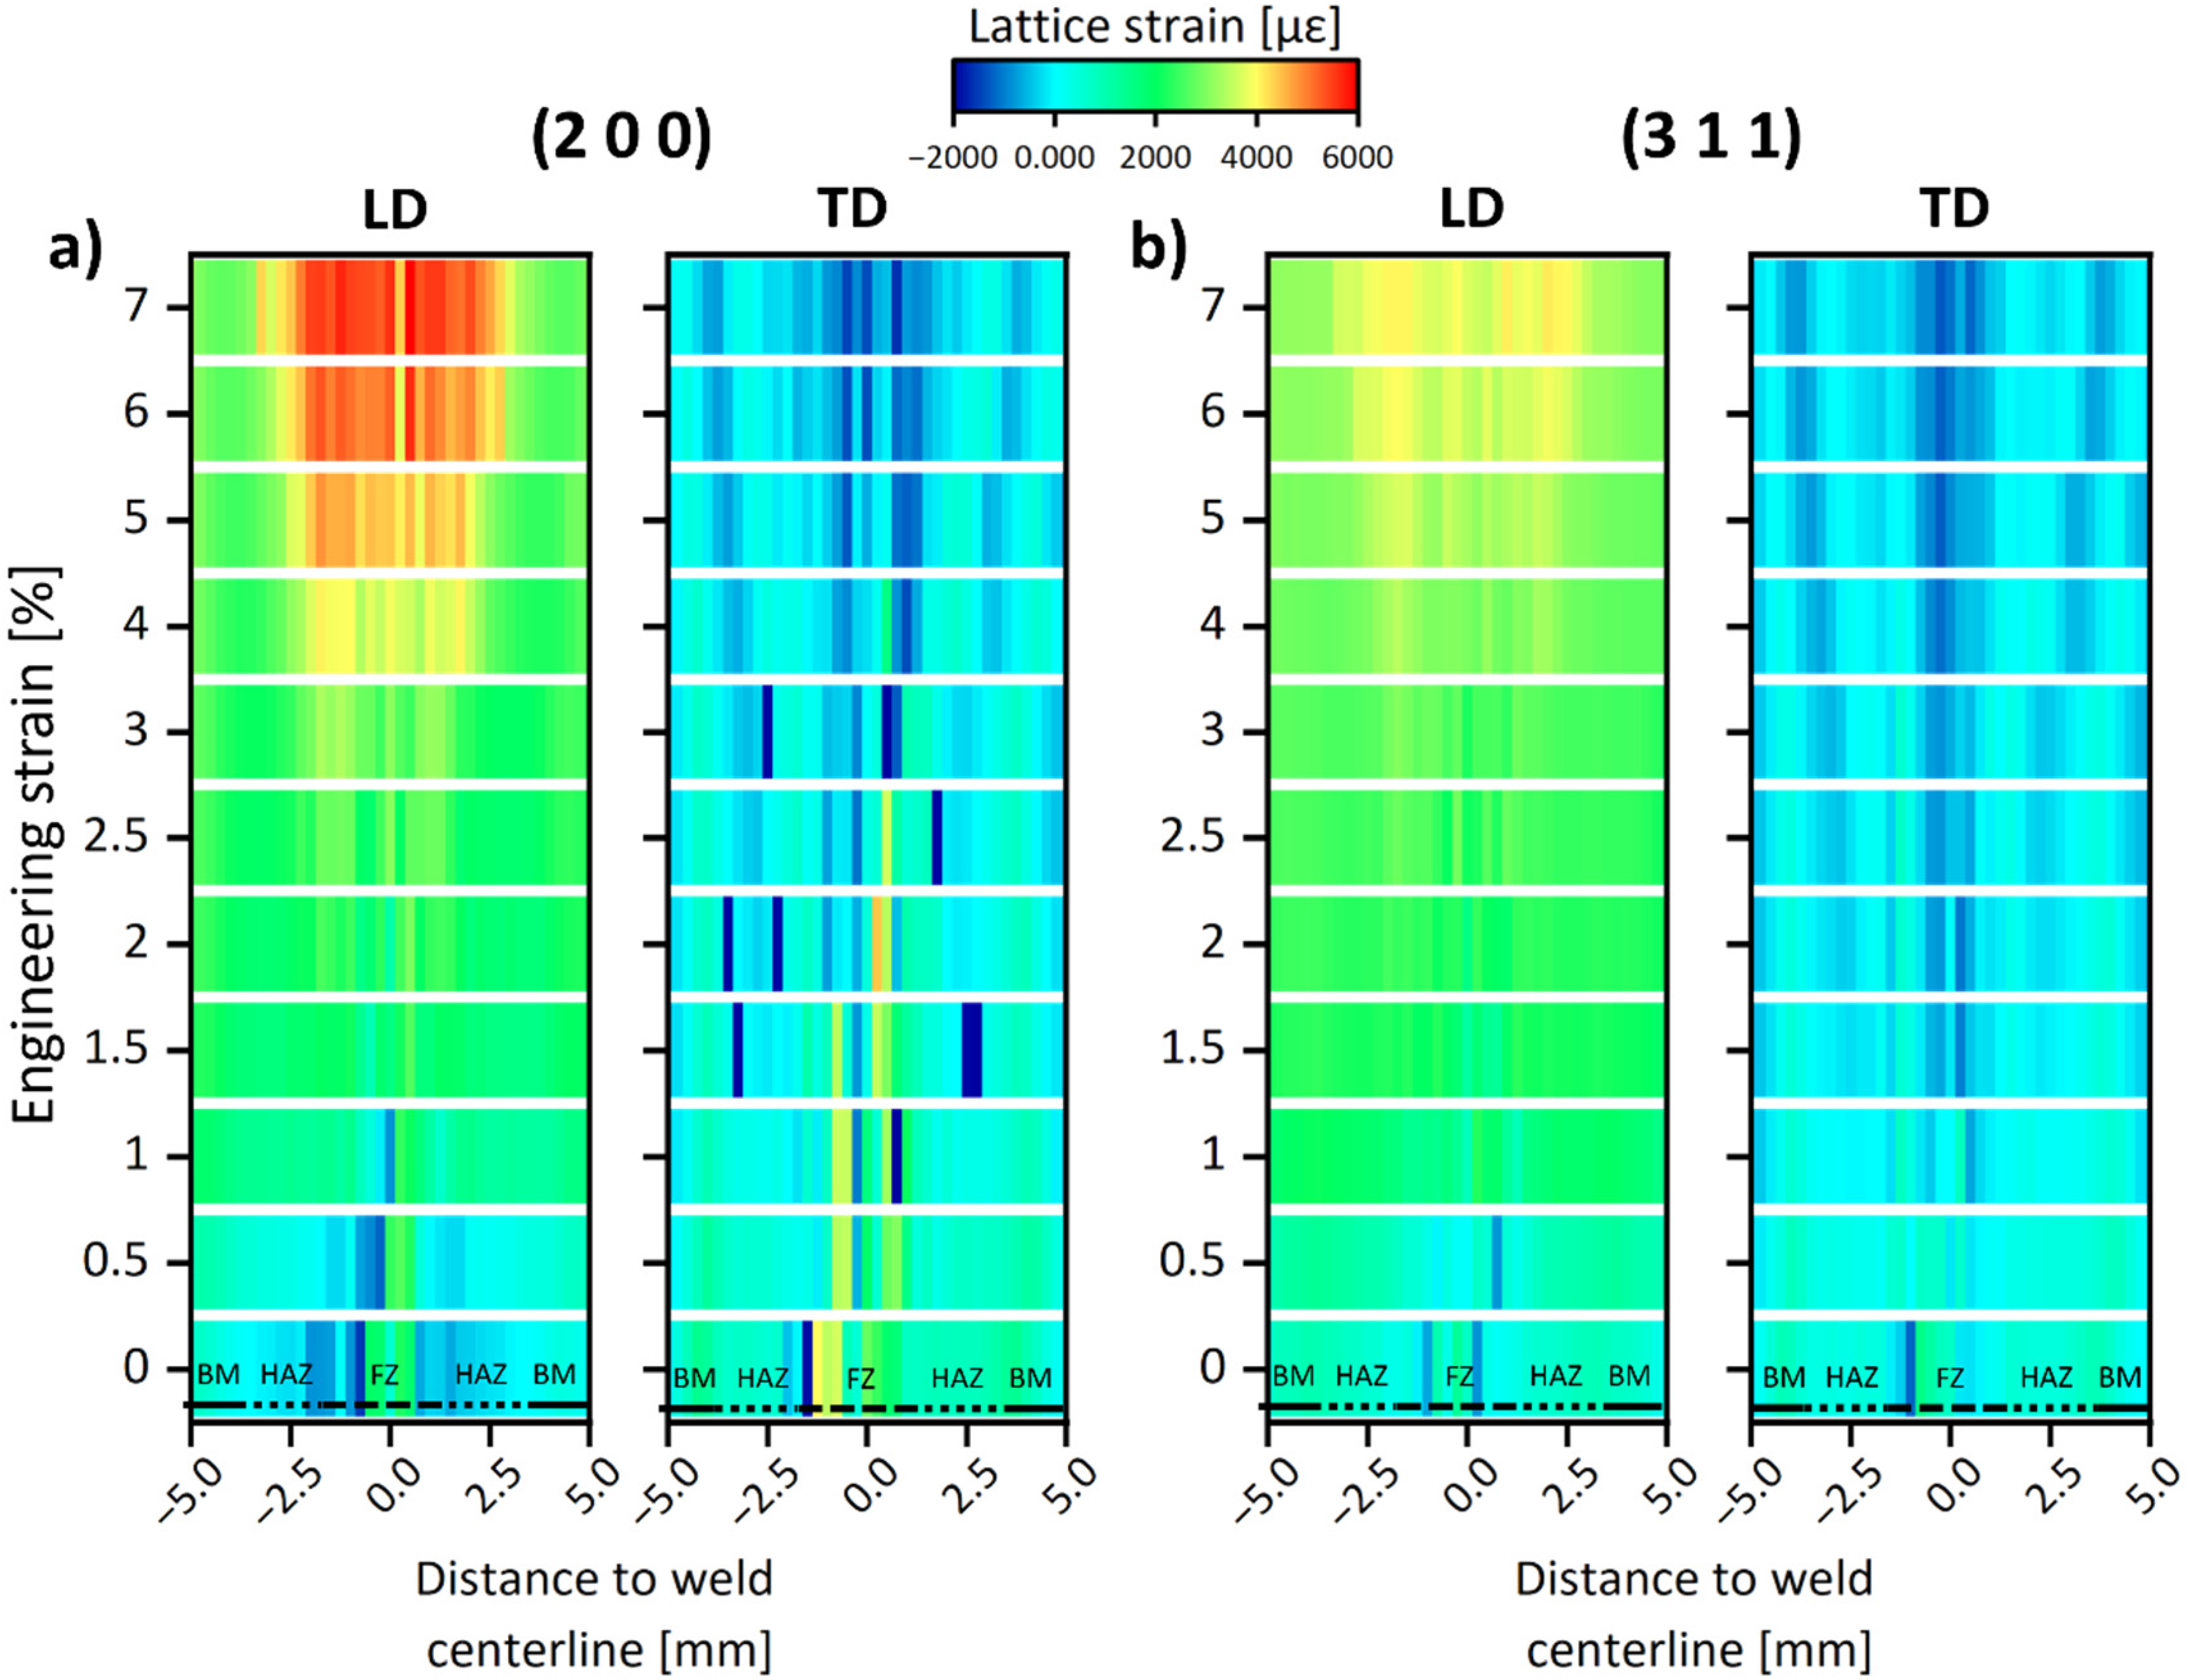
Lattice strain evolution, measured on the LD and TD, throughout the in-situ tensile test. The diffraction reflections (a) (2 0 0) and (b) (3 1 1), were chosen due to their exclusive availability in the LD of the FZ. The value of d0 was set to be the value for d-spacing obtained in the BM at the 0 MPa stage serving as the baseline for comparison.
On a qualitative basis, at 0 MPa for the (2 0 0) peak, the LD lattice strain distribution is lower in HAZ tending to increase towards the BM and the FZ. Such can be explained by the internal-stress developed during rolling of the BM and the stress-relieving phenomena associated with the high temperatures attained in the HAZ during GTAW. However, a scattered distribution is observable in the TD, achieving negative values as expected given Poisson's effect. Similarly, concerning the (3 1 1) peak, the lattice strain decreases when going from the BM to the FZ, while a more scattered distribution can be found in the TD.
In both cases, throughout the evolution of the tensile test, the lattice strain can be observed increasing in the LD, while decreasing in the TD. These changes can be especially observed in the HAZ and FZ, where a massive dissimilarity is observed in these regions of the weld, whose dimension in the LD increases throughout the test, due to the applied unidirectional force. Such is compliant with the microhardness results obtained in the joint, 12 where the BM has hardness of ≈350 HV, the HAZ showcases a peak (up to ≈375 HV), drastically reducing from that point on to ≈150 HV in the FZ, enabling us to anticipate that the majority of the strain will be imparted partially by the HAZ and from the whole FZ, the weld's softest region.
Considering the increasing extension of the FZ and the HAZ in the LD, we now focus on the individual response of each region of the weld (BM, HAZ, and FZ). Such allows us to delve into the question of how each zone, and consequently each grain family, behaves under loading.
These results are shown in Figure 4, where the lattice strain evolution regarding the increase in macroscopic strain is highlighted. There, as expected, the highest magnitude for lattice strain was achieved at the final loading stages in all cases in the FZ, followed by the HAZ and the BM.
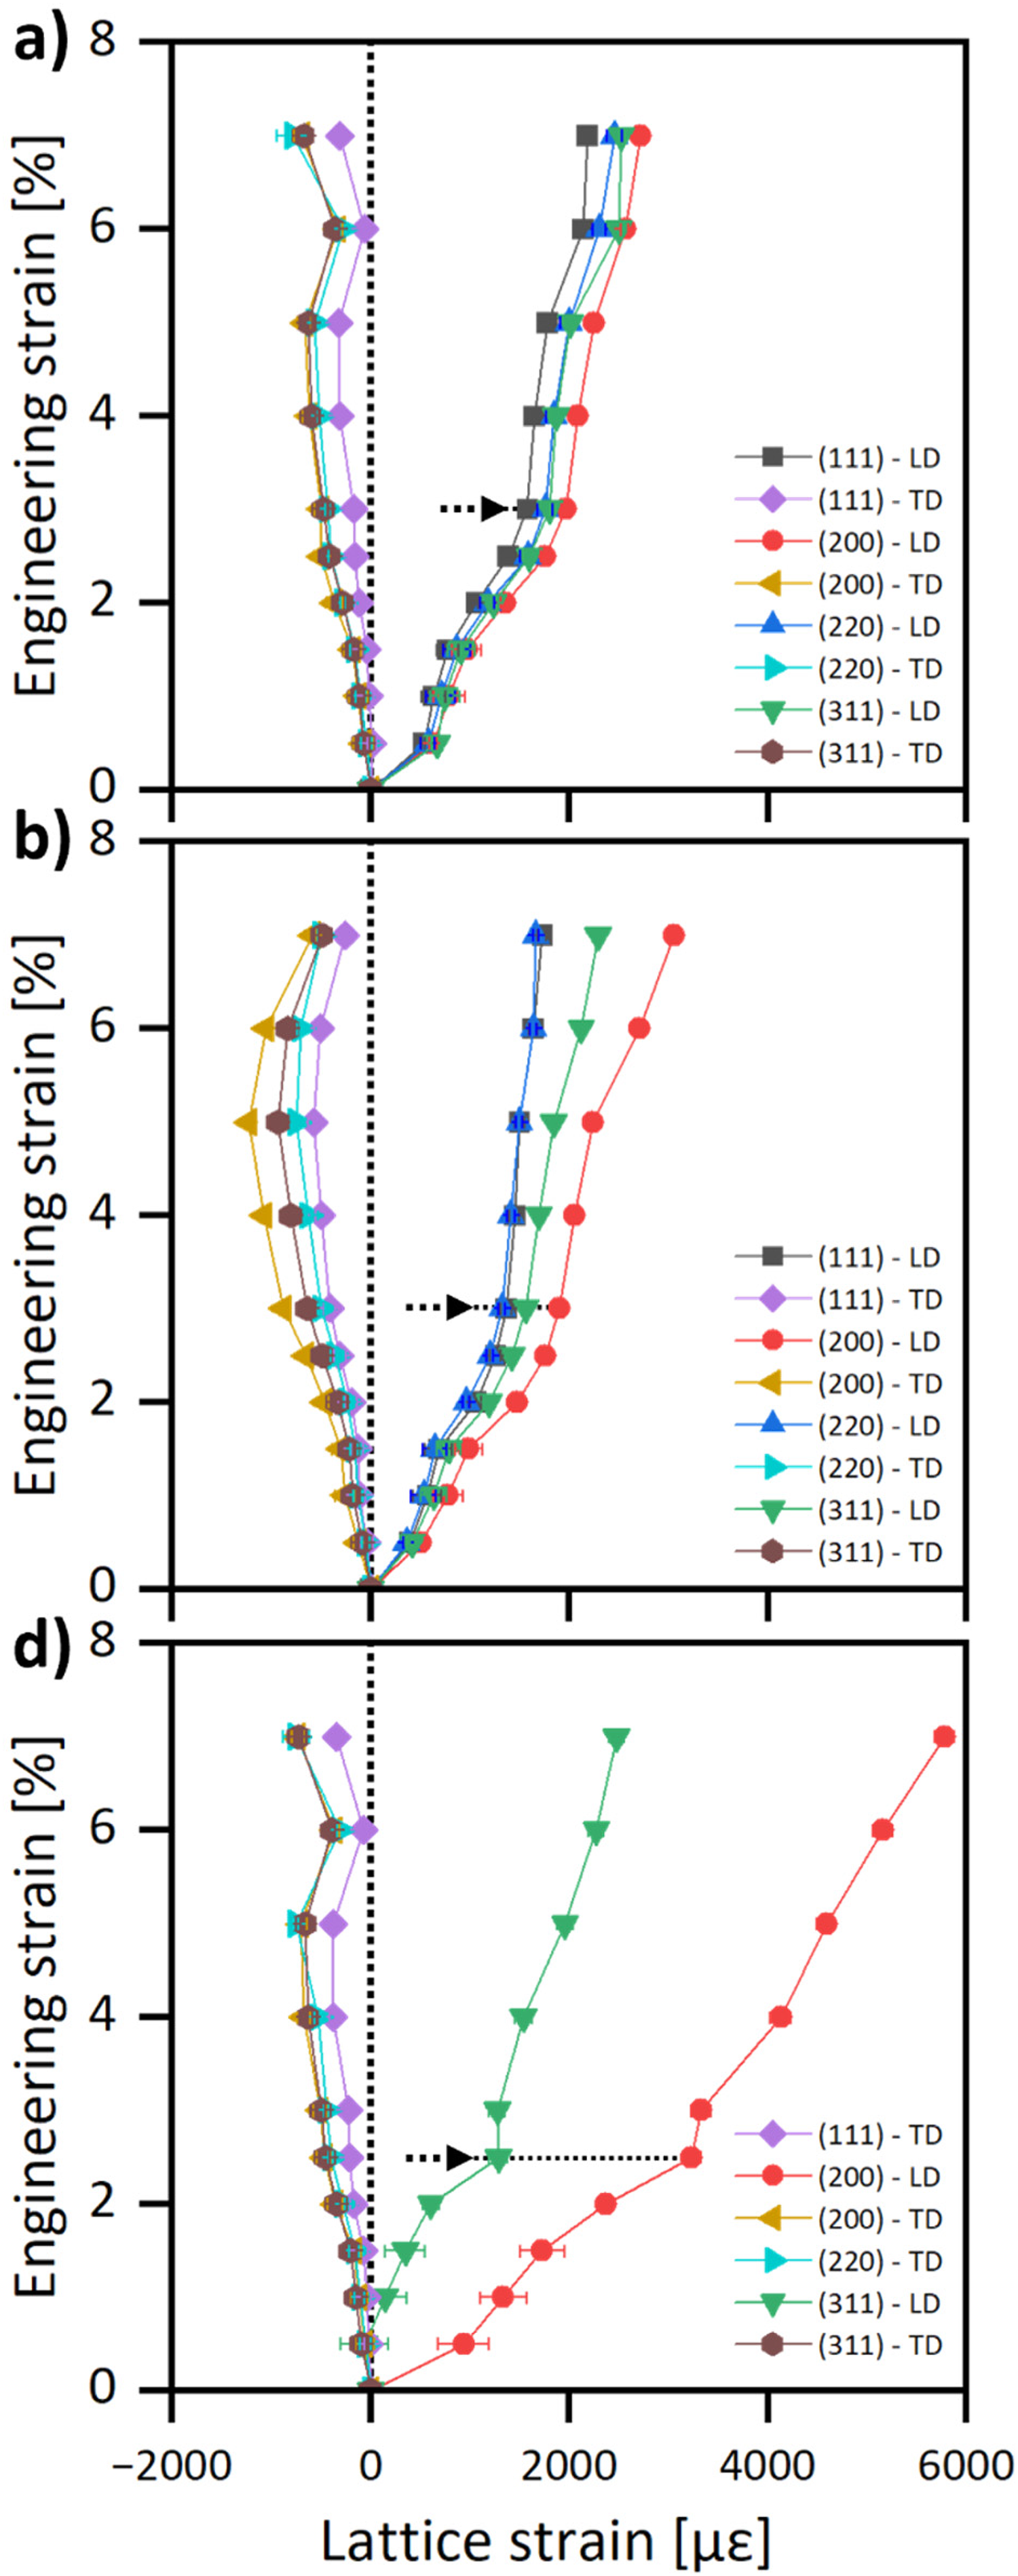
Region-specific lattice strain evolution during tensile loading along LD and TD with regard to strain. The results shown in (a) and (b) correspond to the BM, (c) and (d) correspond to the HAZ and (e) and (f) correspond to the FZ. Note that in the FZ, the only visible reflections correspond to the (2 0 0) and (3 1 1) planes on the LD, such being due to the large grain size characteristic of this region and the solidification conditions imposed during welding.
Furthermore, it is possible to distinguish the elastic and plastic domains of the tensile test, undertaken by each region, through the variation in slope exhibited by the lattice strain evolution. In this sense, a lower slope indicates that the lattice strain, which is affected by peak shift (and, thus, by the change in interplanar spacing) corresponds to the elastic domain of the tensile test. On the other hand, a steeper slope indicates that the contribution of elastic strain to the overall increase in engineering strain is minimal, therefore, marking the onset of the plastic regime during loading, where strains are mostly accommodated via dislocation slip, 24 therefore affecting peak shift in a more negligeable manner.
From this perspective, the change in the lattice strain evolution slope evidences a variation in yielding point regarding each analyzed region. That is, while in the BM and HAZ the slopes (marked with a black dashed arrow) only change when reaching a macroscopic strain level of ≈ 3%, in the change in slope exhibited in the FZ is altered in an earlier stage, at ≈ 2.5%. Such comparison allows us to observe that, amidst the three regions, the FZ yields first, although showcasing a more ductile behavior than the other regions. From this, it is possible to perceive that the lower sensitivity for changes in lattice strain in the BM is related to its highly deformed, cold-worked microstructure, while in the FZ the soft microstructure led to increasing lattice strain values during tensile testing. The HAZ will have a behavior in between those of the BM and FZ, stemming from its hardness (below that of the BM and above the FZ, except for a localized region where the grain size slightly decreased).”
Moreover, in all cases, the (2 0 0) diffraction reflection exhibits the largest lattice strain in the LD and the lowest in the TD, indicating its lower stiffness and lower hardening ability, when compared to the other analyzed grain families. Conversely, apart from the FZ, the (1 1 1) peak exhibits the stiffest behavior. The data retrieved from the accessible peaks on the FZ allows us to observe that, in this particular case, the stiffest behavior is shown by the (3 1 1) planes.
Having established the amount of lattice strain partaken by each region during the experiment, the next step is to delve deeper at the differences between the initial and final microstructure of the weld, as acknowledged in Figure 5. There, the Debye–Scherrer rings data (see Figure 1(b))) was integrated into 1-degree segments throughout the full azimuthal range, allowing to observe qualitatively, the peak center displacement and the intensity changes due to the applied stresses, indicating grain rotation.
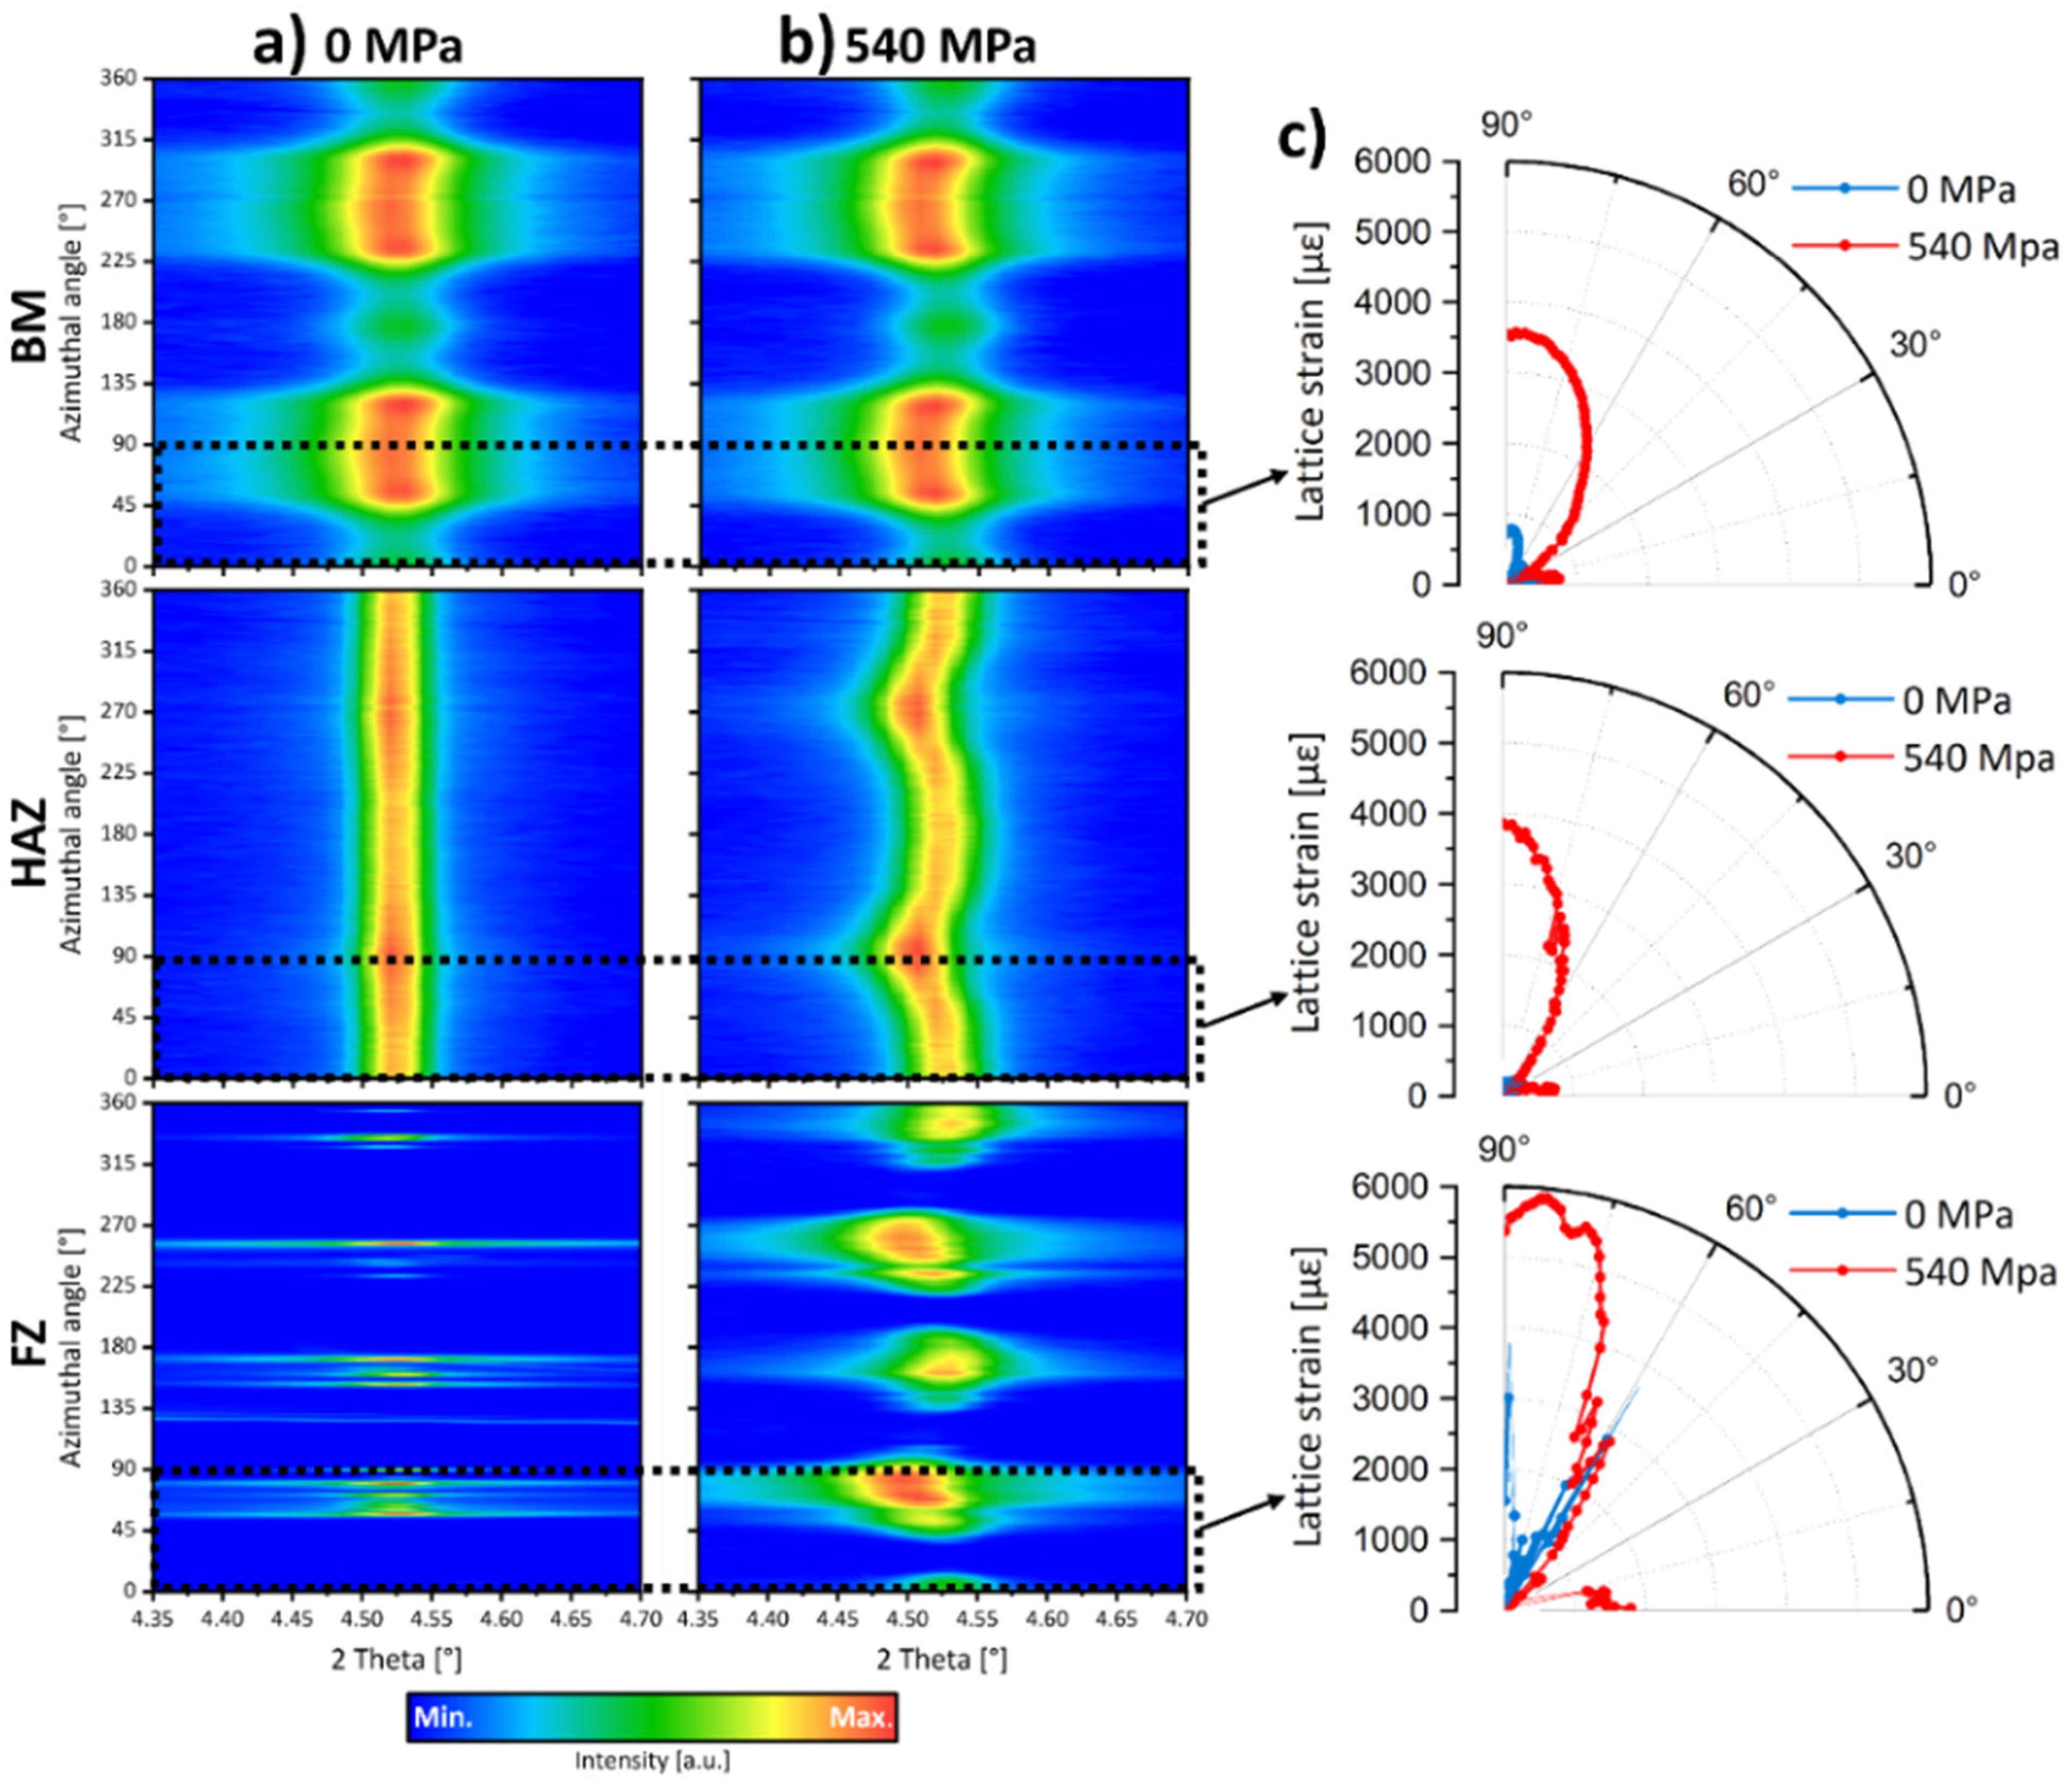
(a) Initial and (b) last stages of the tensile test probed by SXRD, highlighting, qualitatively, prevalent grain orientations on the BM, HAZ and FZ, obtained by integration of 1-degree segments on the full azimuthal range. (c) Corresponds to the obtained lattice strain on each of the segments, quantitatively indicating the amount of localized lattice strain handled by each of the regions.
On a first note, the initial condition of the three regions (BM, HAZ and FZ) highlights a clear distinction on their grain orientation distribution. Nevertheless, before analyzing each region, it should be emphasized that a high intensity on a specific azimuthal angle implies that the grains are preferably oriented towards the direction that such azimuthal angle corresponds in space.
As such, observing Figure 5(a)), corresponding to the unloaded condition, we can see that in the BM most grains are oriented in the LD, which also corresponds to the direction of rolling to which it was subjected before welding. Prior to fracture, although no significant changes can be observed in terms of peak intensity, the local lattice strain (see Figure 5(c))) increases up to ≈3 times along the LD. This region shows less differences in comparison with its initial state, which can be associated to small and highly oriented grains.
Next, we have the HAZ, which experienced recrystallization and grain growth processes during welding. At 0 MPa, this region exhibits a more random grain orientation distribution, which translates in a less evident intensity distribution over the full azimuthal range. At 540 MPa, however, a clear rotation of the grains in the LD (90° and 270° angles) can be observed. Quantification of the microstrain indicates that the local lattice strain distribution in this region increases to ≈4 times more than in its initial condition.
Lastly, we turn to the FZ, where the widely sparse intensity distribution is caused by the large grain size. This results in the collection of diffraction data from a relatively lower number of grains, given that the adopted beam spot size remained constant throughout the test. Comparison between the initial and final stages enables to observe that the grains have reoriented/deformed to accommodate the imposed external stress. In this region, at 540 MPa, the intensities are also higher in the LD. This suggests that the FZ is the region that undergoes most microstructural changes to grant the as-welded HEA most of its mechanical performance. In this region the local lattice strain increases up to ≈6 times in the LD and ≈2 times in the TD, in comparison with its original state.
In conclusion, an in-situ tensile experiment coupled with high energy SXRD was performed on a CoCrFeMnNi high entropy alloy welded joint. It was shown that a UTS of 541 MPa was reached with fracture occurring at an engineering strain of 7.93%. Overall, a qualitative and quantitative comparison between each of the welded regions was performed, allowing to highlight the differences arising from their mechanical response to the tensile loading. More specifically, using the intensity distribution evidenced the location of the welded regions, and site-specific analysis allowed to exhibit the intensity distribution throughout the azimuthal angle on each region, highlighting grain rotation during the tensile solicitation. Regarding the lattice strain, the imparted strain on each region was quantified, indicating that the FZ was the most impacted region by the external stresses. Overall, the FZ was noted to be the critical region of the GTAW joint.
The raw/processed data required to reproduce these findings cannot be shared at this time as the data also forms part of an ongoing study.
Footnotes
Declaration of conflicting interests
The authors declared no potential conflicts of interest with respect to the research, authorship, and/or publication of this article.
Funding
The authors disclosed receipt of the following financial support for the research, authorship, and/or publication of this article: This work was supported by the Fundação para a Ciência e a Tecnologia, (grant number 2020.07350.BD). JPO acknowledges funding by national funds from FCT - Fundação para a Ciência e a Tecnologia, I.P., in the scope of the projects Nos. LA/P/0037/2020, UIDP/50025/2020, and UIDB/50025/2020 of the Associate Laboratory Institute of Nanostructures, Nanomodelling and Nanofabrication – i3N.