
Abstract
Background:
Systemic thrombolysis (ST) is the guideline-recommended treatment for high-risk pulmonary embolism (PE), although catheter-directed thrombolysis (CDT) may provide a treatment alternative associated with lower rates of bleeding. Furthermore, the treatment trends and outcomes among those with high-risk PE according to treatment assignments of no lytic therapy (NLT), ST, and CDT are underreported.
Methods:
Patients hospitalized for high-risk PE between 2016 and 2019 were identified by administrative claims codes from the National Readmission Database. Therapy assignment was similarly defined by administrative codes, then stratified into NLT, ST, and CDT cohorts to report patient characteristics, care settings, and clinical outcomes. The primary outcome was in-hospital mortality with rates adjusted for patient and hospital characteristics using multivariable logistic regression. Secondary outcomes included intracranial hemorrhage (ICH), gastrointestinal bleeding (GIB), and 90-day readmission. Over the years of interest, trends in lytic treatment along with concomitant use of mechanical or surgical thrombectomy were reported.
Results:
Among 74,516 patients with high-risk PE, 61,569 (82.6%) received NLT, 8445 (11.3%) received ST, and 4502 (6.04%) received CDT. The NLT subgroup, relative to ST and CDT, tended to be older (66.1 ± 15.4, 62.8 ± 15.3, and 63.4 ± 14.4; p < 0.001) and more frequently women (56.0%, 54.4%, and 51.3%; p < 0.001), respectively. The unadjusted in-hospital mortality rate was highest for ST (18.8%, 34.1%, and 18.3% for NLT, ST, and CDT, respectively; p < 0.001) and persisted after multivariable adjustment (adjusted odds ratio (aOR) 0.43; 95% CI 0.38–0.49; p < 0.0001) of in-hospital mortality for CDT relative to ST. The unadjusted rate of ICH or GIB was lowest for NLT (1.0%, 2.0%, and 0.6% for NLT, ST, and CDT, respectively; p < 0.001). CDT, relative to ST, was associated with reduced odds of ICH (aOR 0.32; 95% CI 0.18–0.55; p < 0.0001) and GIB (aOR 0.78; 95% CI 0.62–0.98; p < 0.0001). Readmissions were highest for NLT (21.7%, 9.6%, and 12.1% for NLT, ST, and CDT, respectively; p < 0.001). CDT was associated with a higher incidence of 90-day readmission relative to ST (aOR 1.32; 95% CI 1.10–1.57; p < 0.001). From 2016 to 2019, individual treatment trends were not significantly different, although NLT tended to be offered among smaller and rural hospitals. Rates of concomitant thrombectomy were low in all three treatment groups.
Conclusions:
Among a large, contemporary, US cohort with high-risk PE, over 80% of patients did not receive any form of thrombolysis. High-risk PE that did receive systemic thrombolysis was associated with the highest rates of in-hospital mortality, suggesting opportunities to study the implementation of lytic and nonlytic-based treatments to improve outcomes for those presenting with high-risk PE.
Keywords
Background
Pulmonary embolism (PE) represents the third leading cause of cardiovascular mortality and is a growing public health problem.1,2 In its intermediate and high-risk forms, PE is associated with a significant risk for morbidity and mortality. High-risk PE is characterized by hemodynamic instability or cardiac arrest and particularly poor outcomes.3,4 Systemic thrombolysis (ST) is the guideline-recommended treatment for high-risk PE, although ST is associated with a significant bleeding risk, including intracranial hemorrhage (ICH). 5 Catheter-directed thrombolysis (CDT) has demonstrated short-term efficacy in the management of high-risk PE and, by way of significantly lower thrombolytic dosing, may provide a lower bleeding risk over ST as first-line treatment.6,7 The most recent recommendations from the American College of Chest Physicians suggest that CDT be reserved for those with acute PE associated with hypotension and (a) high bleeding risk, (b) failed ST, or (c) shock that is likely to cause death before ST can take effect, and when appropriate expertise and resources are available to provide this invasive treatment. 8
The high acuity and emergent nature of high-risk PE present challenges in systematically comparing CDT and ST for high-risk PE. Selection of CDT or ST is also likely dependent on baseline patient characteristics as well as local hospital characteristics and capabilities, which are underreported. Therefore, we present a retrospective analysis from a large national dataset to gain additional insight into the treatment trends and outcomes of high-risk PE after treatment with CDT and ST.
Methods
Data source
The National Readmission Database (NRD) is a publicly available database of all-payer inpatient stays developed by the Agency for Healthcare Research and Quality (AHRQ) through the Healthcare Cost and Utilization Project (HCUP). 9 The NRD is sourced from state inpatient databases containing verified patient linkage numbers that can be used to track a patient across hospitals while adhering to strict privacy guidelines. The NRD includes data from 21 to 30 states based on the year, accounting for 49.3% of the total US resident population and 49.1% of all hospitalizations. The NRD contains all the discharge records of patients treated in US community hospitals apart from rehabilitation and long-term acute care facilities. Discharge weights are given to obtain national estimates. This study was deemed exempt from the institutional review board review as NRD is a publicly available database that contains de-identified patient information.
Study population
The NRD database was queried from 2016 to 2019 among adult patients > 18 years discharged with a principal diagnosis of high-risk PE. High-risk PE was identified by a qualifying International Classification of Diseases, Tenth Revision (ICD-10) code for PE as the principal diagnosis of the admission, with concomitant codes for hypotension, shock, cardiac arrest, and the use of mechanical ventilation, blood transfusion, or vasopressor utilization initiated prior to the day of thrombolysis. A similar approach and ICD codes have been previously implemented by other authors. 10 A previous study by Burles et al. reported that the PE ICD-10 codes have 91.1% (95% CI 89.4–92.6) sensitivity with a specificity of 99.9% (95% CI 99.9–99.9). 11
High-risk PE patients were then stratified by lytic-based therapy assignment into no lytic therapy (NLT), ST, and CDT. We excluded admissions with missing data regarding in-hospital mortality, admissions associated with a diagnostic code for acute ischemic stroke, ST-segment elevation myocardial infarction, or acute limb ischemia to avoid including patients who received thrombolysis for other indications; we further excluded patients whose admission was associated with a ventricular assist device or intra-aortic balloon pump to avoid including patients who might have cardiac arrest or cardiogenic shock from non-PE causes.
Demographic data, including age, sex, past medical history, and median household income, were collected, as well as the hospital’s characteristics and Elixhauser comorbidities. 12
For the readmission outcomes, admissions were excluded if the hospitalization occurred in a state other than the patient’s primary residence because any readmission occurring in a different state from that of the index hospitalization would not be captured by the NRD. To allow for at least 90-day follow-up on all patients, those discharged in the months of October, November, and December of each of the study years were excluded as the NRD can only track the patients within the same calendar year, and not across different years. Readmissions were defined as the first readmission for any cause that occurred within 90 days after index discharge. Patients with missing data regarding in-hospital mortality were excluded.
Outcomes
The primary outcome was in-hospital mortality. Secondary outcomes included in-hospital complications, intracranial hemorrhage, gastrointestinal bleed, procedural access bleeding, acute kidney injury, dialysis, inferior vena cava filter placement, discharge to a skilled nursing facility, palliative care service utilization, and other bleeding. For the readmission outcomes, our analysis included: unplanned 90-day readmission, pneumonia or sepsis, inferior vena cava filter placement, acute myocardial infarction, acute heart failure, acute kidney injury, cardiac arrhythmia, transient ischemic attack, ischemic stroke, and intracranial bleed.
Time to readmission was calculated as the number of days between hospital discharge after index admission and the first day of hospital readmission. Other index admission complications and causes of readmission were also examined as secondary outcomes. Resource utilization data included length of stay (LOS) and total hospital costs were reported. The costs associated with hospitalization were calculated by merging the cost-to-charge dataset with the NRD dataset provided by HCUP, the sponsor of the NRD. The cost of each inpatient hospitalization was estimated by multiplying the total hospital charge by the cost-to-charge ratio as per HCUP recommendations. 9
Statistical analysis
Categorical variables were reported as percentages, and continuous variables were reported as mean with SD. Pearson’s chi-squared test or Fisher’s exact test were used to compare categorical variables, and Student’s t-test and the Wilcoxon rank-sum test were used to compare continuous variables. The HCUP (cost-to-charge ratio files) were used to calculate hospital costs. Multivariable logistic regression was used to adjust for baseline patient and hospital characteristics to estimate the adjusted odds ratio (aOR) with 95% CI for primary and secondary outcomes across the ST and CDT cohorts using covariates presented by previous work that identified markers of readmission. 13 These covariates included: malignancy, nonelective index hospitalization, insurance type (Medicaid and Medicare), heart failure, chronic lung disease, chronic kidney disease (class 3–5), fluid and electrolyte disorder, age, sex, duration of index admission more than 5 days, presence of more than seven chronic medical conditions, and discharge to a short-term facility. Estimators were also adjusted for hospital teaching status, hospital stratum, and bed size. The log-rank test was used to compare time to readmission. The linear chi-squared test was used to evaluate temporal trends. Two-sided p-values were used with a significance threshold of p < 0.05. Statistical analyses were performed using Stata, SE version 16.0 (StataCorp LLC, College Station, TX, USA).
Results
Population characteristics
From 2016 to 2019, 76,916 patients were hospitalized for high-risk PE. Exclusions included missing in-hospital mortality data (n = 23), ST-segment elevation myocardial infarction (n = 318), utilization of a ventricular assist device or intra-aortic balloon pump (n = 390), acute ischemic stroke (n = 1606), and acute limb ischemia (n = 63), leaving 74,516 available for this analysis (Figure 1).
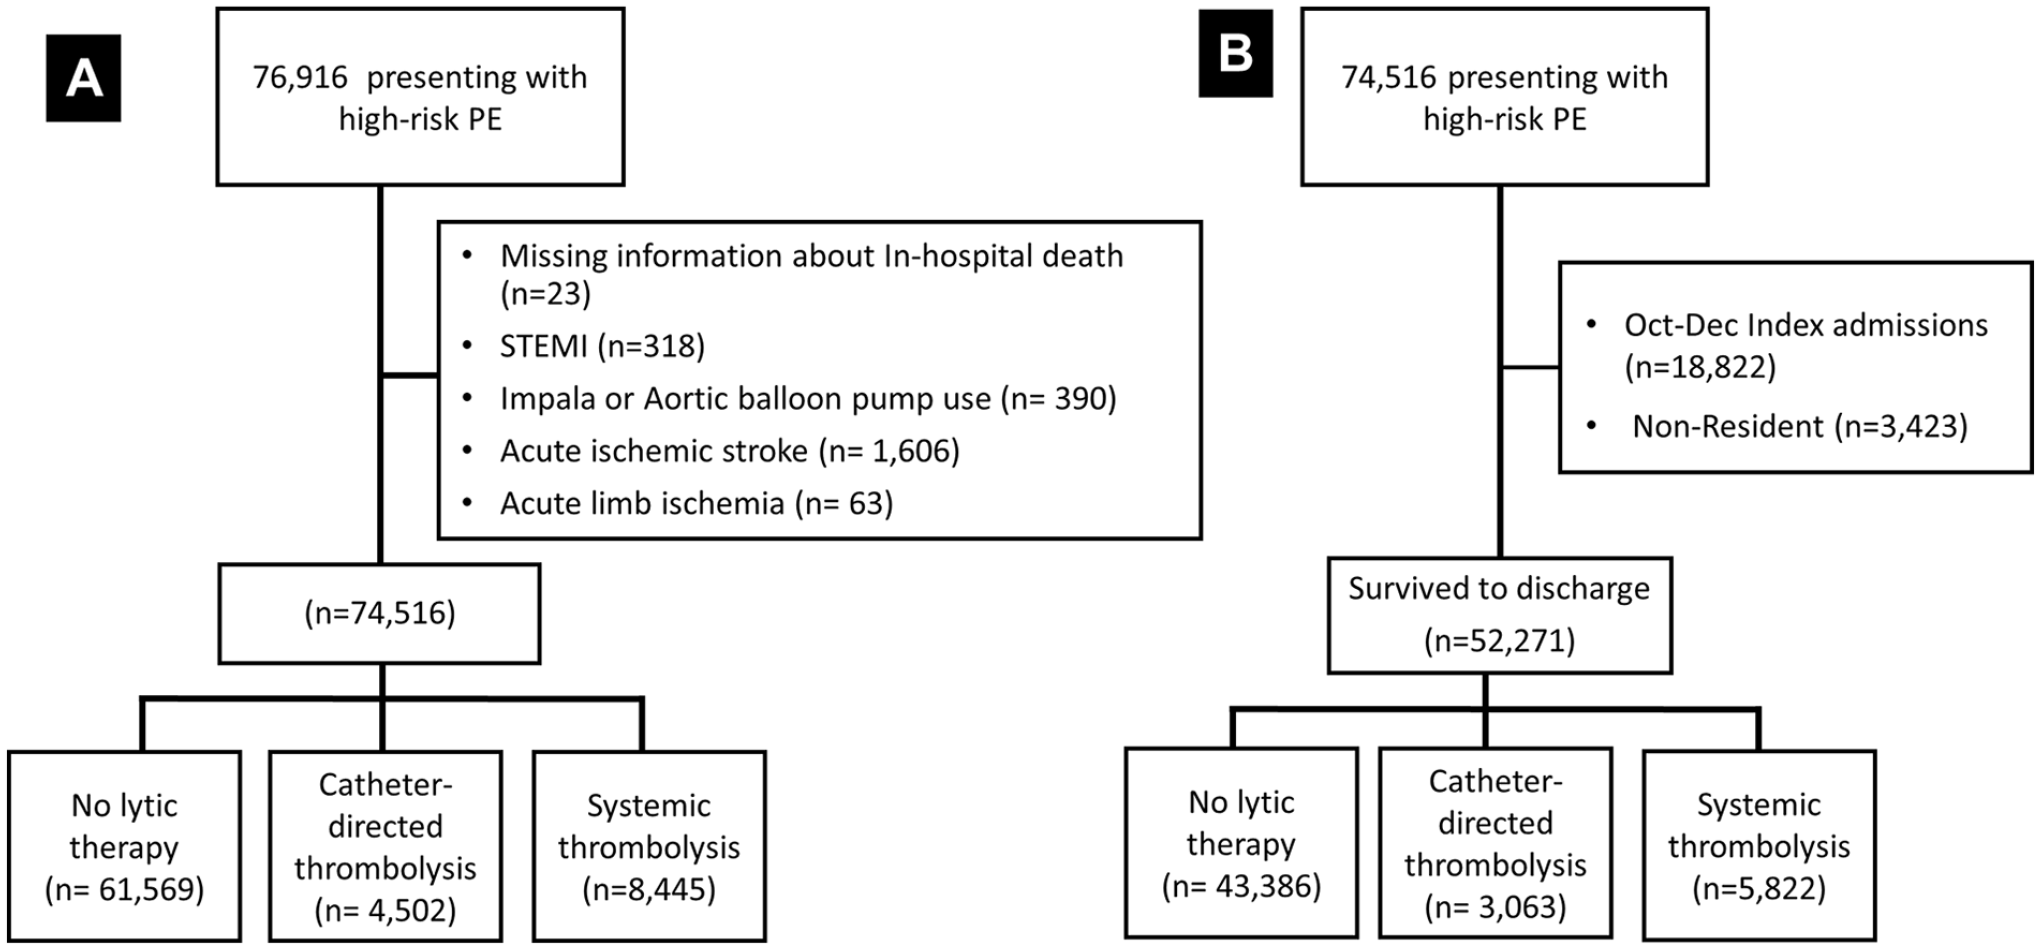
Study design.
Baseline characteristics
Among the NLT (n = 61,569; 82.6%), ST (8445; 11.3%), and CDT (4502; 6.04%) treatment cohorts, those receiving NLT tended to be older (mean age 66.1 ± 15.4 years, 62.8 ± 15.3 years, and 63.4 ± 14.4 years, respectively; p < 0.001) and were more frequently women (56.0%, 54.4%, and 51.3%, respectively; p < 0.001) (Table 1). Medical comorbidities, including cancer, rheumatologic disease, coronary artery disease, tobacco smoking, chronic obstructive pulmonary disease, chronic kidney disease class 3–5, end-stage renal disease, and prior stroke were most prevalent among the NLT cohort. Criteria for high-risk PE were met by hypotension (48.7%, 37.1%, 54.5%), shock (16.7%, 56.1%, 42.1%), cardiac arrest (11.9%, 34.5%, 17.0%), mechanical ventilation (24.3%, 48.7%, 28.4%), blood transfusion (27.4%,12.4%, 8.9%), and vasopressor utilization (3.1%, 10.8%, 5.3%), for NLT, ST, and CDT treatment cohorts, respectively. Individual pati-ents frequently had more than one feature of high-risk PE (Table 2).
Patient characteristics and therapeutic context among hospitalized patients with high-risk pulmonary embolism from 2016 to 2019, compared according to treatment status with nonthrombolytic or thrombolytic treatment.
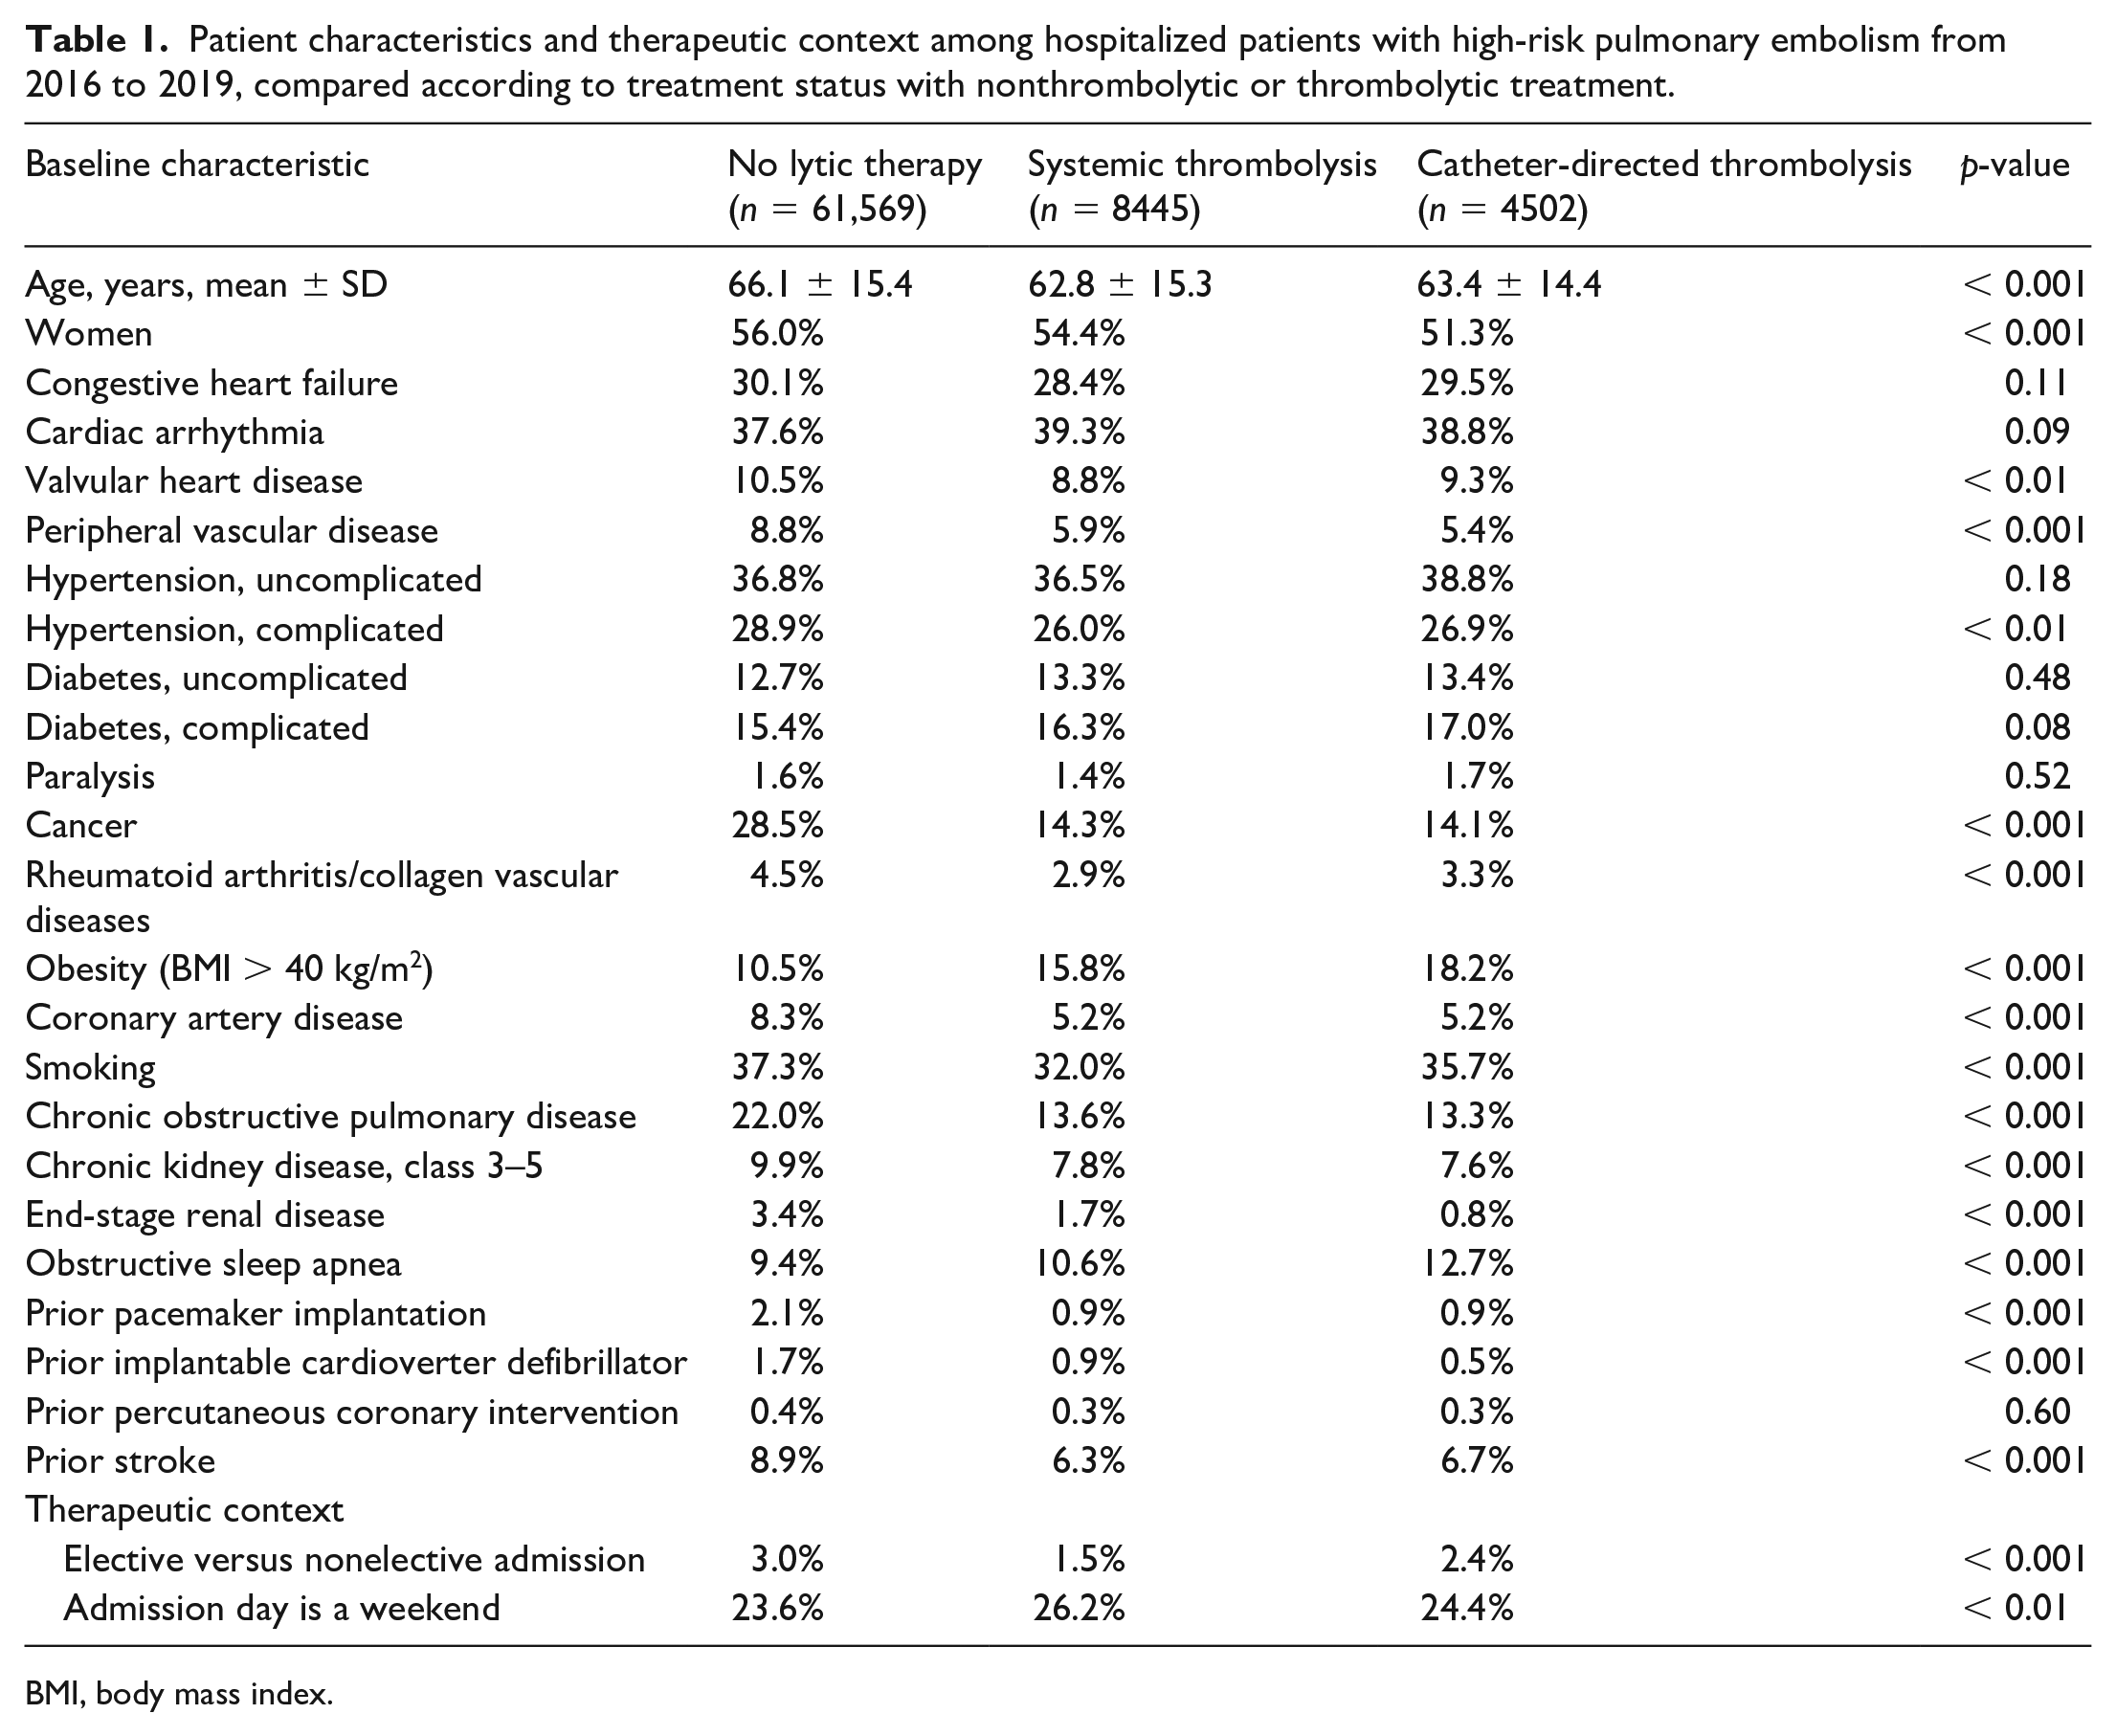
BMI, body mass index.
Criteria for high-risk pulmonary embolism, compared according to treatment status with nonthrombolytic or thrombolytic treatment.
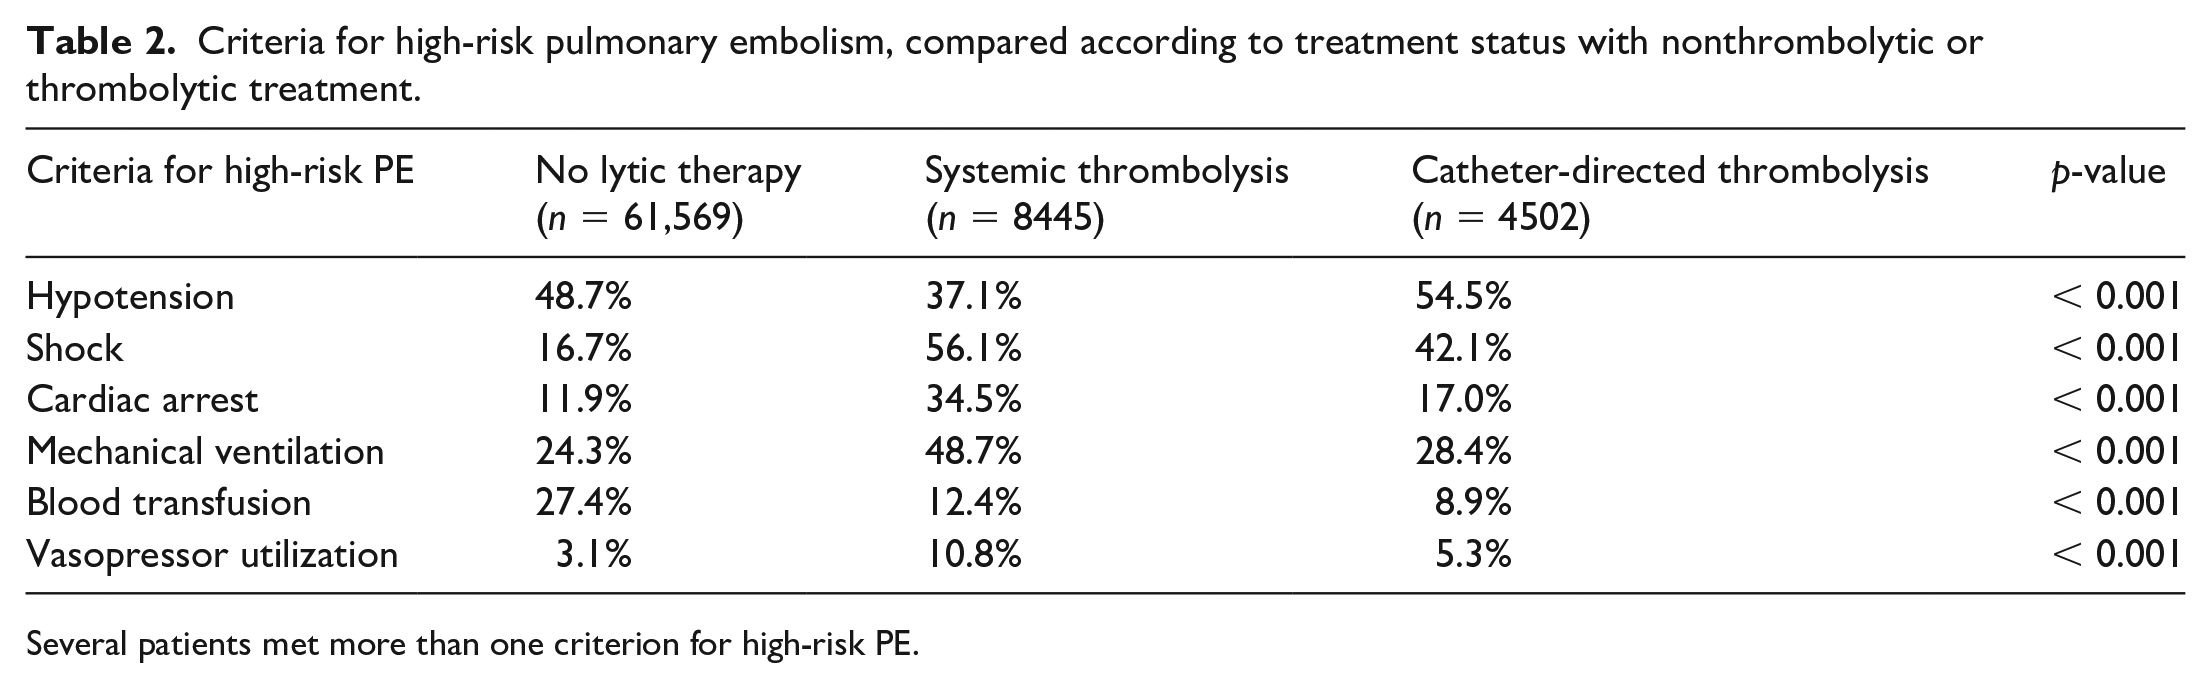
Several patients met more than one criterion for high-risk PE.
Primary outcome
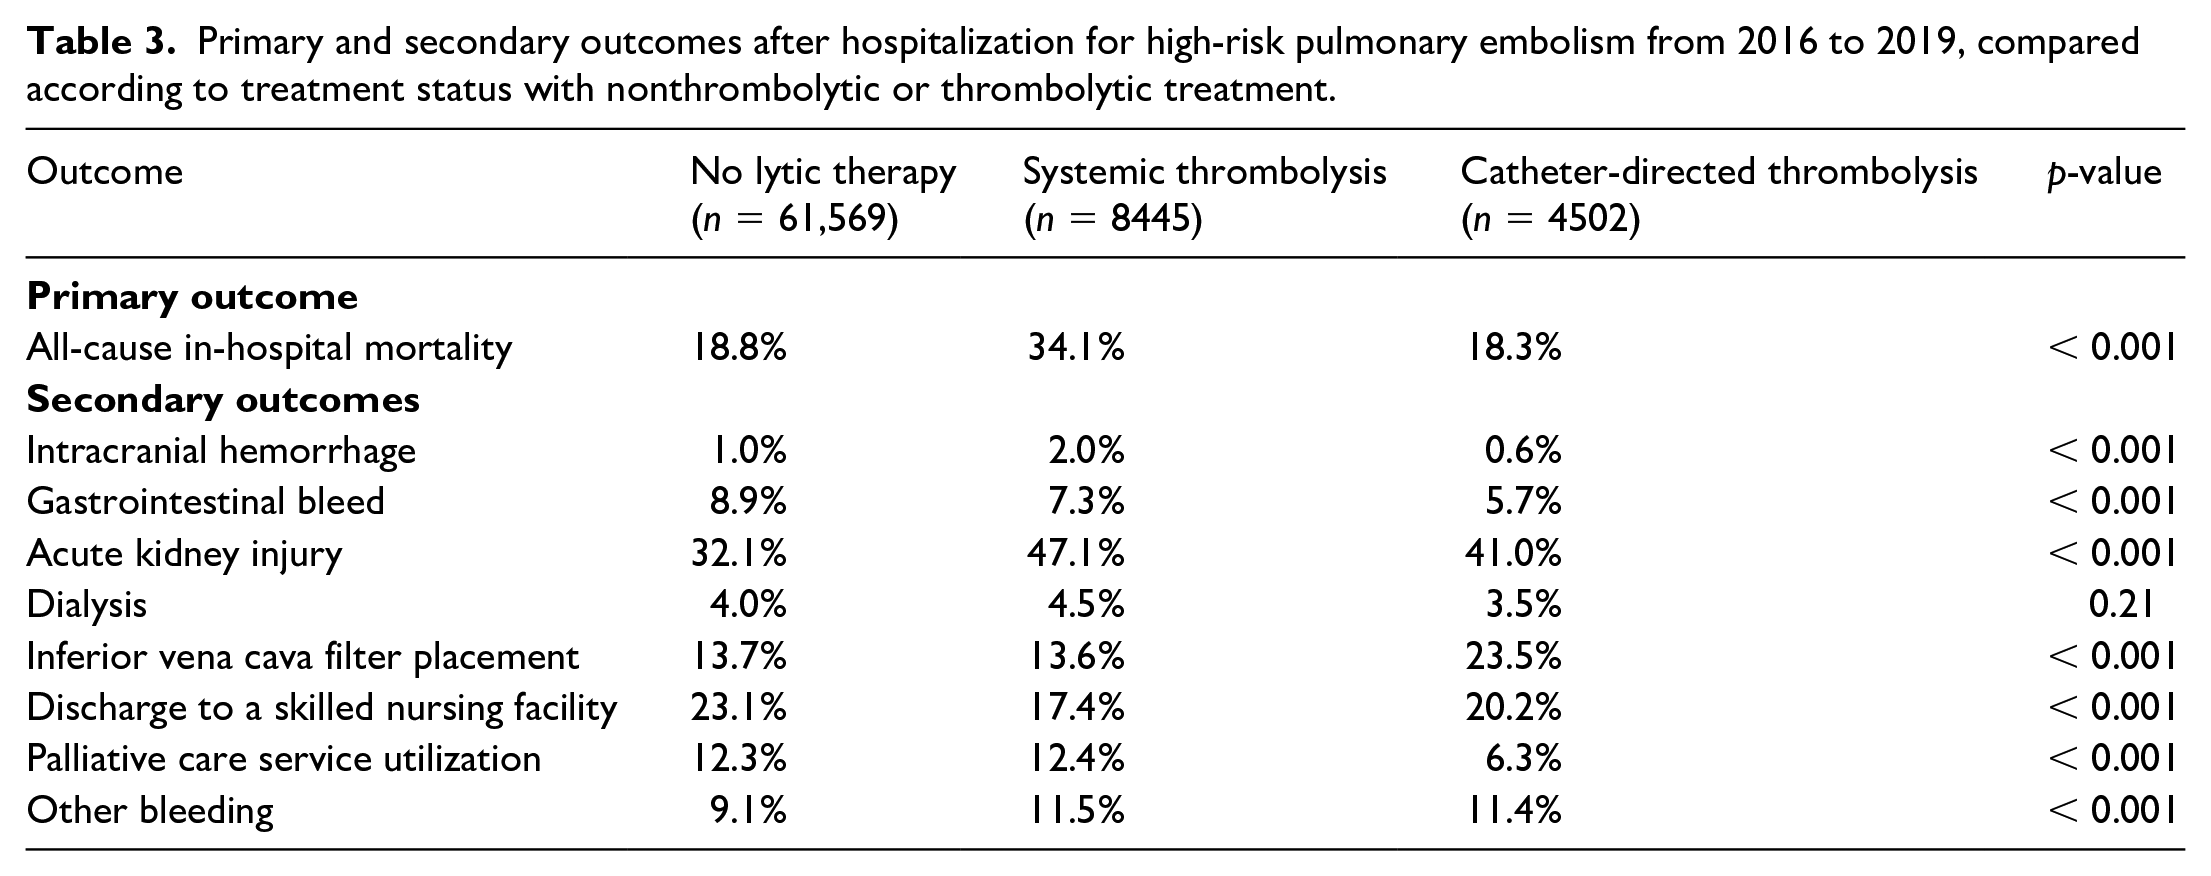
The unadjusted in-hospital mortality rate was different across the study cohort: NLT, ST, and CDT (18.8%, 34.1%, and 18.3%; p < 0.001), After multivariable adjustment, the odds ratio of in-hospital death was lower for CDT relative to ST (aOR 0.43; 95% CI 0.38–0.49; p < 0.0001). The rate of primary and secondary study outcomes is summarized in Table 3.
Primary and secondary outcomes after hospitalization for high-risk pulmonary embolism from 2016 to 2019, compared according to treatment status with nonthrombolytic or thrombolytic treatment.
Secondary outcomes
The unadjusted intracranial bleed and gastrointestinal bleed rates were different across the study cohort: NLT, ST, and CDT (1.0%, 2.0%, and 0.6%; p < 0.001), respectively,
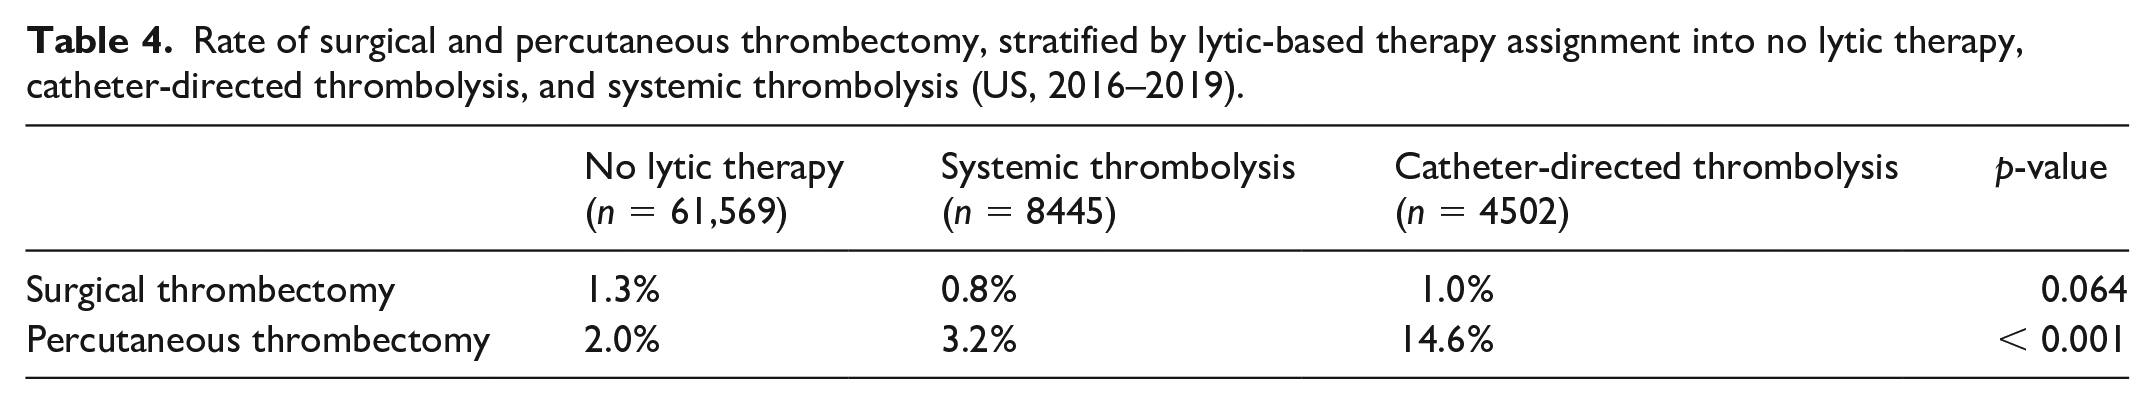
After multivariable adjustment, CDT was associated with a lower incidence rate of intracranial bleed ST (aOR 0.32; 95% CI 0.18–0.55; p < 0.0001), gastrointestinal bleed (aOR 0.78; 95% CI 0.62–0.98; p < 0.0001), and palliative care service utilization (aOR 0.47; 95% CI 0.38–0.58; p < 0.001) relative to ST. CDT was associated with similar rates of dialysis (aOR 0.802; 95% CI 0.58–1.11; p = 0.18) and other bleeding (aOR 0.72; 95% CI 0.59–0.88; p < 0.0001) relative to ST. However, the use of CDT was associated with a higher incidence of procedural access bleeding (aOR 1.99; 95% CI 1.45–2.73; p < 0.001) and inferior vena cava filter placement (aOR 1.93; 95% CI 1.66–2.25; p < 0.001) relative to the ST cohort. CDT utilization was associated with a lower incidence of palliative care service utilization (aOR 0.47; 95% CI 0.38–0.58; p < 0.001) compared with the ST cohort. Figure 2 demonstrates the adjusted odds of in-hospital primary and secondary outcomes of CDT compared to the ST cohort. The rate of surgical and percutaneous thrombectomy, stratified by lytic-based therapy assignment into NLT, ST, and CDT is summarized in Table 4; CDT was associated with the highest rate of percutaneous thrombectomy at 14.6%, relative to the ST 3.2% and NLT 2.0%.
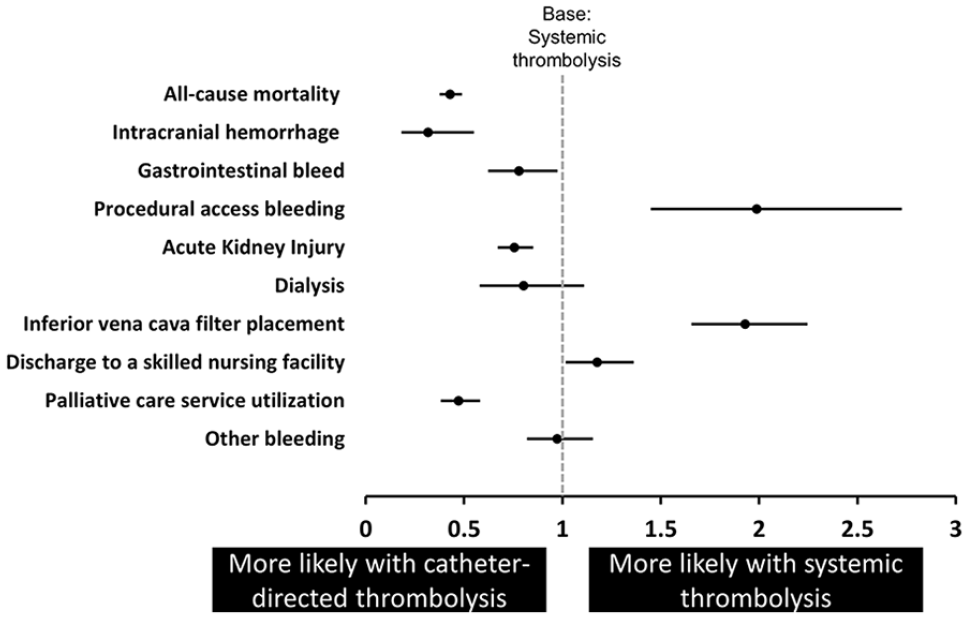
Adjusted odds ratio of in-hospital primary and secondary outcomes for patients admitted for high-risk PE and received catheter-directed thrombolysis compared with patients who received systemic thrombolysis.
Rate of surgical and percutaneous thrombectomy, stratified by lytic-based therapy assignment into no lytic therapy, catheter-directed thrombolysis, and systemic thrombolysis (US, 2016–2019).
Readmission
Among 74,516 patients primarily admitted for high-risk PE from 2016 to 2019, 18,822 were excluded based on admission from October to December, and another 3423 were excluded for hospitalizations that occurred in a state other than the patient’s primary residence. The final cohort included 52,271 patients who were available for readmission analysis, including primary and secondary causes of readmission (Table 5).
Diagnoses associated with 90-day readmission after hospitalization for high-risk pulmonary embolism, stratified by lytic-based therapy assignment into no lytic therapy, catheter-directed thrombolysis, and systemic thrombolysis (US, 2016–2019).
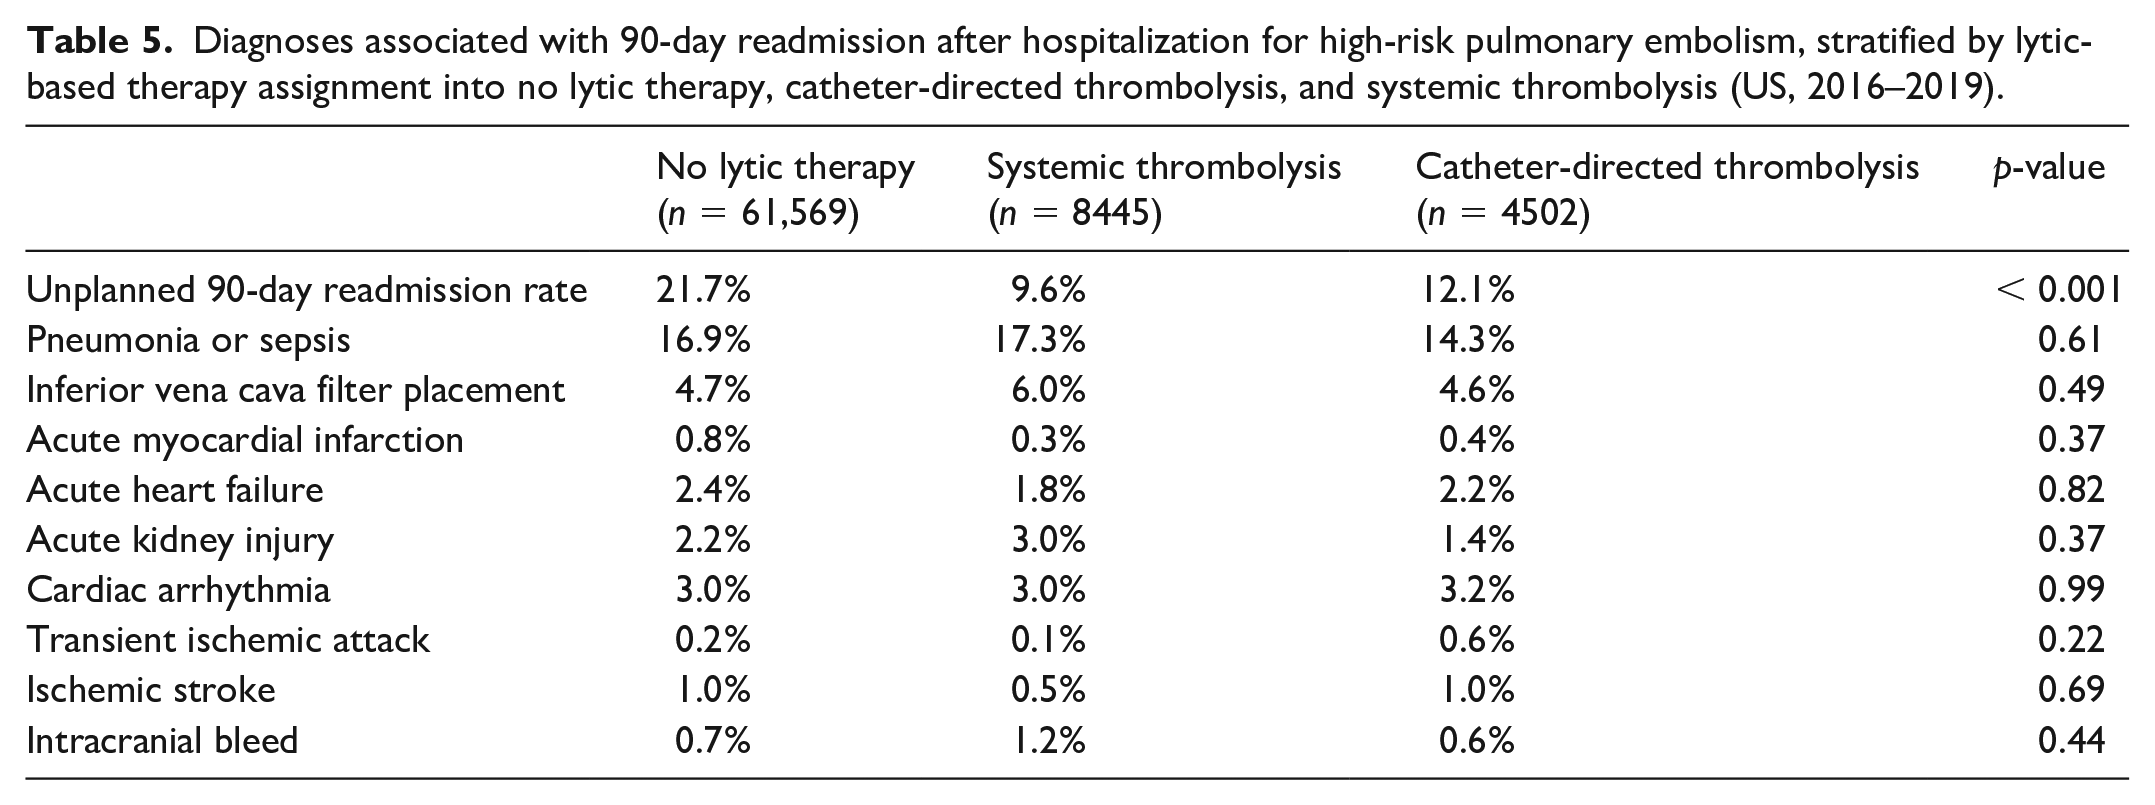
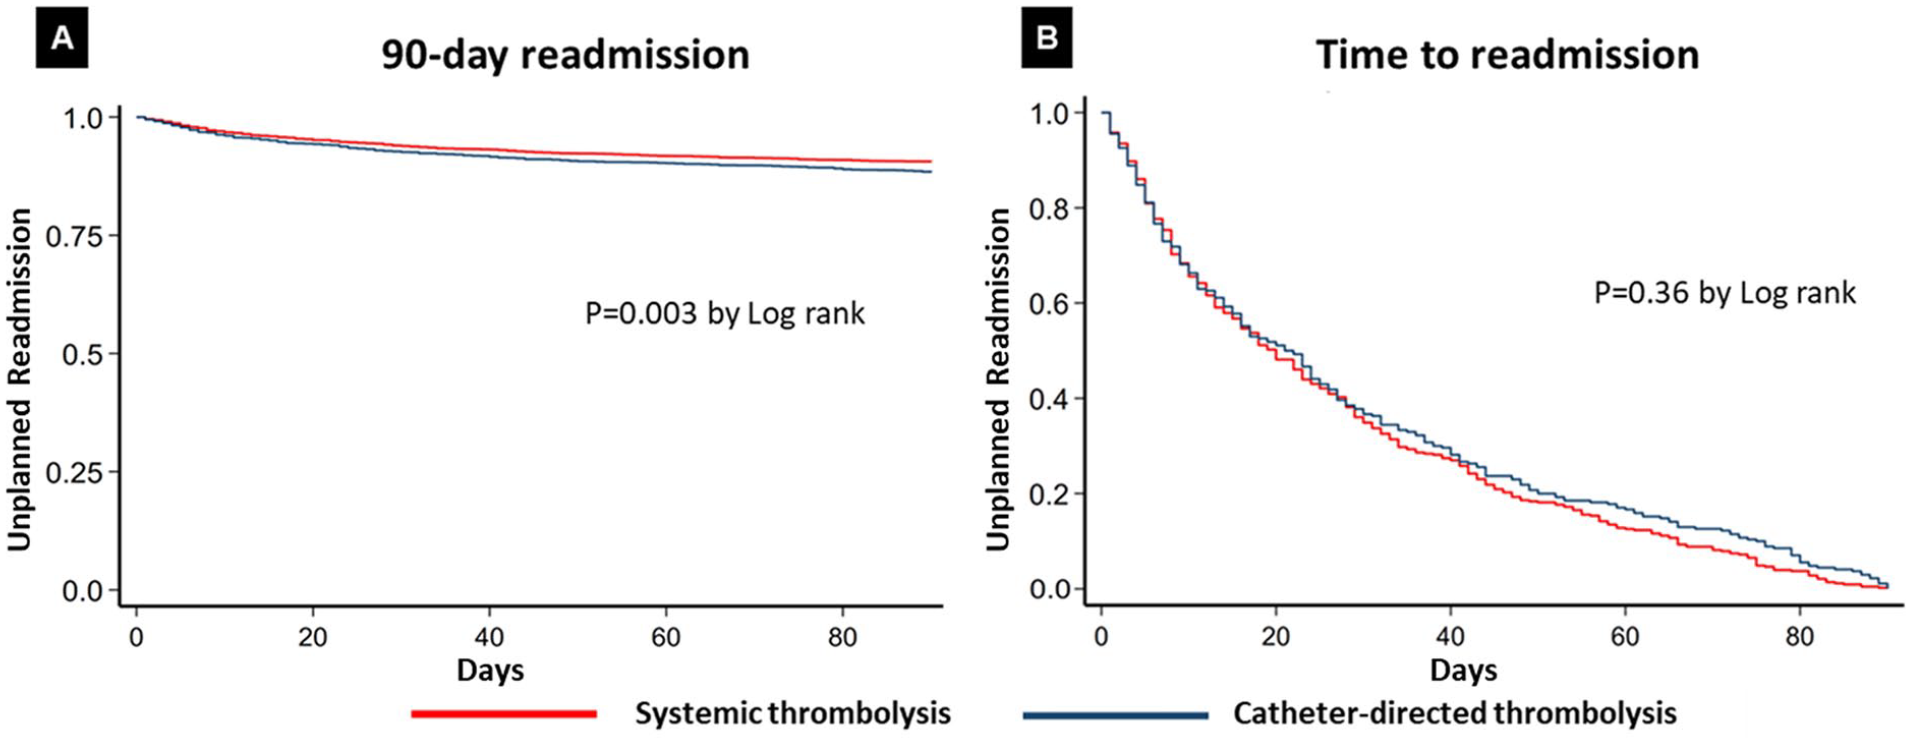
The 90-day unplanned readmission rate was different across the study cohort for NLT, ST, and CDT (21.7%, 9.6%, and 12.1%, respectively; p < 0.001). After multivariable adjustment, CDT was associated with a higher incidence of unplanned 90-day readmission rates relative to ST (aOR 1.32; 95% CI 1.10–1.57; p < 0.001). However, CDT was associated with a similar incidence of transient ischemic attack (aOR 2.6; 95% CI 0.4–16.29; p = 0.32), ischemic stroke (aOR 1.37; 95% CI 0.21–9.09; p = 0.74), and intracranial bleed (aOR 0.437; 95% CI 0.065–2.79; p = 0.37), compared with the ST cohort. Figure 3 shows the adjusted analysis for the principal diagnoses associated with subsequent readmission within 90 days of index hospitalization for CDT compared to ST.
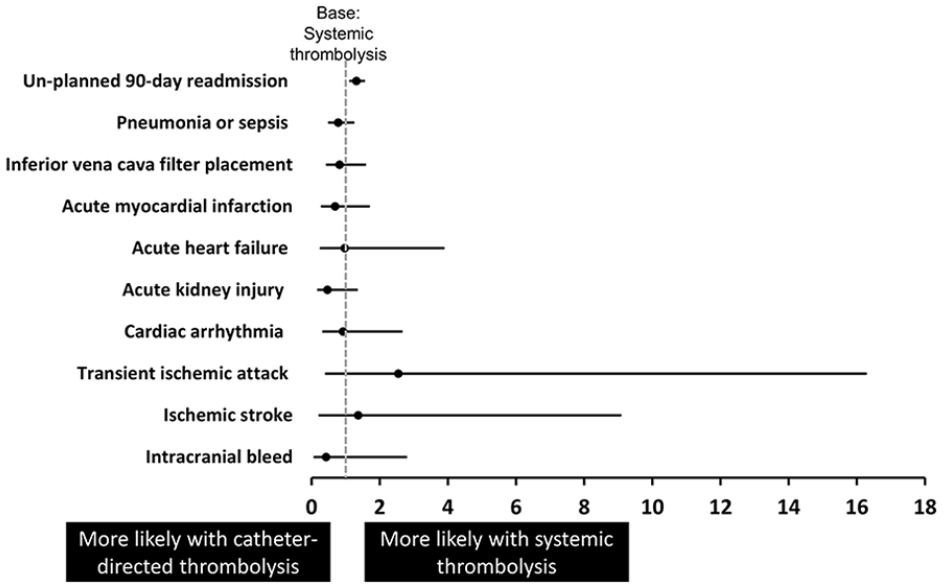
Adjusted odds ratio for unplanned 90-day readmission, and primary hospital complications associated with the readmission.
Time to readmission was similar between the CDT and ST groups (21 [IQR 7.44] days vs 20 [IQR 8.42] days, respectively; p = 0.12, log-rank). Figure 4 demonstrates the time to readmission of the CDT and ST cohorts.
Hospital and insurance characteristics
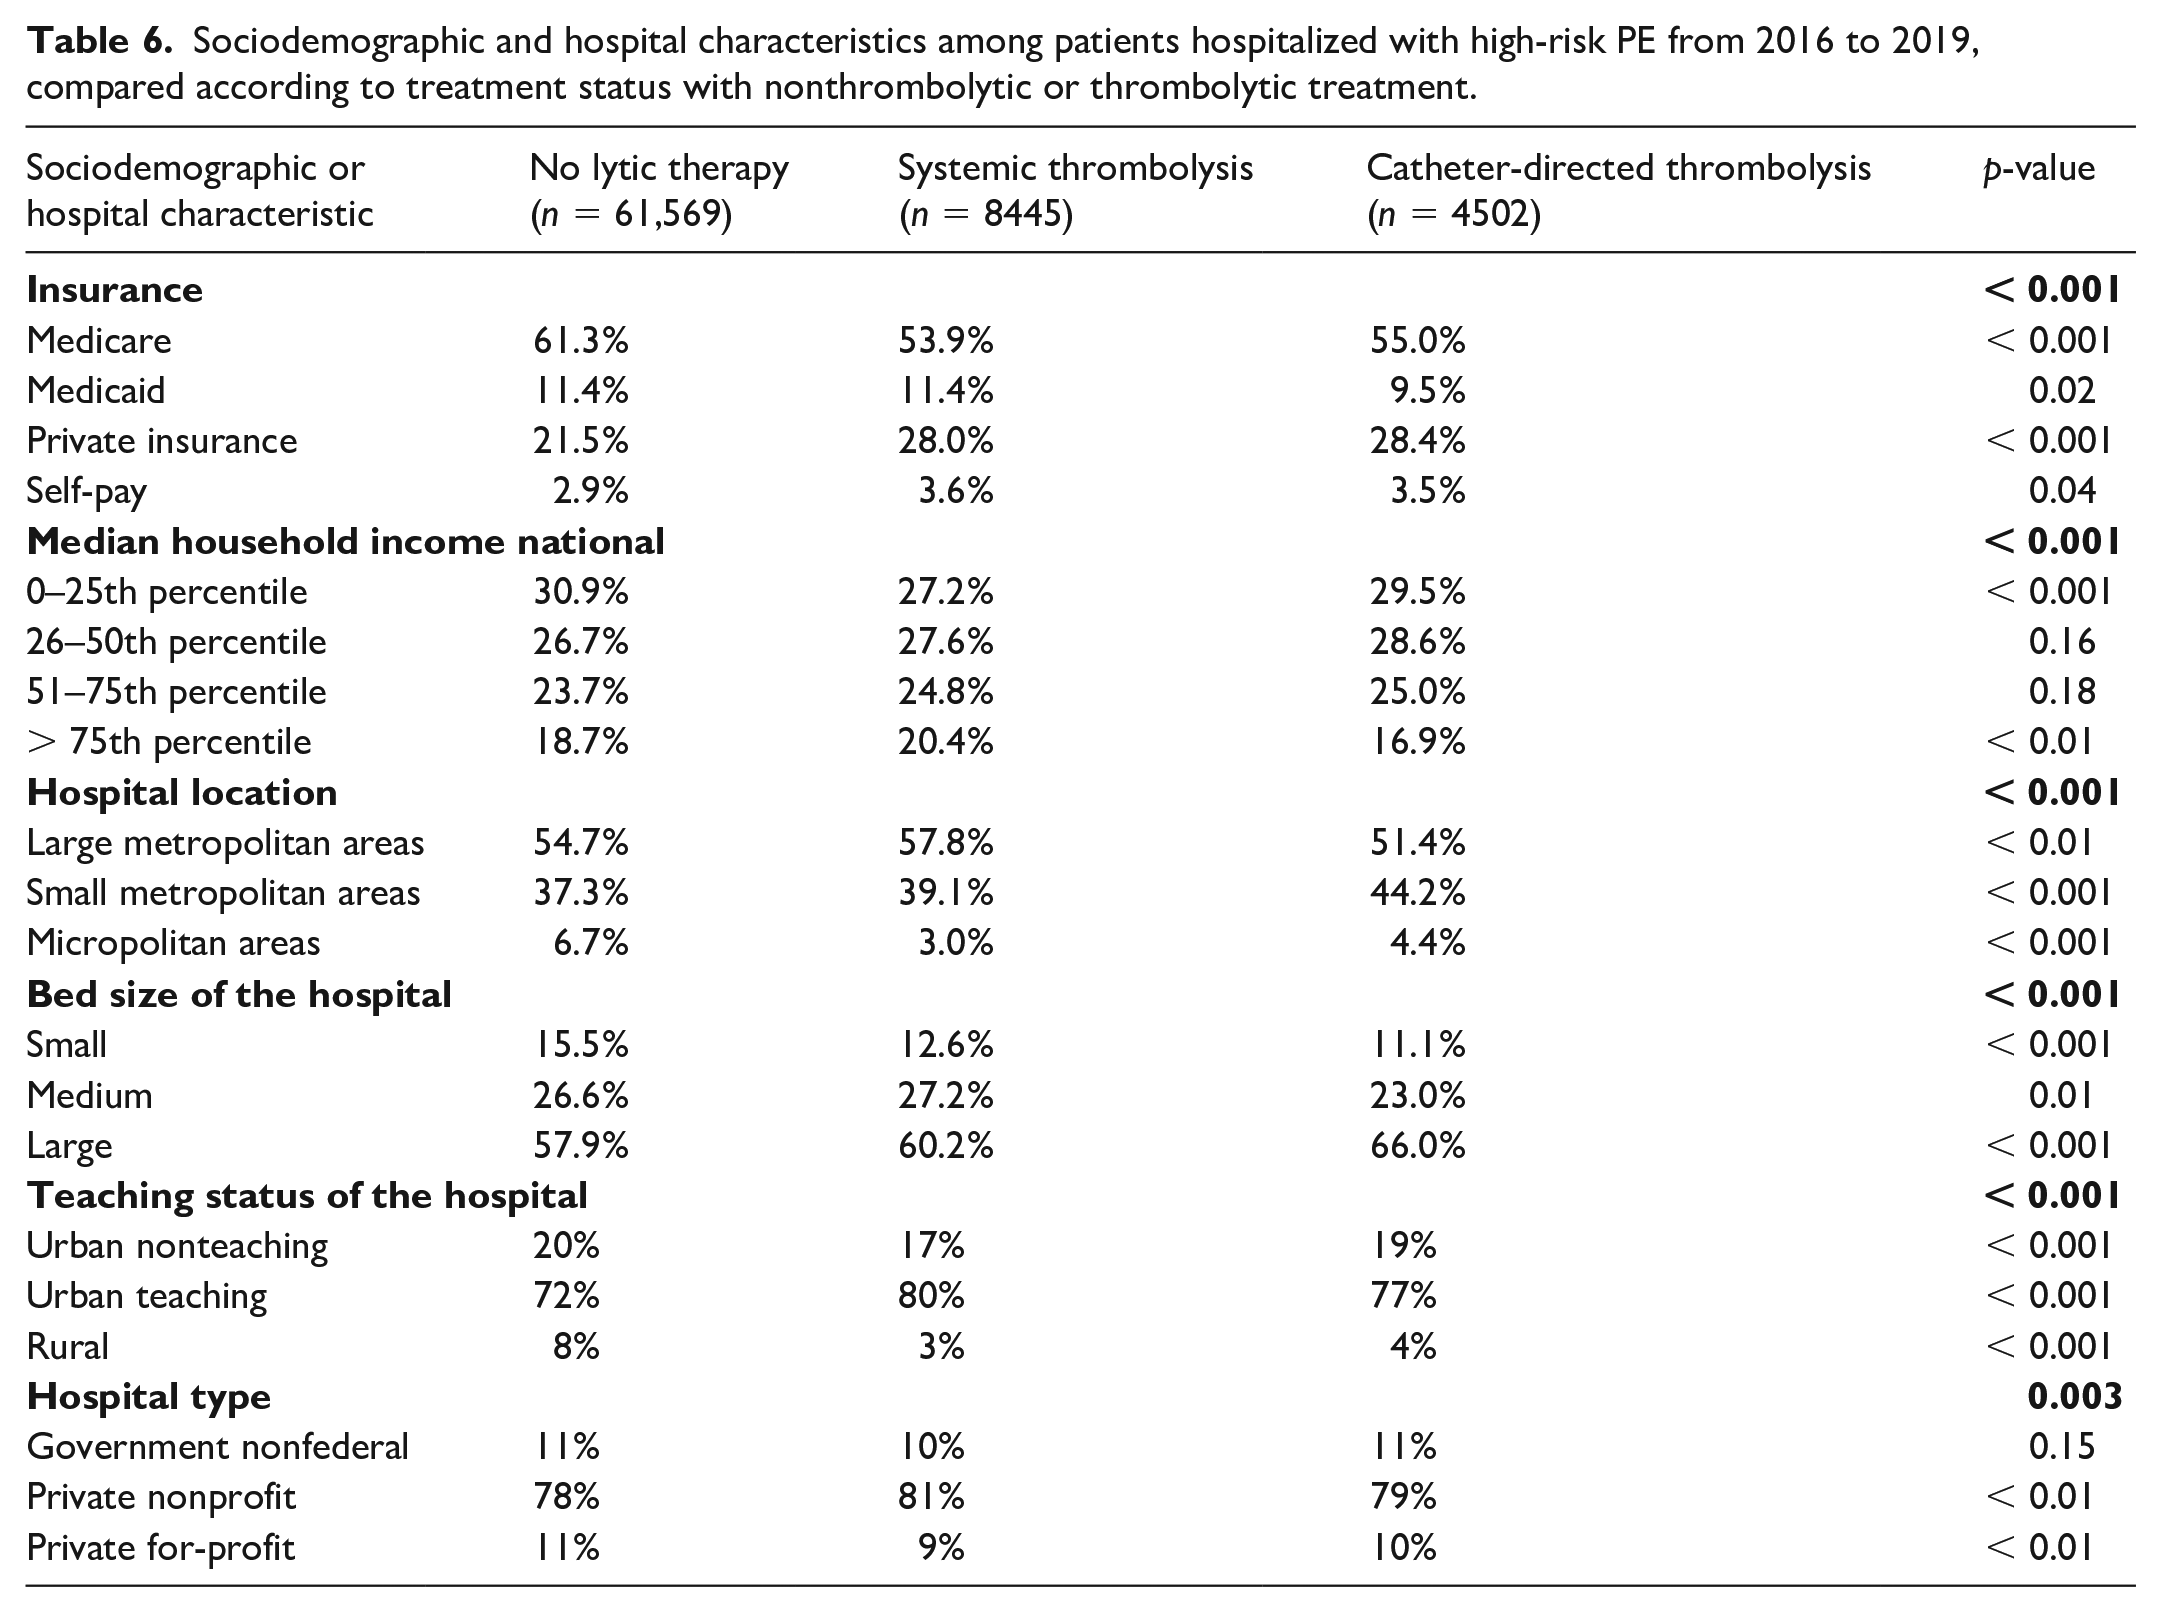
Hospital and socioeconomic characteristics are summarized in Table 6. Lytic-based treatment assignments differed based on hospital size, teaching status, and location. Patients insured by Medicare and those presenting to rural hospitals were observed most frequently among the NLT cohort.
Sociodemographic and hospital characteristics among patients hospitalized with high-risk PE from 2016 to 2019, compared according to treatment status with nonthrombolytic or thrombolytic treatment.
Temporal trends of lytic-based therapy assignment for high-risk PE, 2016–2019
Among patients with high-risk PE (n = 95,078), the frequency of patients who received NLT tended to decrease (from 85.0% in 2016 to 81.5% in 2019; Ptrend = 0.09), whereas the frequency of ST tended to increase (from 10.3% in 2016 to 12.1% in 2019; Ptrend = 0.07), and the frequency of CDT utilization tended to increase (from 4.7% in 2016 to 6.5% in 2019; Ptrend = 0.14). Temporal trends of lytic-based therapy assignment are demonstrated in Figure 5.
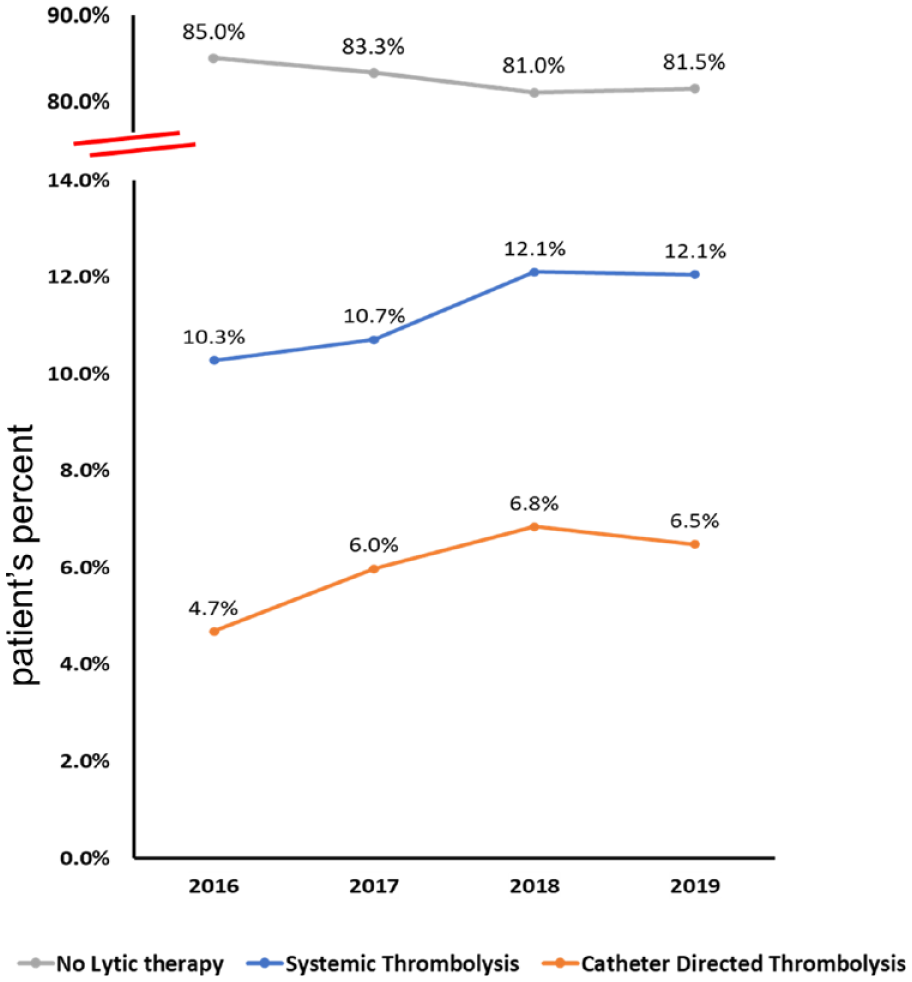
Hospitalization for high-risk PE (n = 95,078), 2016 to 2019. The frequency of patients who received no lytic-based therapy tended to decrease (from 85.0% in 2016 to 81.5% in 2019; Ptrend = 0.09), whereas the frequency of catheter-directed thrombolysis utilization tended to increase (from 4.7% in 2016 to 6.5% in 2019; Ptrend = 0.14), and the frequency of ST tended to increase (from 10.3% in 2016 to 12.1% in 2019; Ptrend = 0.07).
Temporal trends of high-risk PE Features presentation
Among high-risk PE features, the frequency of patients who presented with shock increased (from 19.6% in 2016 to 25.4% in 2019; Ptrend = 0.005), whereas the proportion of patients who suffered from cardiac arrest (from 15.1% in 2016 to 14.5% in 2019; Ptrend = 0.191), hypotension (from 47.2% in 2016 to 48.2% in 2019; Ptrend = 0.205), or were mechanically ventilated (from 26.7% in 2016 to 27.2% in 2019; Ptrend = 0.736) remained the same. Vasopressor utilization increased (from 2.6% in 2016 to 5.0% in 2019; Ptrend = 0.050); however, blood transfusion utilization decreased (from 26.3% in 2016 to 22.6% in 2019; Ptrend = 0.036). The distribution of high-risk features and temporal trends of patients presenting with high-risk PE are shown in Figure 6.
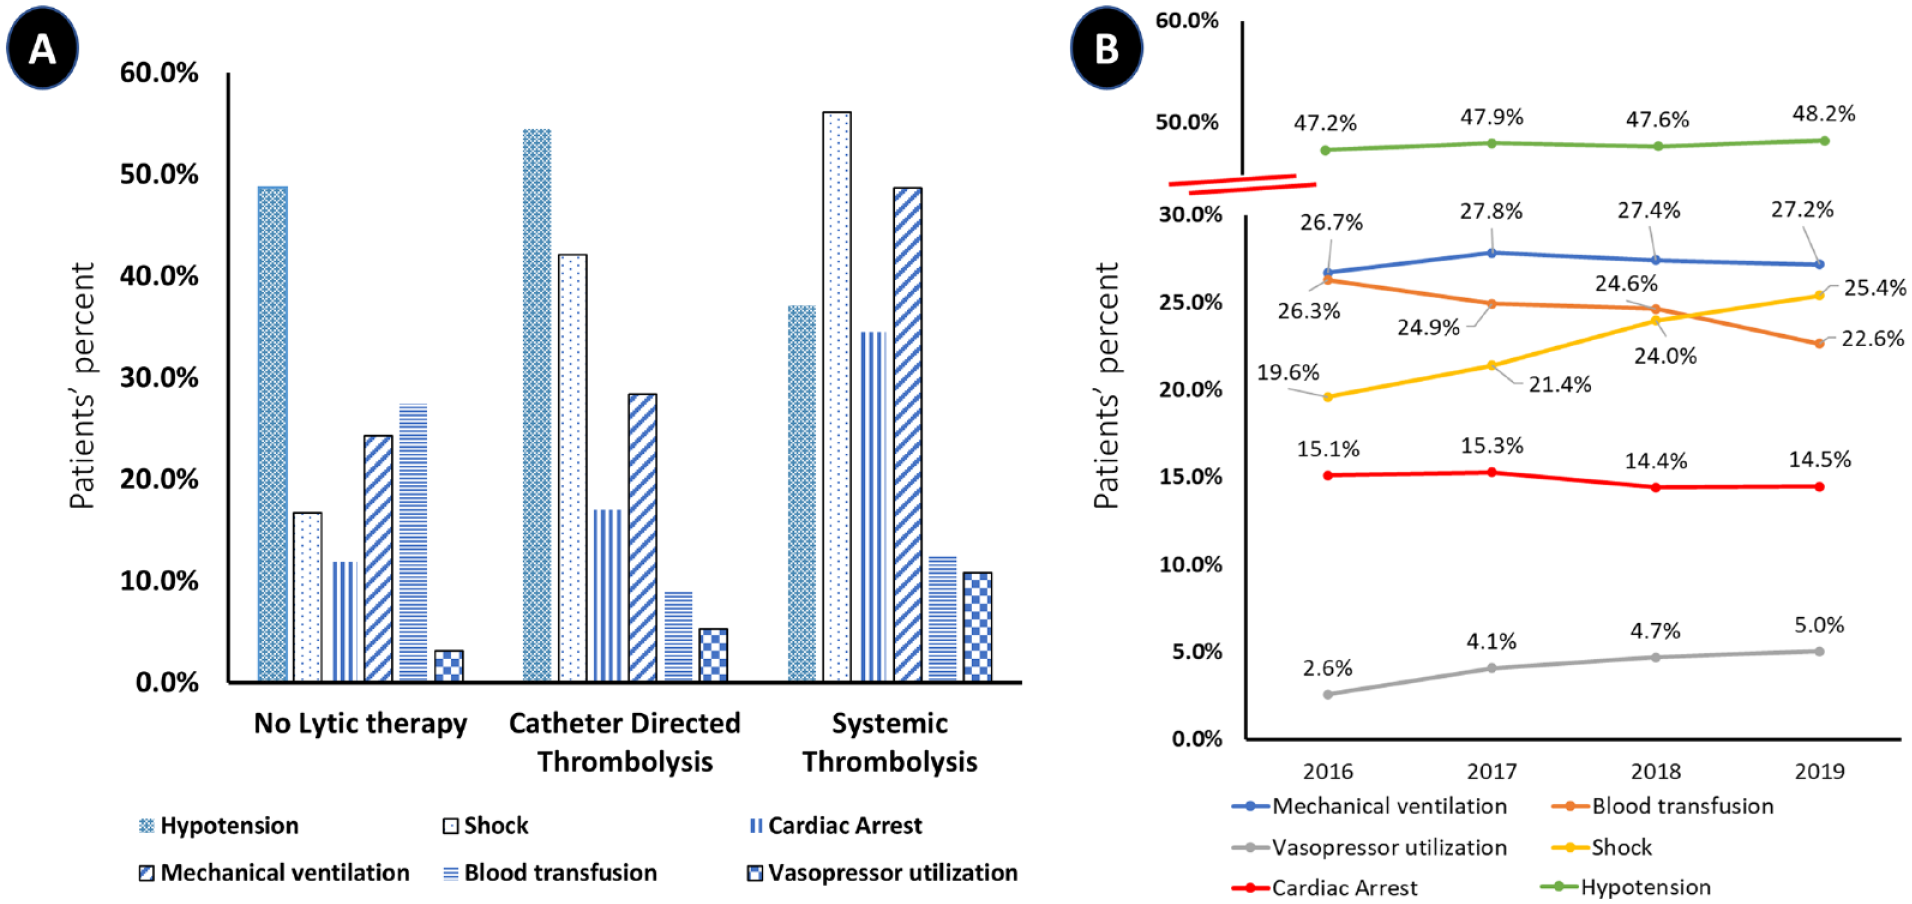
Distribution of high-risk features and temporal trends of patients presenting with high-risk PE stratified by lytic-based therapy assignment into no lytic therapy, catheter-directed thrombolysis, and systemic thrombolysis (US, 2016–2019).
Resource utilization
Index hospital length of stay was longer in the group of patients that received CDT relative to ST (5 [IQR 3, 10] days vs 5 [IQR 3, 9] days, p < 0.001). Total charges of the index admission were higher in the group of patients that received CDT relative to ST ($24,358.0 [IQR 16,889, 38,765] vs $116,615.0 [IQR 9388.5, 29,323.5], p = 0.01.) The use of CDT was associated with a higher incidence of discharge to a skilled nursing facility (aOR 1.18; 95% CI 1.02–1.36; 0.029) compared with the ST cohort.
Discussion
In this nationwide analysis, including 74,516 hospitalized patients with high-risk PE, we evaluated the outcomes of patients who received NLT, ST, and CDT. The study findings included (1) there was a significant difference in baseline patient characteristics; also, hospital size and location were associated with differences in lytic-based therapy assignments. (2) The frequency of patients who presented with shock increased, whereas the proportion of patients who suffered from cardiac arrest, hypotension, and were mechanically ventilated remained the same. The proportion of patients who received vasopressor utilization increased. However, blood transfusion utilization decreased over the study years. (3) The NLT cohort was more likely to be older, be women, and to have cancer, chronic obstructive pulmonary disease, and end-stage renal disease; they were more likely to present with hypotension and less likely to have shock or cardiac arrest, relative to the patients who received lytic-based therapy. (4) However, the ST cohort was more likely to have shock and cardiac arrest relative to the NLT and ST cohorts. (5) Among high-risk PE patients, there was an upward trend in the proportion of patients receiving ST or CDT and a downward trend to not administer lytic therapy. CDT was associated with higher rates of extracorporeal membrane oxygenation, mechanical ventilation, and higher rates of IVC filter placement. (6) CDT was associated with a lower risk of in-hospital mortality and intracranial bleeding compared to ST. (7) CDT was associated with higher rates of 90-day all-cause readmission. (8) Patients who received CDT were more likely to receive percutaneous mechanical thrombectomy relative to NLT and ST.
Hemodynamic instability in acute PE is associated with poor prognosis,1,14,15 but the discovery and use of thrombolysis has been lifesaving, with improvements in mortality and morbidity; however, it is associated with a significant increase in life-threatening bleeding events such as intracranial bleeding.16,17
CDT techniques represent an opportunity for targeted thrombolysis of PE, delivering a smaller yet more concentrated dose of thrombolytic drugs. However, the use of CDT is limited to a small number of studies with inadequate power to estimate safety and efficacy outcomes. To date, there are no randomized trials to investigate the comparative effectiveness of CDT and ST in high-risk PE patients which explore potential differences in short-term mortality or bleeding risk, or late outcomes of readmissions or quality of life.
In our study, the in-hospital mortality associated with NLT, ST, and CDT were 18.1%, 34.1%, and 18.3%, respectively. Notably, these results are lower compared to a contemporary analysis of high-risk PE from the Pulmonary Embolism Response Team Consortium registry. 3 In that analysis, high-risk PE was associated with a mortality rate of 40% within 90 days, although the majority of mortality risk manifested during the index hospitalization. 3 Advanced therapy use, including ST, CDT, and mechanical thrombectomy, among others, was associated with a reduction in mortality risk by 61%; the lower mortality rate in our study could be secondary to the therapeutic interventions becoming more refined and accessible over the years. Another study examined the national mortality trends and outcomes of high-risk PE in the USA, and demonstrated that the rate of in-hospital mortality in high-risk PE decreased from 48.1% in 2016 to 38.9% in 2019; however, they only included patients who had cardiogenic shock or those who received vasopressors. 18
Another study, by Geller et al., who examined the outcomes of lytic-based therapies in patients with PE in a private insurance database, demonstrated that patients who underwent CDT had lower high-risk features relative to ST; however, notably, patients who received lytic-based therapies were younger, with a mean age of 57 years old 19 compared to our study with a mean of 64 years old, which may point toward clinician tendency to treat higher-risk patients with ST relative to CDT.
The overall benefit of thrombolysis therapy must be weighted to the risk of bleeding, as most trials and studies excluded patients with an increased risk of bleeding or ICH.20,21 Historically, lytic-based therapies have been associated with a high risk of bleeding, reaching up to 10–20%, including 1–2% of patients suffering from intracranial bleed.3,5,20–22 It should be noted that most patients with a high risk of bleeding were excluded from such trials. Given the many treatment confounders in this real-world analysis, it remains uncertain whether the lower mortality rates associated with CDT could be attributed to the overall lower doses of lytic used as a surrogate for potentially lower bleeding risk or related to the systemic thrombolytic group being a clinically sicker population relative to CDT at presentation, with a shock rate of 56.1% and 42.1%, and cardiac arrest rate of 34.5% and 17.0%, respectively. There is likely selection bias of treating the most compromised patients with ST given the potential efficiency at which therapy can be delivered. However, in the circumstance of high-risk PE with cardiac arrest, if there is no opportunity to circulate the thrombolytic through the pulmonary tree due to pulmonary artery embolic occlusion, then both therapies may be less effective. In our study, ICH occurred among NLT, ST, and CDT (1.0%, 2.0%, and 0.6%, respectively). These results suggest the opportunity to further improve clinical care with prospective, randomized analysis in the high-risk population comparing CDT and ST, and potentially comparing to nonlytic-based thrombectomy, to better understand the benefits of acute and long-term safety and efficacy.
The length of stay was longer for the CDT cohort compared to the ST cohort. However, we observed a high incidence of 90-day readmission in the NLT cohort (21.7%), and a higher rate in CDT relative to ST (12.1% vs 9.6%). One important finding of our analysis is that patients’ insurance status, hospital size, and teaching status may play a significant role in the choice of the treatment assignment; for example, 21.5% of the high-risk PE patients who received NLT had private insurance, whereas 28.0% and 28.4% in the ST and CDT cohorts had private insurance. Similarly, for hospital characteristics and hospital size, 8% of the high-risk PE patients who received NLT presented to rural hospitals compared with 3% and 4% in the ST and CDT cohorts, and 57.9% of the high-risk PE patients who received NLT presented to large bed-size hospitals compared with 60.2% and 66.0% in the ST and CDT cohorts. Higher rates of utilization of lytic-based therapies in larger hospitals may be secondary to the higher likelihood of pulmonary embolism response teams (PERTs) in larger centers, which have been shown to increase the rates of advanced therapies for PE.23,24
Study limitations
This study has several important limitations. First, the use of administrative claims codes is subject to inaccurate coding for the primary and secondary admission diagnoses used in this analysis. Notably, the AHRQ regularly implement quality control measures to help ensure the integrity and reliability of the NRD data. Second, treatment selection bias, as noted above, may play a substantial role in treatment choice. The availability and proficiency of invasive treatment for PE are also site-specific and likely impact delivery and outcomes after such treatments. Third, this analysis was limited by a lack of patient-level risk stratification, including imaging assessment of right ventricular function, which is commonly used in the decision-making of PE treatment in contemporary practice. The NRD also lacks data on timing of administration of the systemic thrombolysis (i.e., emergency department, floor, or intensive care unit), fibrinolytic doses or duration of the infusion, duration of the symptoms, functional status of patients, and postdischarge medications such as anticoagulation. Fourth, the inability to capture out-of-hospital mortality and only short-term outcomes were tracked as allowed by the database. Fifth, there are multiple unmeasured confounders that may impact the outcomes after ST and CDT treatment that render these results as hypothesis-generating only. Sixth, resource utilization results may be confounded by the higher survival rates of the patients who received CDT relative to ST. Nevertheless, we hope these results spur additional interest in the design of future randomized clinical trials that would compare catheter-based therapies to ST, which is the current standard of care.
Conclusions
Among a large, contemporary, US cohort with high-risk PE, over 80% of patients did not receive any form of thrombolysis, though such patients also experienced the greatest rates of readmissions. When lytics were utilized, ST was associated with higher adjusted rates of in-hospital mortality and bleeding compared to CDT. As rates of lytic-based treatments did not significantly change over time, these findings highlight opportunities to understand the implementation of lytic and nonlytic-based treatments to improve outcomes for those presenting with high-risk PE.
Footnotes
Data availability statement
The National Readmission Database (NRD) is a publicly available database that can be purchased through the HCUP Central Distributor.
Declaration of conflicting interests
Dr Bunte reports receiving institutional research funding from Inari Medical Inc. and Janssen Pharmaceuticals Inc., and is a consultant to Inari Medical, Shockwave Medical, and Abbott Vascular. The other authors have nothing to disclose.
Funding
The authors received no financial support for the research, authorship, and/or publication of this article.