
Abstract
Introduction:
Peripheral artery disease (PAD) is a common progressive atherosclerotic disease associated with significant morbidity and mortality in the US; however, data regarding PAD-related mortality trends are limited. This study aims to characterize contemporary trends in mortality across sociodemographic and regional groups.
Methods:
The Centers for Disease Control and Prevention Wide-Ranging OnLine Data for Epidemiologic Research (CDC WONDER) was queried for data regarding PAD-related deaths from 2000 to 2019 in the overall sample and different demographic (age, sex, race/ethnicity) and regional (state, urban–rural) subgroups. Crude and age-adjusted mortality rates (CMR and AAMR, respectively) per 100,000 people were calculated. Associated annual percentage changes (APC) were computed using Joinpoint Regression Program Version 4.9.0.0 trend analysis software.
Results:
Between 2000 and 2019, a total of 1,959,050 PAD-related deaths occurred in the study population. Overall, AAMR decreased from 72.8 per 100,000 in 2000 to 32.35 per 100,000 in 2019 with initially decreasing APCs followed by no significant decline from 2016 to 2019. Most demographic and regional subgroups showed initial declines in AAMRs during the study period, with many groups exhibiting no change in mortality in recent years. However, men, non-Hispanic (NH) Black or African American individuals, people aged ⩾ 85 years, and rural counties were associated with the highest AAMRs of their respective subgroups. Notably, there was an increase in crude mortality rate among individuals 25–39 years of age from 2009 to 2019.
Conclusion:
Despite initial improvement, PAD-related mortality has remained stagnant in recent years. Disparities have persisted across several demographic and regional groups, requiring further investigation.
Introduction
Peripheral artery disease (PAD) is a common manifestation of atherosclerotic disease associated with substantial cardiovascular mortality and limb morbidity.1–3 Approximately 10 million United States (US) adults have PAD, and diagnostic challenges, such as asymptomatic disease in greater than 50% of patients, results in underdiagnosis and undertreatment.2,4 Specifically, PAD is associated with an increased risk for developing heart failure, coronary artery disease (CAD), cerebrovascular disease (CVD), and critical limb ischemia, as well as an overall two- to threefold increase in 5 to 10-year mortality.2,5–7
Despite these implications, few studies have examined temporal mortality trends of PAD in the US. A 2020 study examined incidence and mortality from 1990 to 2017 using Global Burden of Disease study data. 8 They found 125.7% and 131.2% increases in mortality for US men and women, respectively, over the study period. 8 However, to our knowledge, there are no contemporary studies examining sociodemographic and regional trends in PAD-related mortality in the US. Thus, in this study we use a nationwide database of death certificates to conduct a comprehensive analysis of contemporary trends in PAD-related mortality, with stratification by sociodemographic and geographic groups.
Methods
Data source
The Centers for Disease Control and Prevention Wide-Ranging OnLine Data for Epidemiologic Research (CDC WONDER) database was utilized to extract deaths occurring within the US related to PAD. 9 The Multiple Cause of Death Public Use Record death certificates were studied to select PAD as a contributing or underlying cause of death. Several other recent studies have analyzed nationwide trends in mortality of other cardiovascular diseases using this database.10,11 Death certificates with PAD as an underlying or contributing cause of death were identified with International Classification of Diseases, 10th Revision, Clinical Modification codes (E10.5, E11.5, E12.5, E13.5, E14.5, I70.0–I70.2, I70.8–I70.9, I71.1–I71.6, I71.8–I71.9, I72.1–I72.4, I72.8–I72.9, I73.8–I73.9, I74.0, I74.1–I74.5, I74.8–I74.9, and I77.8–I77.9) in patients ⩾ 25 years of age. This study was exempt from local Institutional Review Board approval because the CDC WONDER database contains public and anonymous data.
Data extraction
PAD-related deaths and population sizes were extracted, along with demographics (sex, race/ethnicity, and age), and regional information (urban–rural and state) from 2000 to 2019. Race/ethnicities were defined as non-Hispanic (NH) White, NH Black or African American, Hispanic or Latino, NH American Indian or Alaskan Native, and NH Asian or Pacific Islander patients. These race/ethnicity categories are defined within the CDC WONDER database and have previously been used in other studies from the CDC WONDER database.9,12 Age groups were defined as 25–39, 40–54, 55–69, 70–84, and 85+ years of age. The National Center for Health Statistics Urban–Rural Classification Scheme was used to divide the population into urban (large metropolitan area [population ⩾ 1 million], medium/small metropolitan area [population 50,000–999,999]) and rural (population < 50,000) counties per the 2013 US census classification. 13 The CDC WONDER’s Multiple Cause of Death data, based on death certificates, contains a single underlying primary cause of death with up to 20 secondary causes of death. Causes of death after 1999 are based on ICD-10 codes. 9 Number of deaths, crude death rates, age-adjusted death rates, and 95% CIs for death rates are provided per cause of death, place of residence, age, race, Hispanic ethnicity, gender, year, and place of death. 9 The data are based on death certificate information of US residents (excluding nonresidents [e.g. nonresident aliens, nationals living abroad, residents of Puerto Rico, Guam, the Virgin Islands, and other US territories] and fetal deaths) that is filed in the 50 states and the District of Columbia. 9 Underlying cause of death is selected for the conditions entered by the physician on the cause of death section of the death certificate. 9 In the current study, we considered PAD listed as an underlying or contributing cause of death to be a PAD-related death.
Statistical analysis
The crude mortality rate (CMR) and age-adjusted mortality rates (AAMR) were calculated. The CMRs were determined by dividing the number of related deaths by the corresponding US population of that year. AAMRs were calculated by standardizing the PAD-related deaths to the year 2000 US population. 14 The Joinpoint Regression Program (Joinpoint V 4.9.0.0, National Cancer Institute) was used to determine trends in CMR and AAMR using annual percent change (APC). 15 The Joinpoint program allows for identification of significant changes in CMRs or AAMRs over time by fitting log-linear regression models where significant temporal changes have occurred. APCs with 95% CIs for the CMR and AAMR were calculated at the identified line segments linking joinpoints using the Monte Carlo permutation test. APCs were considered increasing or decreasing if the slope describing the change in mortality was determined to be statistically significant using two-tailed t-testing. Statistical significance was set at p ⩽ 0.05. Patients with missing data in certain subcategories were not included in the study. For instance, patients with unknown age while identifying the 25-year-old and above age subgroup, were not included. Previous studies, in addition to a detailed ICD codes search within the database, were used to identify appropriate codes for utilization in the present study. 16
Results
Overall population
There was a total of 49,678,954 deaths, due to all causes, from 2000 to 2019. Between 2000 and 2019, a total of 1,959,050 PAD-related deaths occurred in the study population (online Supplemental Table 1). Overall, PAD was present in 3.94% of total death certificates. Of 1,886,077 PAD-related deaths with information available on location of death, 46% occurred within medical facilities, 30% occurred in nursing homes/long-term care facilities, 3% occurred in hospices, and 21% occurred at home (online Supplemental Table 2). The AAMR was 72.8 in 2000 to 32.35 in 2019 (online Supplemental Table 3). The overall AAMR decreased from 2000 to 2016. Between 2016 and 2019, the AAMR was stable (APC −0.8 [95% CI, −2.4 to 0.8]) (Figure 1).
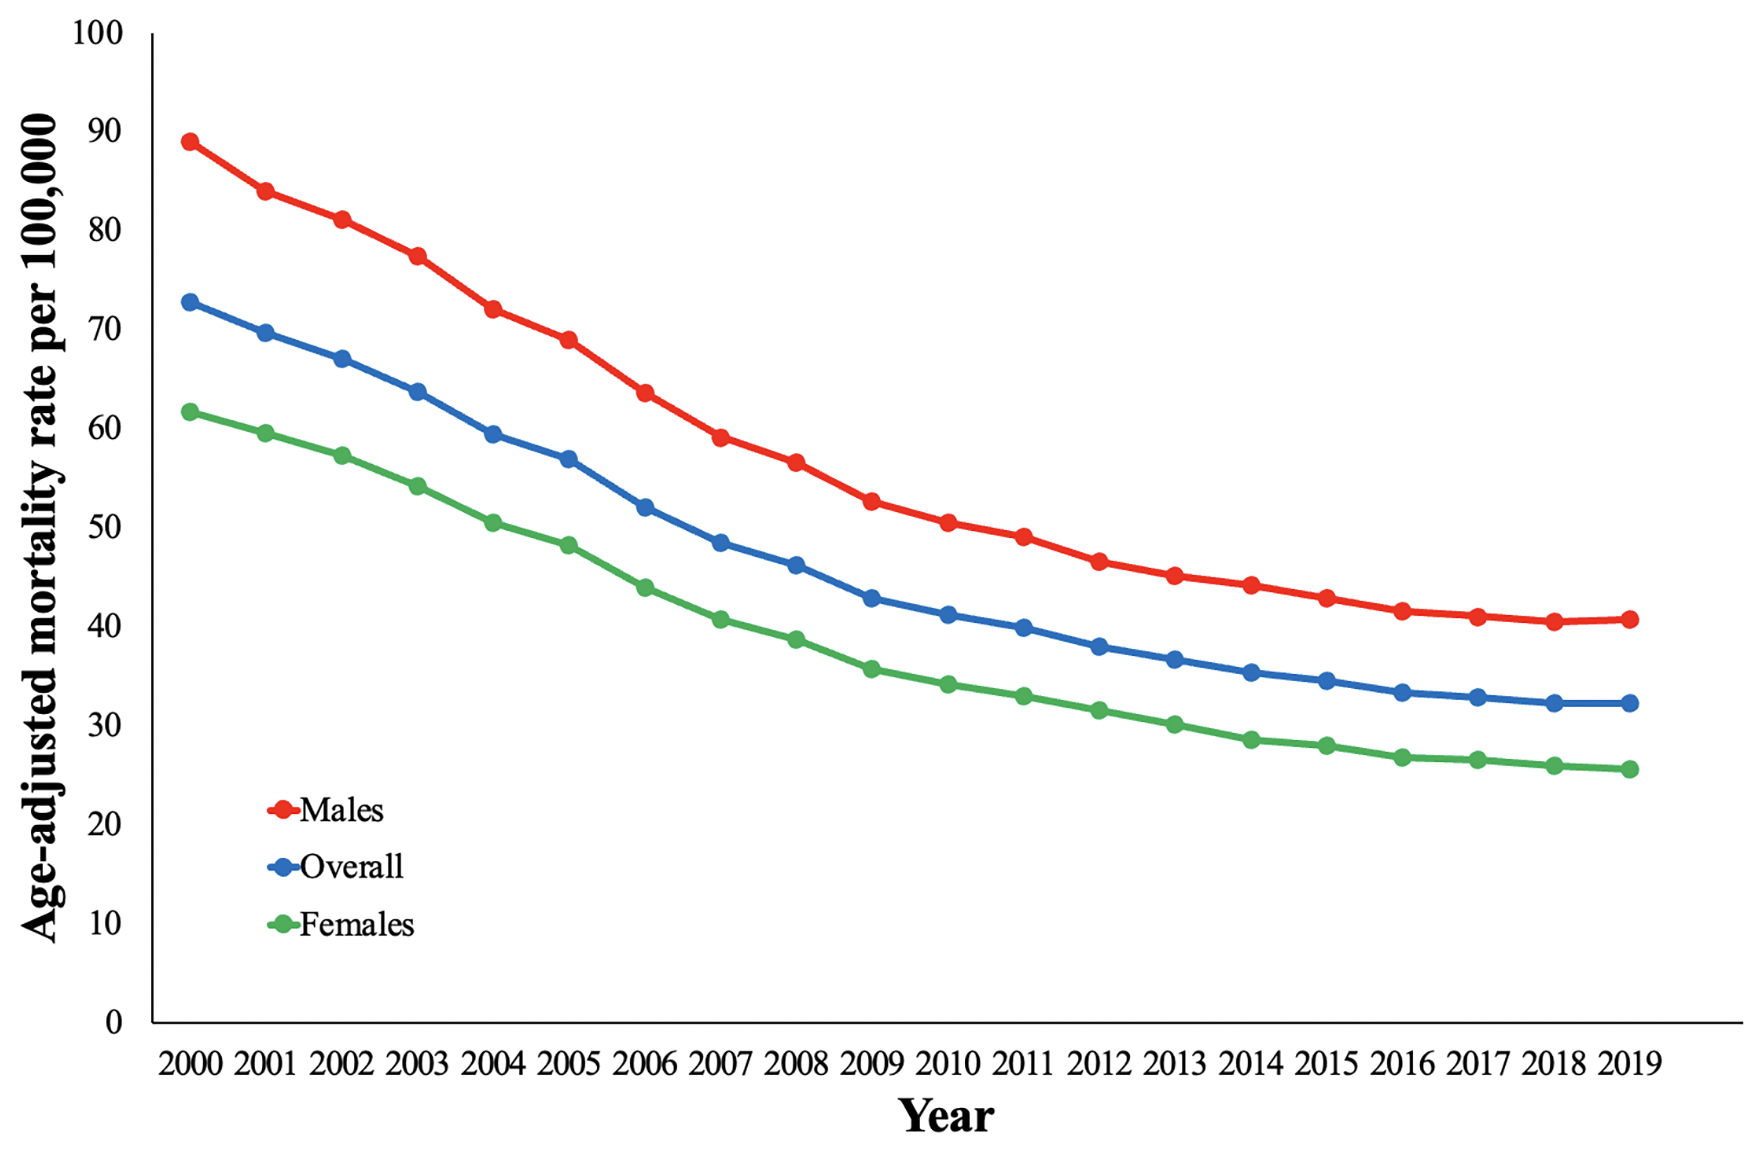
Overall and sex-stratified peripheral artery disease-related age-adjusted mortality rates and annual percentage change (APC) (95% CI) in the United States, 2000 to 2019.
Demographic patterns
Sex
Although declining in both sexes, men had higher AAMRs compared with women throughout the study period. Specifically, the AAMR in men was 89 in 2000 and 40.81 in 2019 (online Supplemental Table 3). The AAMR in women was 61.73 in 2000 to 25.62 in 2019. The AAMRs for men and women decreased for all segments identified between 2000 and 2016. Notably, both men and women had stable AAMRs from 2016 to 2019 (APC −0.5 [95% CI, −2.2 to 1.2] and APC −1.4 [95% CI, −3.2 to 0.4], respectively) (Figure 1).
Race/ethnicity
When stratified by race/ethnicity, AAMRs were highest among NH Black or African American people followed by NH American Indian or Alaska Native, NH White, Hispanic or Latino, and NH Asian or Pacific Islander (online Supplemental Table 4). The AAMR for NH Black or African American, NH American Indian or Alaska Native, and NH Asian or Pacific Islander decreased between 2000 and 2019. NH White only had decreases between 2000 and 2016 with a stable AAMR between 2016 and 2019 (APC −0.8 [95% CI, −2.3 to 0.8]) (Figure 2). Hispanic or Latino only had a decline between 2000 and 2014, with a stable AAMR between 2014 and 2019 (APC −0.6 [95% CI, −2.1 to 1.0]). Notably, NH Asian or Pacific Islander individuals had the lowest AAMRs between 2000 and 2019 (38.64 to 16.9) (online Supplemental Table 4).
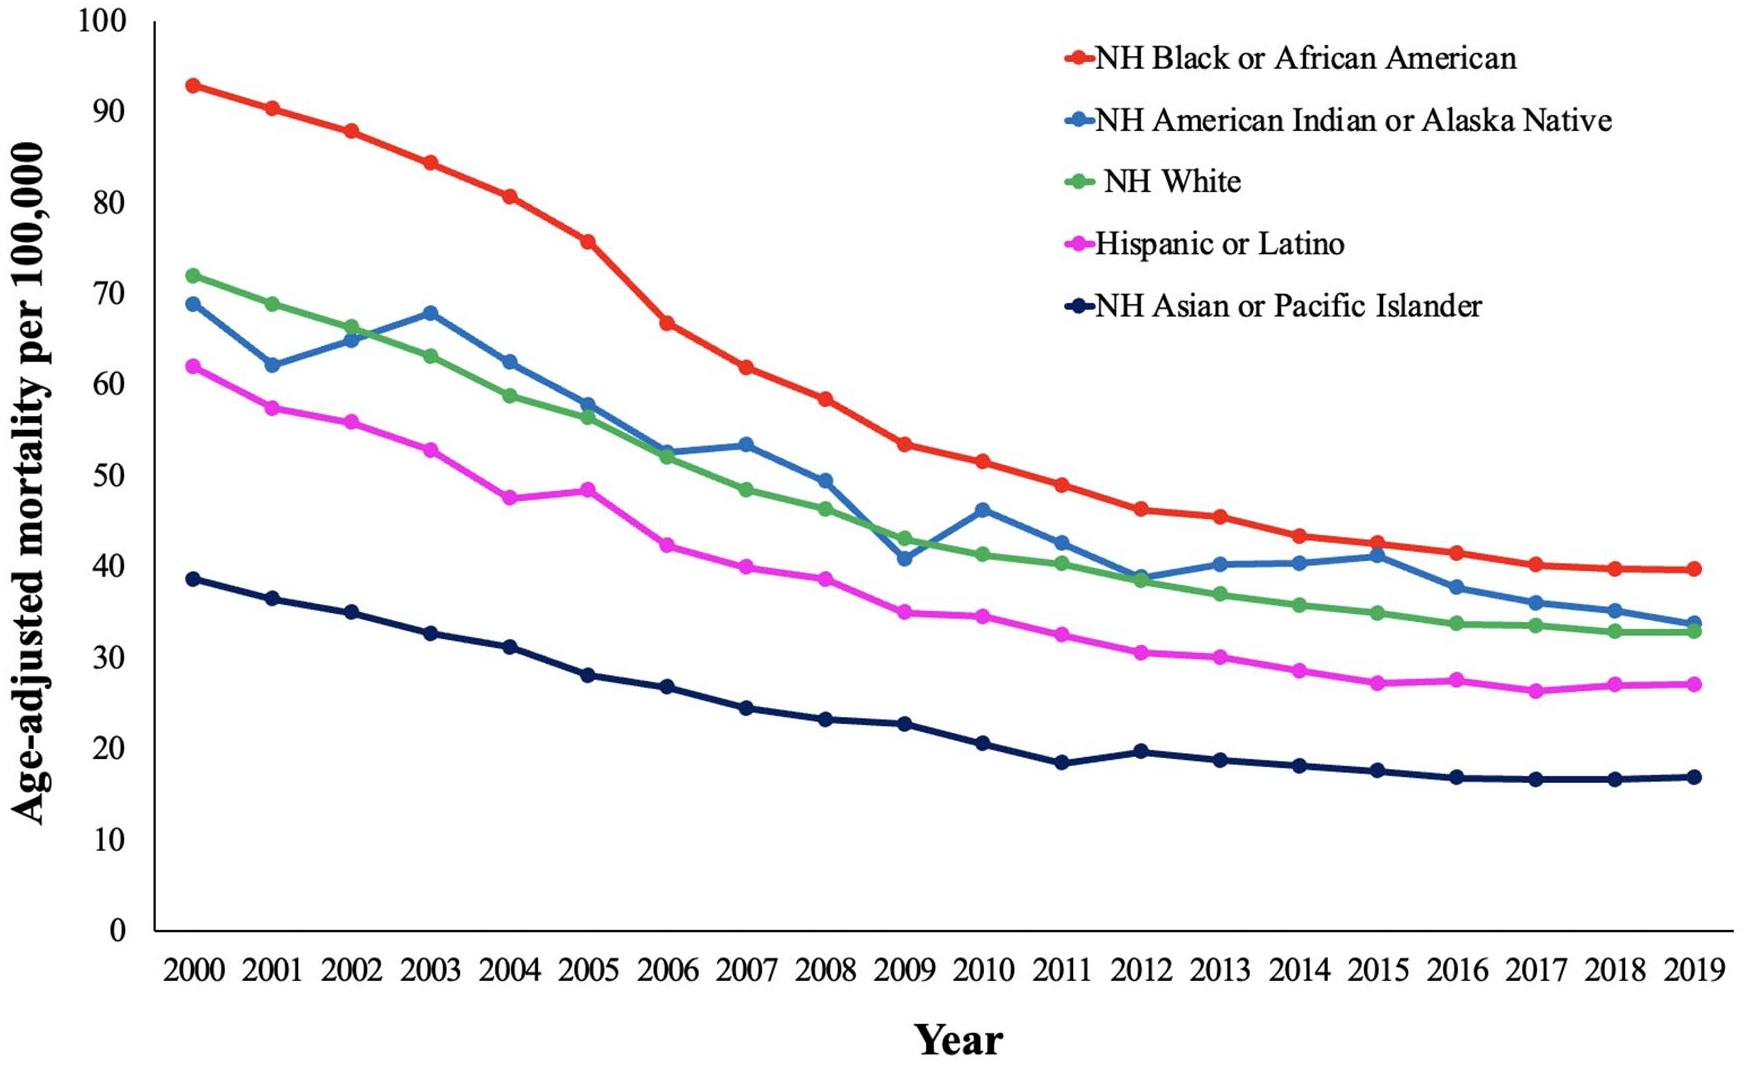
Peripheral artery disease-related age-adjusted mortality rates and annual percentage change (APC) (95% CI) stratified by race in the United States, 2000 to 2019.
Age
PAD-related mortality in the 25–39 years of age group had no change in CMR between 2000 and 2004 (APC −0.4 [95% CI, −3.4 to −2.6]) followed by a decrease in CMR between 2004 and 2009 (APC −6.1 [95% CI, −9.3 to −2.8]) and an increase in CMR between 2009 and 2019 (APC 3.0 [95% CI, 2.1 to 3.8]) (Figure 3A). The 40–54 years of age group had no change in CMR between 2000 and 2002 (APC 0.1 [95% CI, −6.6 to 7.2]), followed by a decrease between 2002 and 2010 (APC −3.7 [95% CI, −4.7 to −2.8]), with no change between 2010 and 2019 (APC 0.2 [95% CI, −0.5 to 1.0]) (Figure 3A). The 55–69 years of age group had a decrease in CMR from 2000 to 2014 followed by no change in CMR between 2014 and 2019 (APC 0.7 [95% CI, −0.1 to 1.4]) (Figure 3B). The 70–84 years of age group also had a decrease in CMR between 2000 and 2016, with no change in CMR between 2016 and 2019 (APC −1.7 [95% CI, −3.5 to 0.2]) (Figure 3B). PAD-related mortality was highest in those 85+ years of age with a CMR of 1132.7 in 2000 to 472.24 in 2019 (online Supplemental Table 5). Despite having the highest CMRs, the 85 and older age group had declines in CMRs throughout the entire study period (Figure 3B).
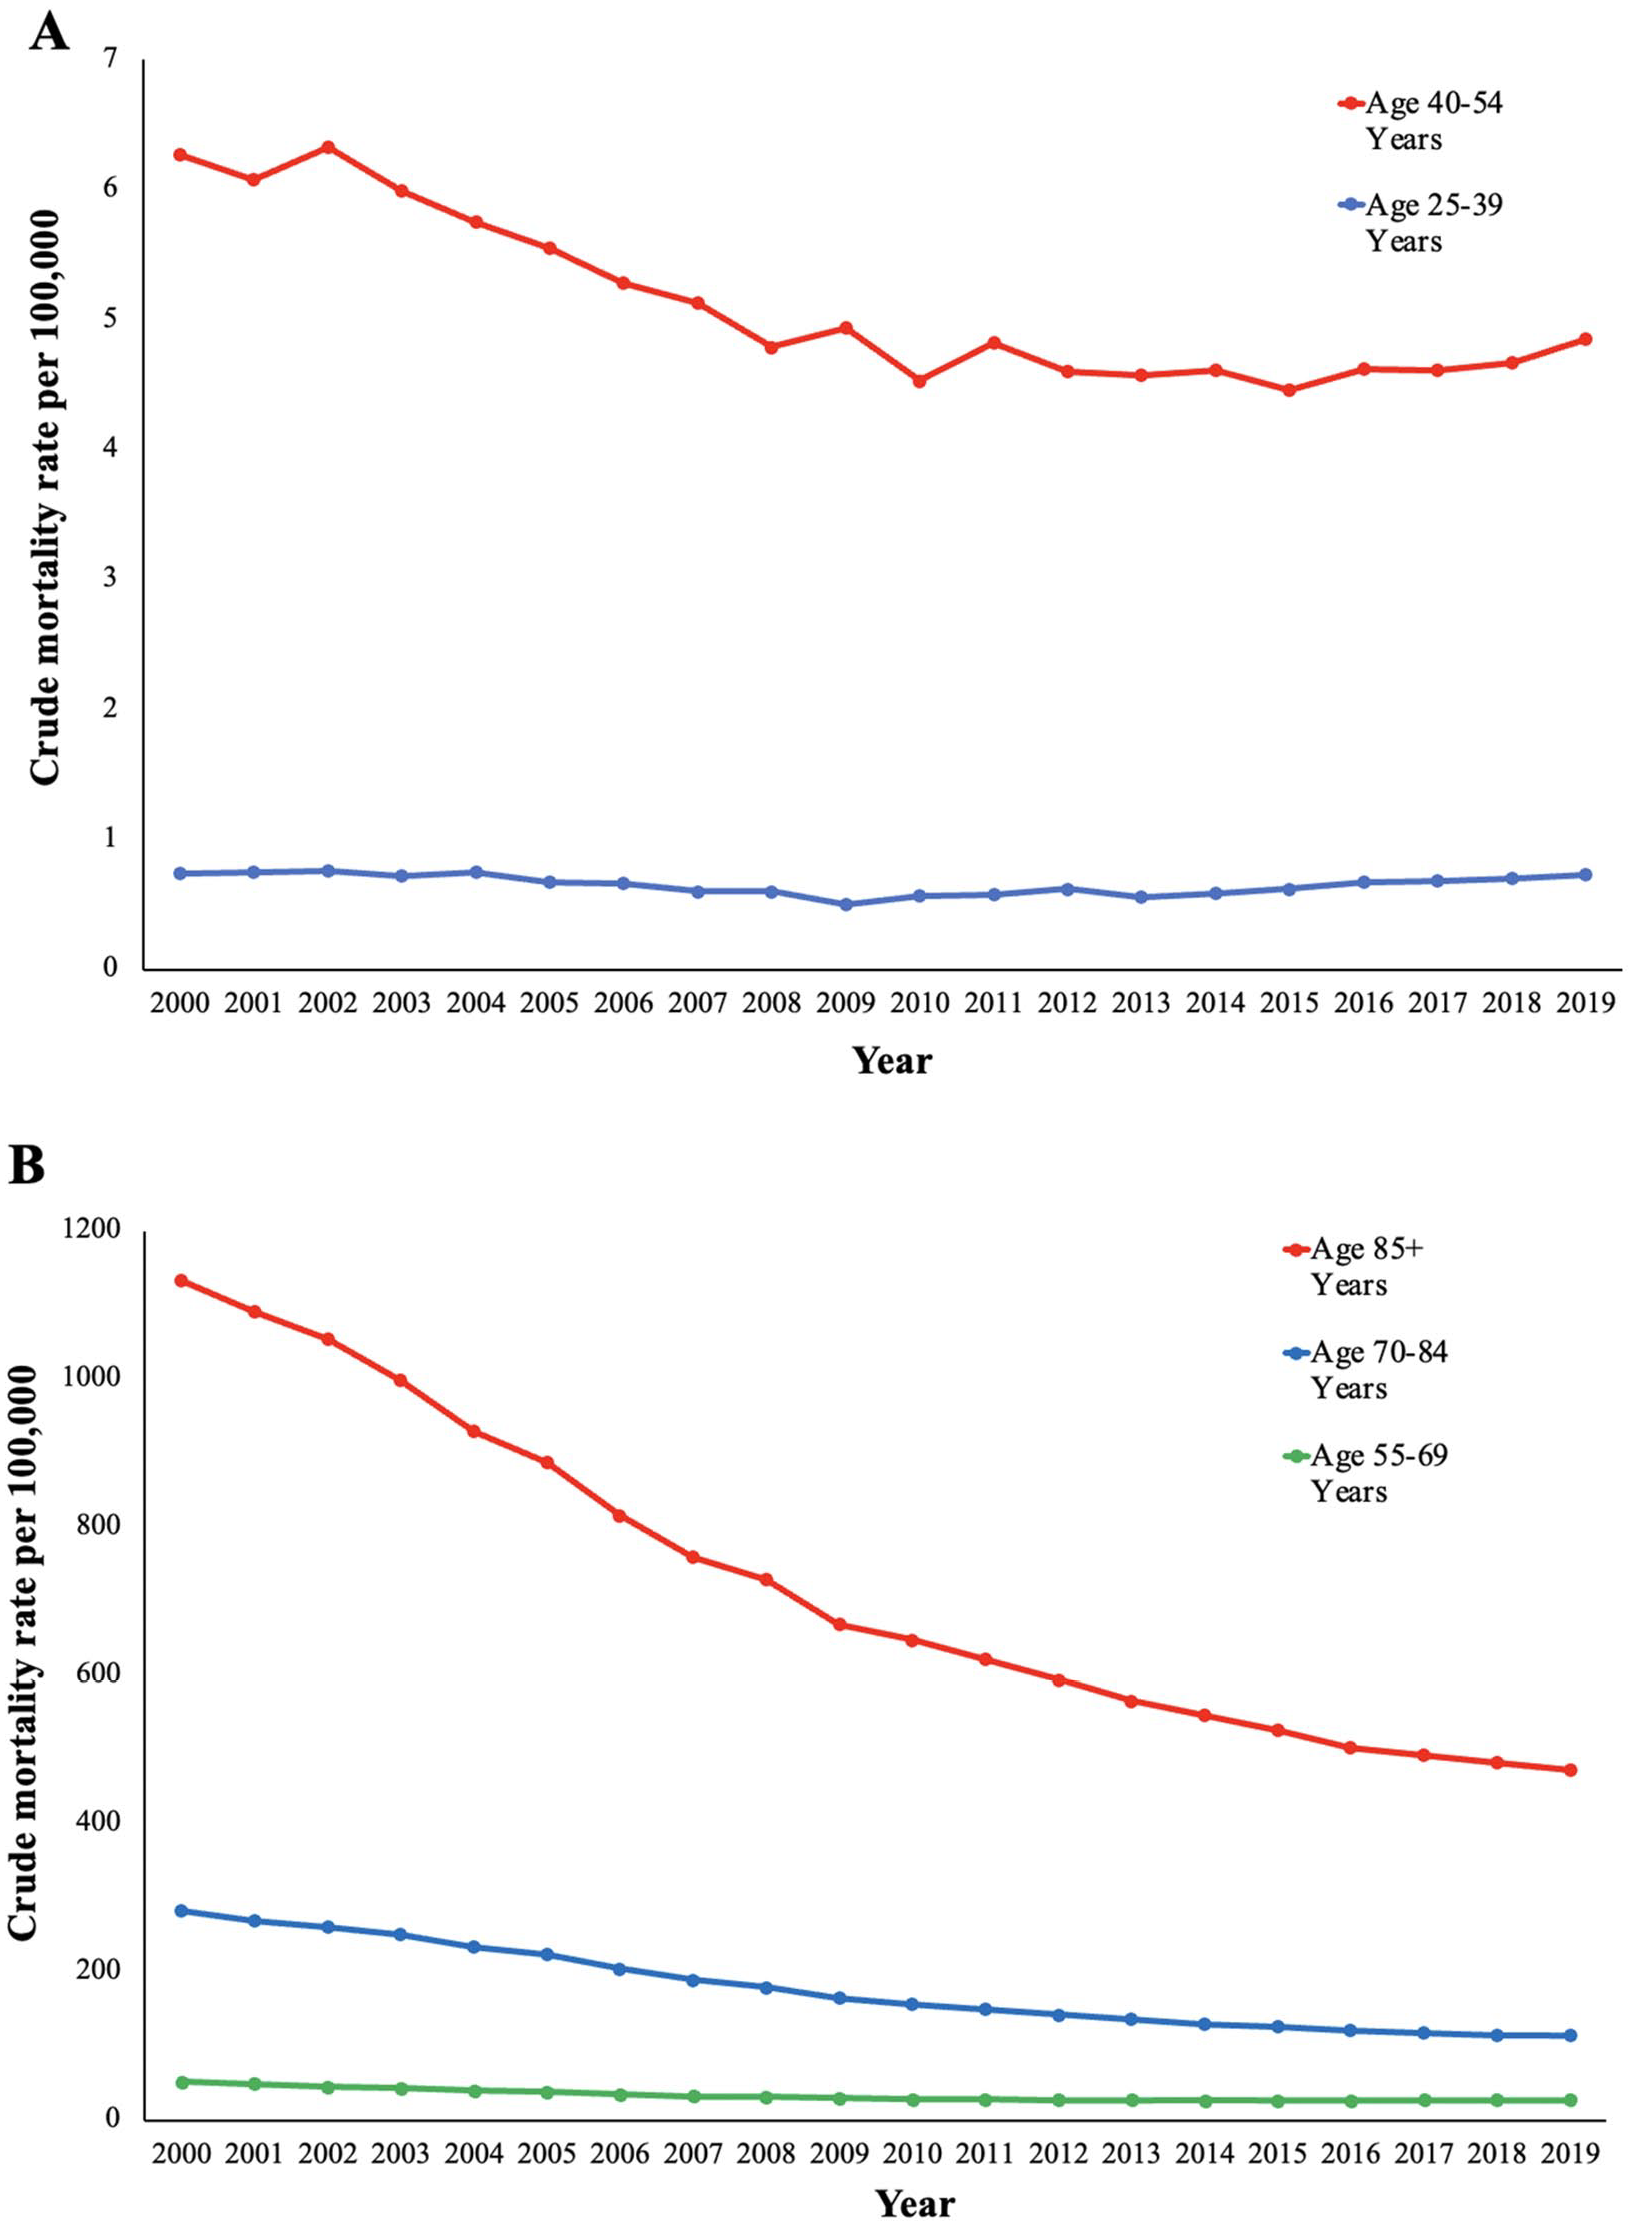
Peripheral artery disease-related crude mortality rates and annual percentage change (APC) (95% CI) in the United States between 2000 and 2019. (A) Age 25–39 years: 2000–2004 −0.4 (−3.4 to 2.6), 2004–2009 −6.1* (−9.3 to −2.8), 2009–2019 3.0* (2.1 to 3.8). Age 40– 54 years: 2000–2002 0.1 (−6.6 to 7.2), 2002–2010 −3.7* (−4.7 to −2.8), 2010–2019 0.2 (−0.5 to 1.0). (B) Age 55–69 years: 2000–2009 −6.1*(−6.4 to −5.8), 2009–2014 −1.9* (−3.0 to −0.8), 2014–2019 0.7 (−0.1 to 1.4). Age 70– 84 years: 2000–2003 −3.7* (−5.1 to −2.4), 2003–2010 −6.6* ( −7.1 to −6.1), 2010–2016 −4.3* ( −5.1 to −3.5), 2016–2019 −1.7 ( −3.5 to 0.2). Age 85+ years: 2000–2002 −3.2* (−5.5 to −0.9), 2002–2009 −6.2* (−6.6 to −5.8), 2009–2016 −4.1* (−4.6 to −3.7), 2016–2019 −2.0* ( −3.4 to −0.6).
Regional patterns
Urban–rural
Nonmetropolitan counties had the highest AAMR compared to medium/small-sized metropolitan and large metropolitan between 2000 and 2019. Nonmetropolitan counties had no change in AAMR from 2000 to 2002 (APC −2.5 [95% CI, −5.8 to 0.9]) (Figure 4). From 2002 to 2019, AAMRs decreased in nonmetropolitan counties. The AAMR in large metropolitan counties decreased between 2000 and 2016 but remained stable between 2016 and 2019 (APC −1.0 [95% CI, −2.5 to 0.5]). Medium/small-sized metropolitan counties had decreasing AAMRs throughout the study period (Figure 4 and online Supplemental Table 6).
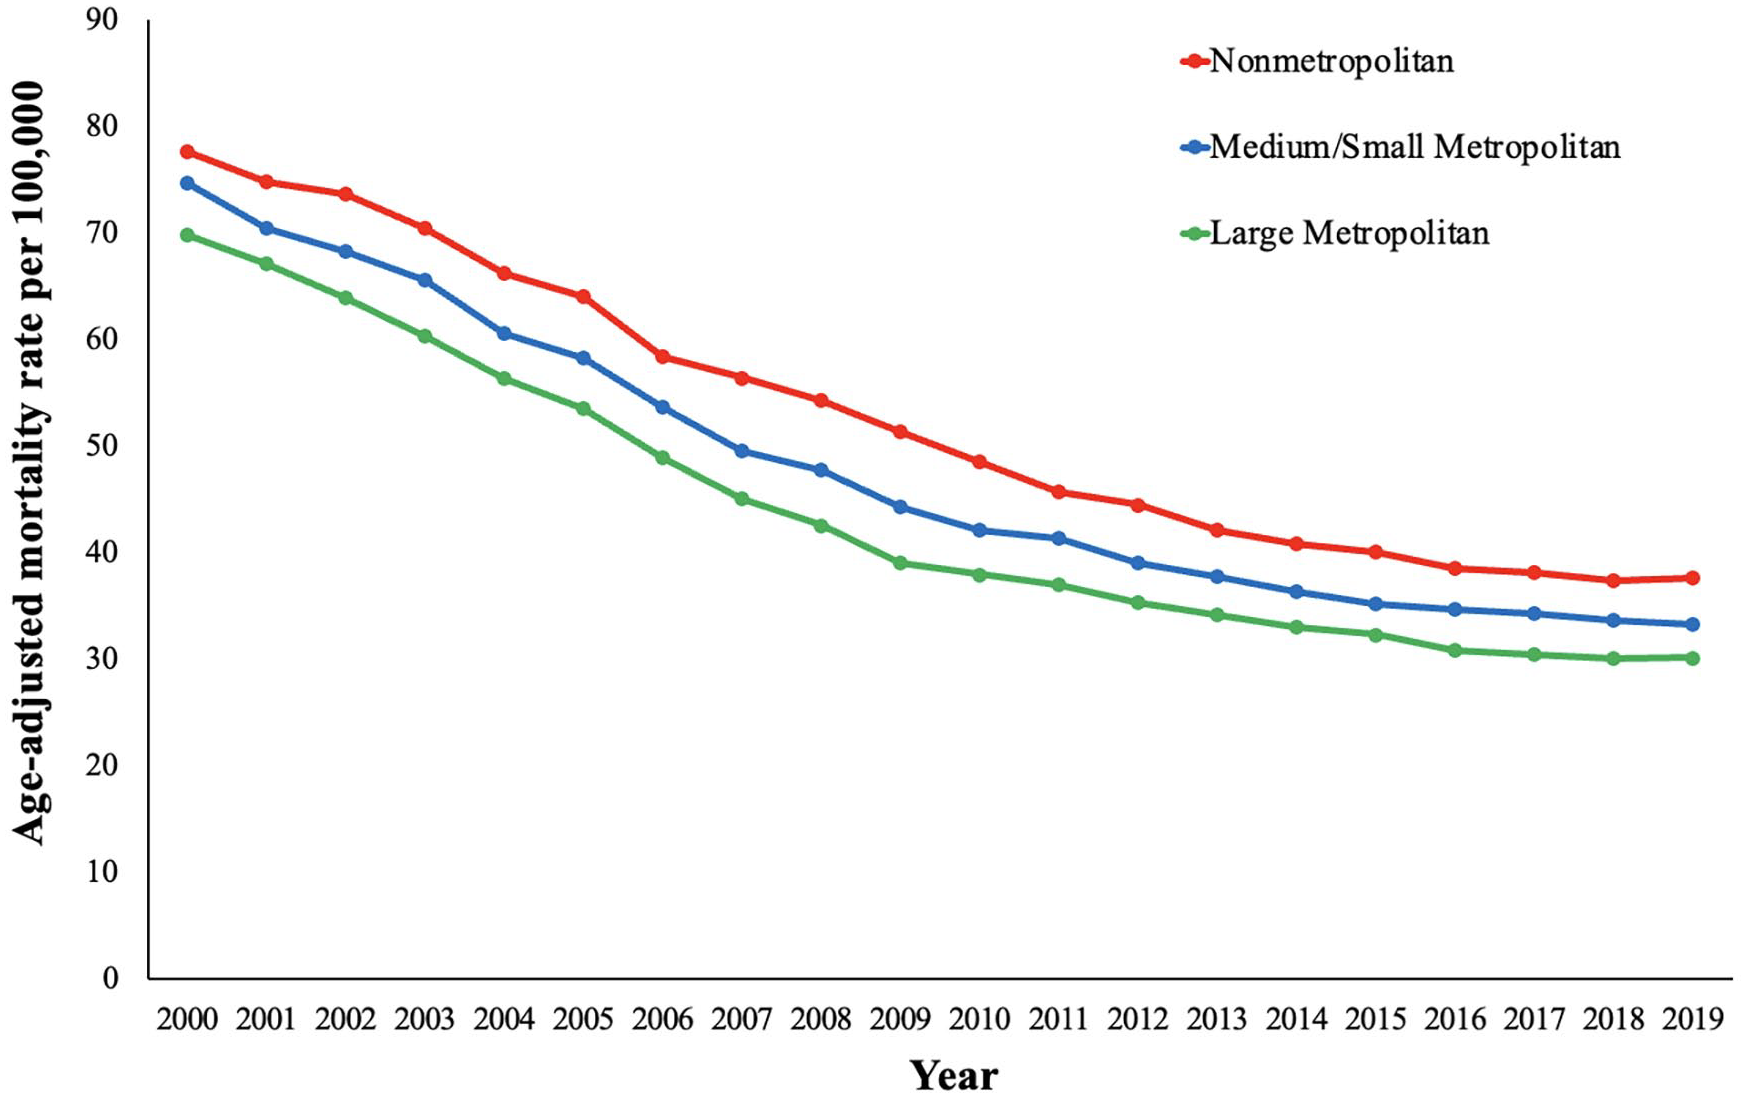
Peripheral artery disease-related age-adjusted mortality rates and annual percentage change (APC) (95% CI) stratified by urban–rural classification in the United States, 2000 to 2019.
State
AAMR varied widely from 29.97 in Hawaii to 68.68 in Ohio (Figure 5) (online Supplemental Table 7). States in the upper 90th percentile of PAD-related mortality included Kansas, Oklahoma, Tennessee, Vermont, West Virginia, and Ohio. States in the lower 10th percentile of PAD-related mortality included Hawaii, Utah, Massachusetts, Nevada, New York, and New Mexico.
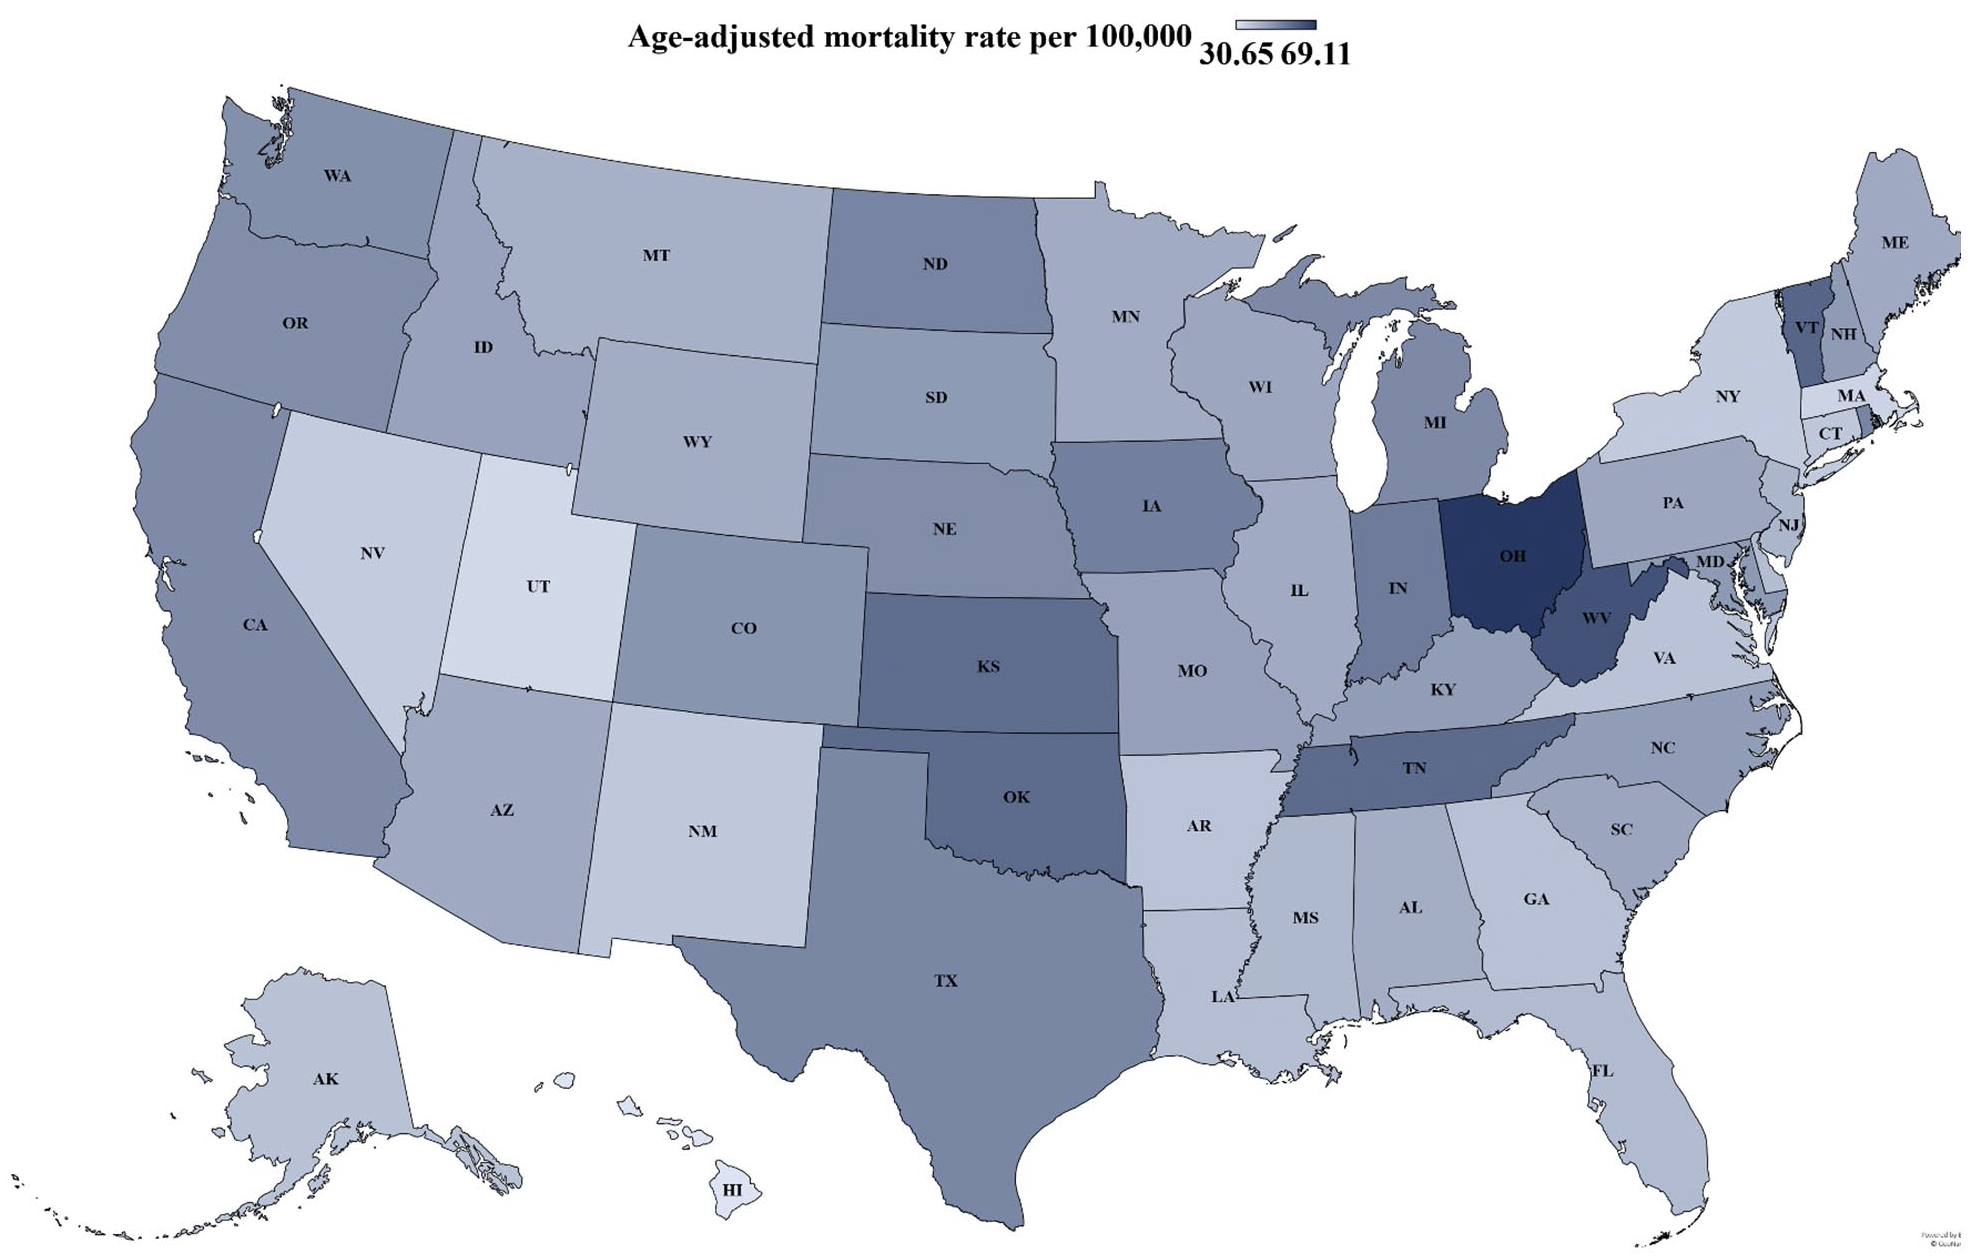
State-level peripheral artery disease-related age-adjusted mortality rates (AAMRs) per 100,000 people (range: 30.65-69.11 per 100,000 people) in the United States, 2000 to 2019. Lighter shading signifies lower AAMR, and darker shading signifies a higher AAMR.
Discussion
In this nationwide study, we report several important findings regarding PAD-related mortality using recent data from 2000 to 2019 in the US. First, PAD-related mortality has decreased from 2000 to 2016 and has stabilized between 2016 and 2019. Second, men had higher PAD-related mortality rates compared with women throughout the study period. Third, NH Black or African American individuals had the highest AAMR compared with other race/ethnicity groups. Fourth, PAD-related mortality was highest in those 85+ years of age; however, there was an increase in CMR in the 25–39 years of age group between 2009 and 2019. Fifth, rural (nonmetropolitan) counties had the highest PAD-related mortality rates throughout the study period.
The current literature regarding population-based PAD mortality is limited. Our findings demonstrate a significant decrease in PAD-related mortality, which is likely related to population-wide trends such as better medical management of atherosclerotic cardiovascular disease and decreases in cigarette smoking prevalence. Despite a decrease in AAMR demonstrated in this study, the incidence and prevalence of PAD have been reported to be increasing throughout the past few decades nationwide. 17 This is likely due to higher prevalence of risk factors (smoking, hypertension, diabetes mellitus) which contribute to disease development, and improved screening and diagnostic assessments, which contribute to better disease detection. Furthermore, better treatment options for PAD 18 allows for the prolongation of patient life expectancy and an improvement in PAD-associated mortality, while also potentially increasing disease prevalence. However, despite the overall improvement in PAD-associated mortality over the past couple of decades, our results show that improvements in PAD-related mortality in the US have stalled, as this finding was present in nearly every demographic and regional group between 2016 and 2019. This may be due to the increase in cardiovascular risk factors between this time.19,20 In addition, studies have found that patients with PAD, especially those without prior cardiovascular history, are often not taking appropriate medical therapy following vascular intervention, including medications shown to improve cardiovascular mortality such as statins 21 and antiplatelet therapy. 22 There has been a decline of both CVD mortality23,24 in the US and a stagnation in US life expectancy after 2010, 25 which may account for the plateau seen in this study. This is especially significant given that CVD mortality stagnation has been widespread across the US, and not just in disadvantaged states. 26 Yet, this does not rule out the possibility of certain subpopulations driving this stagnation. 26 Overall, this warrants further analysis to determine temporal trends among varying cardiovascular diseases, as was our goal with PAD, as well as among different sociodemographic and geographic subpopulations to create initiatives to address CVD mortality stagnation especially among disproportionately affected subpopulations. However, as the US efficiently detects and treats major CVD risk factors, this plateau may be related more to unfavorable trends in the prevalence of underlying risk factors and not due to treatment failures.
Men had higher PAD mortality rates than women did across the study period. Men have higher risk factor burden for PAD, such as smoking, than women do, 27 which likely contributes to the higher mortality rate seen in this study. Additionally, the PAD-related mortality rates were persistently higher among non-Hispanic Black or African American individuals throughout the study period, consistent with previously documented disparities in PAD risk, incidence, and treatment. 28 The MESA study found 1.67-fold higher adjusted odds for incident PAD in African American compared to White individuals. 29 The San Diego Population Study found threefold higher odds of PAD among African American individuals compared to White individuals, and this risk was modestly attenuated after accounting for traditional and novel risk factors. 30 Multiple studies have demonstrated higher rates of amputations and lower rates of lower extremity revascularization in Black individuals compared with other racial groups.31–33 Black individuals are also less likely to be discharged on a statin after PAD intervention than non-Black patients.34,35 Alternatively, the Asian and Pacific Islander population had the lowest AAMRs within the 2000 to 2019 time period, which is consistent with an overall lower prevalence of PAD in previous literature. 36 Although PAD-related mortality rates have improved, our findings highlight the need for additional measures to further improve PAD-related mortality, especially among Black individuals.
Patients 85 years and older had higher overall mortality rates than younger age groups; however, there was an increase in the PAD-related mortality rate among 25 to 39-year-old individuals. Age is known to be an independent risk factor for PAD. For example, one study found that PAD prevalence increased from 1 in 50 to 1 in 3 in ages 40–50 as compared to ages 91–100. 37 This could be due to an increased length of exposure to key PAD risk factors, 38 thus making older patients more vulnerable. Although the absolute rates are low in young individuals, our results demonstrate a worrying increase in PAD-related mortality in this group in recent years. This finding could be related to earlier exposure to traditional risk factors, such as the increasing incidence of type 2 diabetes in young people in the US. 39 This correlates with reports that the proportion of cigarette smokers who initiated daily smoking has increased significantly between 2002 and 2018 in young patients. 40
Our results also showed that PAD mortality is higher in rural counties than in urban counties. Overall, rural counties have a higher burden of PAD risk factors including smoking, 41 hypertension, 42 diabetes, 43 and hypercholesterolemia 44 than nonrural counties, which contribute to the overall higher PAD mortality rate we report in our results. Additionally, one study found PAD-associated amputation rates to be higher in rural counties than in urban counties, in part due to lack of access to specialty care.45,46 A higher burden of socioeconomic factors such as poverty and lack of transportation as well as the general lack of access to care disproportionately limits PAD patients who are rural county residents from receiving early diagnosis and adequate care for their disease. 47 Therefore, initiatives to decrease socioeconomic factor burden among rural counties are recommended to address this disparity highlighted in our results.
Study limitations
Limitations to this study include potential misclassification of PAD-related mortality upon completion of death certificate data within the multiple cause of death database and nonregistration bias as death certificate databases do not examine deceased individuals outside of death certificates. Analysis from the CDC WONDER database is reliant on data abstracted from death certificates. If diagnoses were not captured on the death certificates. Potential misclassification or incomplete ascertainment of disease status is possible. In addition, since the CDC WONDER database relies on death certificate information, we do not have additional data about disease prevalence in this study. Further, the database lacks information on risk factors, laboratory/imaging variables, and treatment (endovascular/surgical/medications) received. Additionally, the outcomes of demographic subgroups may be impacted by the lack of procedural data regarding rate or outcomes of PAD or social determinants of health information within the CDC WONDER database. Also, men versus women were compared without adjusting for confounders such as diabetes rates and life expectancy. The study highlighted the link between ICD-10 codes and the primary outcome. As mentioned previously, emigration and immigration patterns of residents moving to another state or a destination with a different urban/rural classification than their previous residence are recorded as deaths occurring in individuals’ final locations. Another limitation of this study is that we do not have a denominator PAD population identified to help understand PAD-related deaths relative to PAD cases.
Conclusion
In conclusion, we report an overall decrease in PAD-related mortality rate from 2000 to 2016, with stagnant mortality rates between 2016 and 2019, in this nationwide population-based analysis of death certificate data. Men, NH Black and African American individuals, and individuals of older age disproportionately have the highest PAD-related mortality rates. However, there has been an increase in mortality rate among individuals 25–39 years of age. Further investigation into the causative mechanisms of these PAD-associated and identified disparities is warranted to address these gaps.
Supplemental Material
sj-pdf-1-vmj-10.1177_1358863X221140151 – Supplemental material for Demographic and regional trends of peripheral artery disease-related mortality in the United States, 2000 to 2019
Supplemental material, sj-pdf-1-vmj-10.1177_1358863X221140151 for Demographic and regional trends of peripheral artery disease-related mortality in the United States, 2000 to 2019 by Rochell Issa, Salik Nazir, Abdul Mannan Khan Minhas, Jacob Lang, Robert W Ariss, Waleed Tallat Kayani, Mirza Umair Khalid, Laurence Sperling, Michael D Shapiro, Hani Jneid and Rajesh Gupta in Vascular Medicine
Footnotes
Declaration of conflicting interests
The authors declared no potential conflicts of interest with respect to the research, authorship, and/or publication of this article.
Funding
The authors received no financial support for the research, authorship, and/or publication of this article.
Supplementary material
The supplementary material is available online with the article.
References
Supplementary Material
Please find the following supplemental material available below.
For Open Access articles published under a Creative Commons License, all supplemental material carries the same license as the article it is associated with.
For non-Open Access articles published, all supplemental material carries a non-exclusive license, and permission requests for re-use of supplemental material or any part of supplemental material shall be sent directly to the copyright owner as specified in the copyright notice associated with the article.