
Abstract
Introduction:
Peripheral artery disease (PAD) is a well-described risk factor for mortality, but few studies have examined secular trends in mortality over time for patients with PAD. We characterized trends in mortality in patients with PAD in recent years among Medicare patients.
Methods:
We used Medicare claims to identify patients with a new diagnosis code for PAD between January 1, 2006 and December 31, 2018 using International Classification of Diseases (ICD) diagnosis codes. The primary outcome of interest was the 1-year all-cause age-adjusted mortality rate. Our secondary outcome was the 5-year all-cause mortality rate. Multivariable regression was used to identify factors which predict mortality at 1 year.
Results:
We identified 4,373,644 patients with a new diagnosis code for PAD during the study period. Between 2006 and 2018, 1-year all-cause age-adjusted mortality declined from 12.6% to 9.9% (p < 0.001). One-year crude all-cause mortality also declined from 14.6% to 9.5% (p < 0.001). Similar results were observed for 5-year age-adjusted mortality rates (40.9% to 35.2%, p < 0.001). Factors associated with increased risk of death at 1 year included age ⩾ 85 years (hazard ratio [HR] 3.030; 95% CI 3.008–3.053) and congestive heart failure (HR 1.86; 95% CI 1.85–1.88). Patients who were regularly dispensed statins, ace-inhibitors, beta-blockers, antithrombotic agents, and anticoagulants all had lower mortality (range OR 0.36; CI 0.35–0.37 for statins to OR 0.60; CI 0.59–0.61 for anticoagulants; all p < 0.001).
Conclusion:
Among US Medicare patients diagnosed with PAD between 2006 and 2019, 1-year age-adjusted mortality declined by 2.7%. This decline in mortality among patients with PAD occurred in the context of a younger mean age of diagnosis of PAD and improved cardiovascular prevention therapy.
Introduction
Peripheral artery disease (PAD) is a heterogeneous entity, ranging from asymptomatic to claudication to ischemic rest pain and/or tissue loss. 1 In recent decades, aging populations and worsening risk factor profiles have led many to describe an increasing prevalence of PAD in both western and developing countries.2–4 This carries implications for patients as PAD is an important risk factor for mortality, even in asymptomatic individuals.2,5–9
Secular trends in mortality in recent years have been reported for coronary heart disease (CHD) and cerebrovascular disease (CVD).10–19 These studies have outlined how age-adjusted mortality rates for individuals with CHD and CVD have fallen significantly in recent years across much of Europe and the United States, with an estimated 13.9% decline in the age-adjusted death rate attributable to CVD in the US from 2008 to 2018.10–14,19 However, to our knowledge, similar analyses have not been performed for mortality among patients diagnosed with PAD. Better understanding of these secular trends and the factors associated with changes in mortality among patients with PAD would help clinicians and scientists to better identify groups of patients at the highest risk for mortality.
Therefore, we characterized age-adjusted trends in 1-year and 5-year age-adjusted mortality in patients diagnosed with peripheral artery disease in the Medicare population between January 1, 2006 and December 31, 2018. We hypothesized that mortality rates for patients with PAD would decline over time and examined trends in the characteristics of patients diagnosed with PAD, including their age, comorbidities, and medication dispense rates as a surrogate for longitudinal compliance with medical therapy.
Methods
We performed a retrospective analysis using Medicare fee-for-service (FFS) Part B Carrier, Medicare Provider Analysis and Review (MedPAR), and outpatient claims records for PAD from 2006 to 2019 (Figure 1). The study period extended through the end of calendar year 2019 to allow for 1-year follow up of patients identified in 2018, and 5-year follow up of patients identified in 2014.
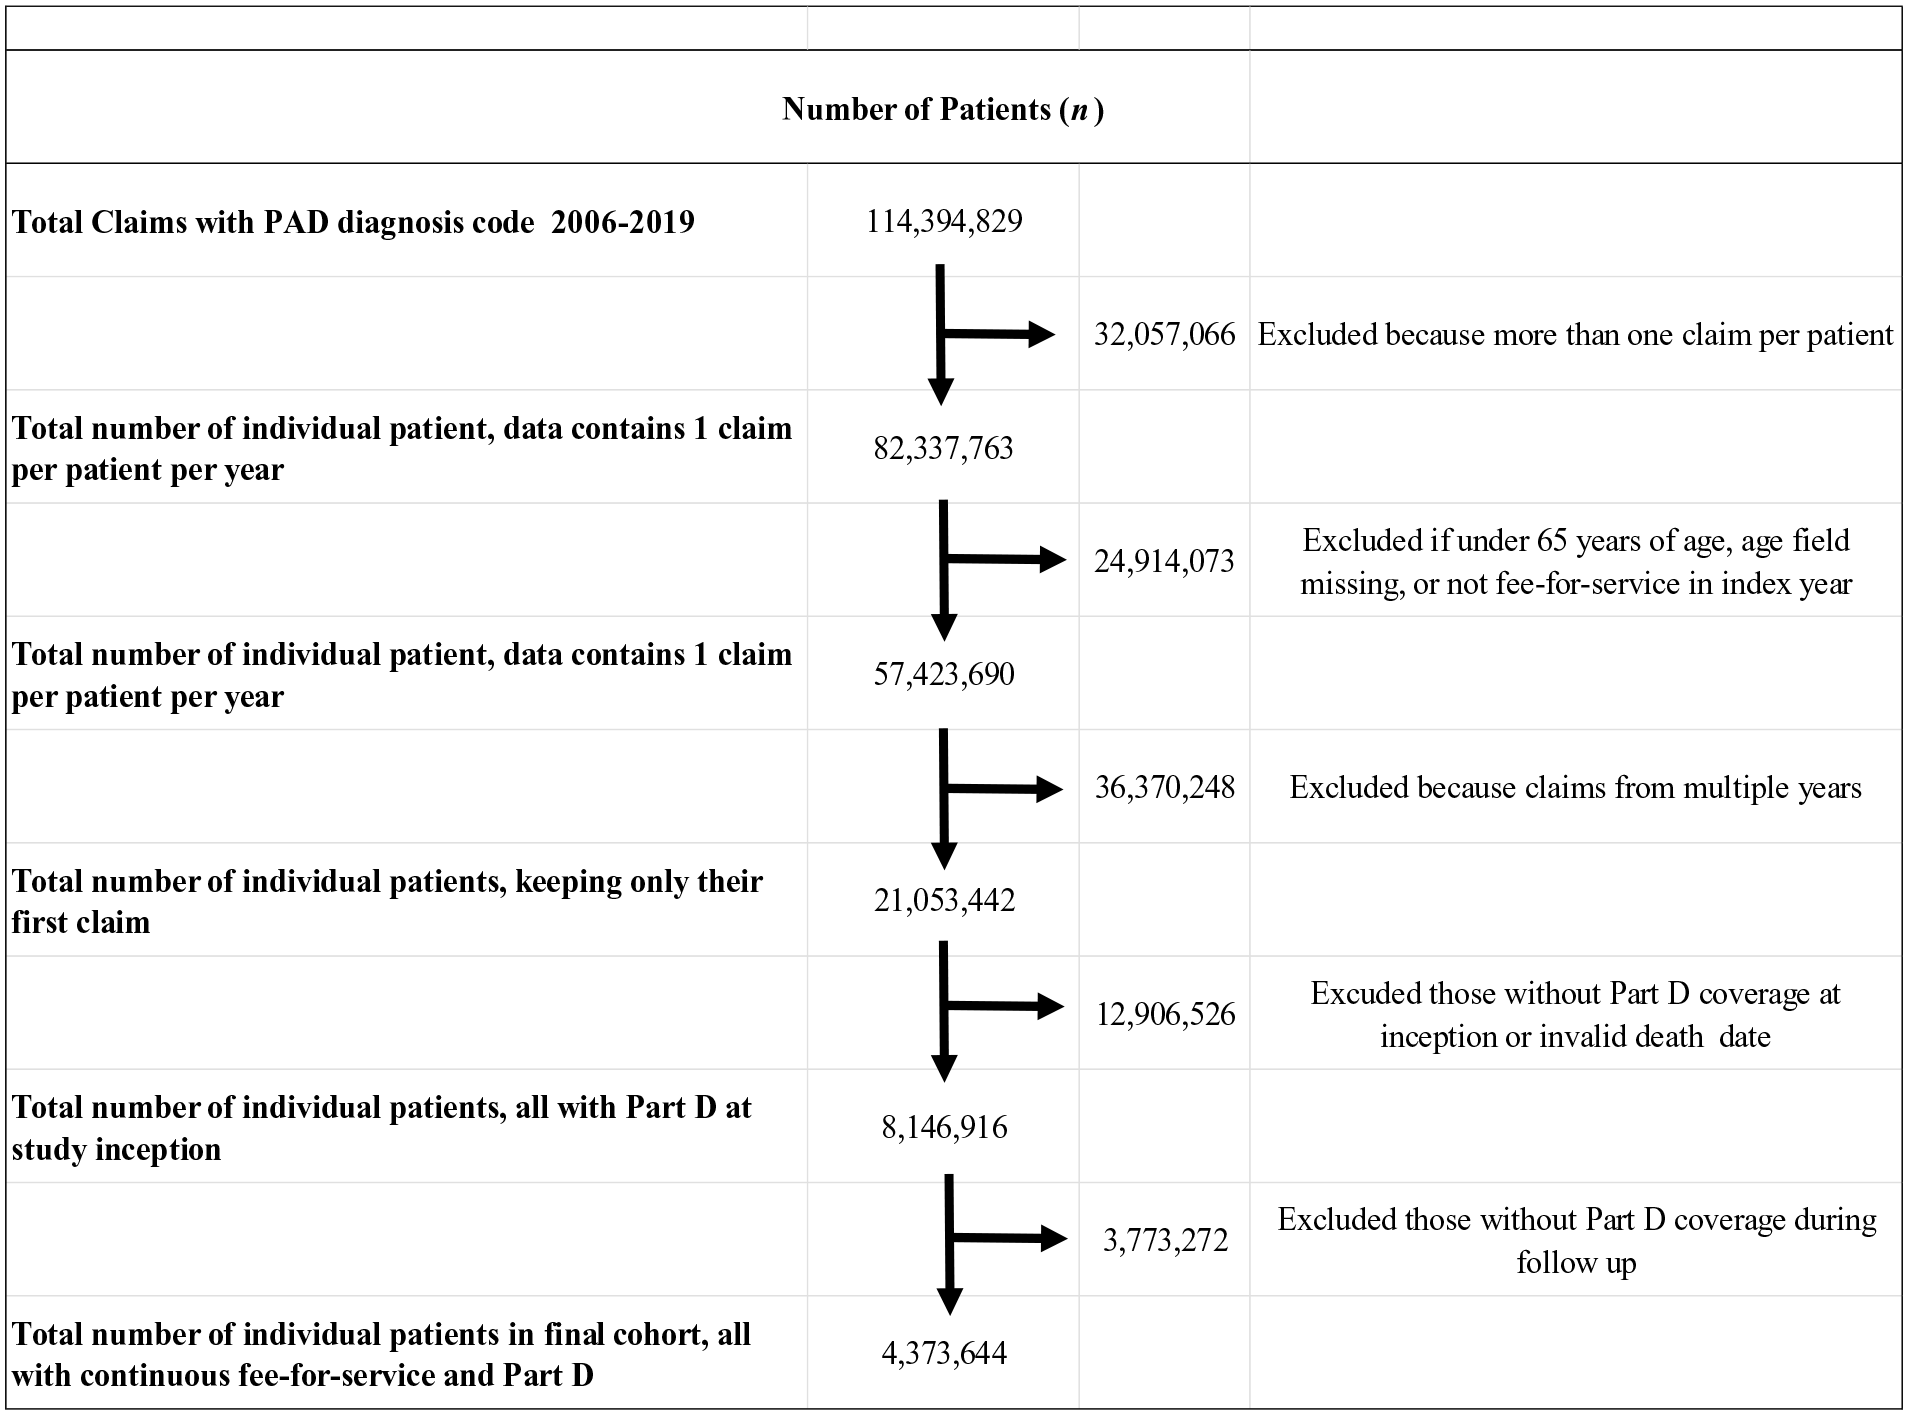
Flow diagram depicting creation of analytic sample of Medicare patients with peripheral artery disease (PAD) from 2006 to 2018.
We accessed the data using Centers for Medicare and Medicaid Services (CMS) data use agreement RSCH-2018-52223. In accordance with this, all data were subject to standard CMS data suppression regulations and reporting criteria on The Dartmouth Institute’s Dataverse. Given the nature of this retrospective review, patient consent requirements were waived. This study was approved by the Dartmouth-Hitchcock Health Human Research Protection Program.
We identified all patients using the International Classification of Diseases, Ninth Revision (ICD-9) or Tenth Revision (ICD-10) diagnosis codes indicative of PAD, which have been used previously20–22 (Appendix A). We considered subgroup analyses within the disease categories of PAD (claudication and chronic limb-threatening ischemia [CLTI]). Validated ICD coding lists for CLTI do not exist, which makes it possible these patients were misclassified. Our primary analysis, therefore, focuses on the total PAD population.
We used a 1-year look-back period to ensure patients entering our cohort in 2006 did not have any diagnosis of PAD in the year prior to inclusion in the study cohort. 23 We studied only one claim per beneficiary per year. Patients were excluded from the study if they were less than 65 years of age, of unknown sex, or lacked FFS during the index year of their PAD diagnosis. To allow evaluation of medication use among patients with PAD, we limited our sample to only those enrolled in Medicare Part D for the year following their PAD diagnosis. This yielded a final sample of 4,373,644 patients.
Assessment of trends in all-cause mortality
The primary outcome of interest for this study was the all-cause, age-adjusted mortality rate within the first year after diagnosis with PAD. Crude mortality is also presented in Appendix B. Vital status was determined using the Master Beneficiary Summary File (MBSF) and the Medicare Denominator File, which provides an annual assessment of patient survival status. In assessing overall mortality rates, patients were censored at the date of death with the last date assessed being December 31, 2019. Our secondary analyses considered 5-year mortality rates as well.
A cumulative distribution function was created to assess unadjusted and age-adjusted time to death at 1 year for each cohort year from 2006 to 2018, as well as time to death at 5 years. Kaplan–Meier survival analysis was used to characterize the time to death stratified by age group, race, sex, and medication dispensing. Comorbidities pertinent to survival, such as hypertension, coronary artery disease, renal insufficiency, and cancer, were assessed and used to calculate a Charlson comorbidity score for each patient.22,24
Assessment of medication dispensing
While we collected information about the age, sex, race, and comorbidities of the patients in our cohort, we also sought to examine the association of medication dispenses on patient mortality in PAD, with the hypothesis that more medication dispenses would be associated with lower mortality. Medications were grouped into five categories: (1) angiotensin-converting enzyme (ACE)-inhibitors, (2) beta-blockers, (3) statins, (4) antiplatelet agents other than aspirin, which is often not coded in Medicare Part D datasets, and (5) anticoagulant agents. We reviewed lists of FDA-approved agents in each medication class during the study period. National Drug Codes (NDC) for each agent were then acquired using the FDA National Drug Code Directory. Aspirin, though an important medication for this population of patients, was omitted because of the inability to track its receipt given its over-the-counter availability.
Using Medicare Part D files, we studied the proportion of days covered (PDC) – a function of prescriptions and medication dispenses – for each of these agents as described in previous works. 25 A PDC > 80% means that the patient’s Medicare Part D insurance was billed for medication fills on more than 80% of all days when the patient was eligible for the medication. 26 Though it provides lower estimates of medication use than many self-reported and registry-reported methods, it is widely used as the preferred surrogate for assessing medication dispensation by the Pharmacy Quality Alliance and in Medicare Star ratings calculations. 27
Assessment of annualized mortality rate over time and regional changes in mortality
To account for the changing age distribution of our cohort over time, we calculated an annualized mortality rate for each year under study. The procedure for direct age-adjustment has been previously described. 28 In brief, to apply direct age-adjustment to mortality, the age-specific death rate for each age group in a study population is multiplied by the appropriate weight in the standard population. The sum of these products yields the directly age-adjusted rate. The standard population weights used in this study were those published by the Centers for Disease Control and Prevention (CDC) based upon the US population from the year 2000. 28
We used the hospital referral regions defined in the Dartmouth Atlas of Healthcare to examine regional rates of change in mortality during the study period. Using correlation coefficients, we examined crude relationships between changes in age at the regional level and changes in mortality at the regional level.
Models to identify factors associated with mortality
Simple univariable analysis was initially used to assess the association between covariates such as age, race, sex, comorbidities, and rates of medication dispensation with the binary outcome of death at 1 year. Cox regression was then performed to create models consisting of age, sex, race, sociodemographic information, comorbidities, and medication dispensation to predict the hazard of death at 1 year. Our models are adjusted for state-level smoking prevalence using the Behavioral Risk Factor Surveillance System (BRFSS) state-level dataset from 2016. A similar process was used to generate models for mortality at 5 years.
We used zip-code level assessment of poverty and rural/urban status, as well as individual patient-level assessments of socioeconomic status, using Medicare-Medicaid dual eligibility status. Model performance was assessed using C-statistics, as shown in Appendix C. Though all these variables were considered in the models, only those that were significant in the final model were included in the calculation of hazard ratios derived from these Cox models.
Sensitivity analysis
We performed a sensitivity analysis to determine the proportion of cardiovascular events related to cardiovascular disease such as myocardial infarction and stroke over time. To identify these deaths, we implemented the approach described by Desai and colleagues in their classification of death events using administrative claims data. 29 Mortality associated with a preceding cardiovascular event was identified based upon the presence of diagnosis codes of myocardial infarction, ischemic stroke, intracranial hemorrhage, sudden cardiac death, or hospitalization for heart failure within 30 days of death date recorded in the MBSF. This allowed us to determine the proportion of deaths among our cohort which could reasonably be attributed to cardiovascular disease. These findings are shown in Appendix D.
Results
Cohort characteristics and trends in comorbidities
The analytic cohort for this study was comprised of 4,373,644 unique Medicare patients with PAD. The mean age for these patients was 76.4 years and 60.4% of these patients were women. Overall, 81.2% of this cohort was White, 8.7% were Black, 2.8% were Asian/Pacific Islander, 5.6% were Hispanic, 0.4% were Native American, and the remaining 1.4% unknown. Half of all patients had concomitant diabetes mellitus (DM) (50.3%), 22.6% had congestive heart failure (CHF), 16.7% had chronic kidney disease (CKD), and 8.8% had experienced a prior myocardial infarction (MI). Approximately 33.2% of patients with PAD in each year had a diagnosis code which was specific for claudication, and this proportion did not change appreciably during the study period. The remaining 66.8% of individuals each year were assigned diagnosis codes indicative of nonspecific PAD or CLTI.
In our analysis, we noted changes in baseline comorbidities in patients entering the cohort over time. For example, in 2006, 30.4% of the patients in the cohort had a diagnosis of CHF. However, by 2018 only 18.3% of the cohort had a diagnosis of CHF. Similarly, 29.5% of patients had a diagnosis of CVD in 2006 compared to 20% in 2018. Rates of diabetes among patients with PAD remained relatively constant at approximately 50% during the study period, but rates of smoking declined by approximately 5% during the same period (data not shown), from approximately 48% of patients reporting prior or active smoking at the start of the study period, to approximately 40% reporting similar current smoking status at the conclusion of the study period.
The proportion of patients with a new diagnosis code for PAD who were women declined from 64.7% in 2006 to 56.2% in 2018. The proportion of patients with concomitant CKD increased from 13.9% in 2006 to 19.8% in 2018 (Table 1). Race and ethnicity changed little over time, except for the proportion of Hispanic patients, who constituted 3.6% of all new patients with PAD in 2006 and increased to 5.2% of all new patients with PAD in 2018. These secular changes were statistically significant (nonparametric test of trend p < 0.001 for age, CHF, CKD, race, and sex).
Baseline demographics by year entering into cohort and secular changes over time.
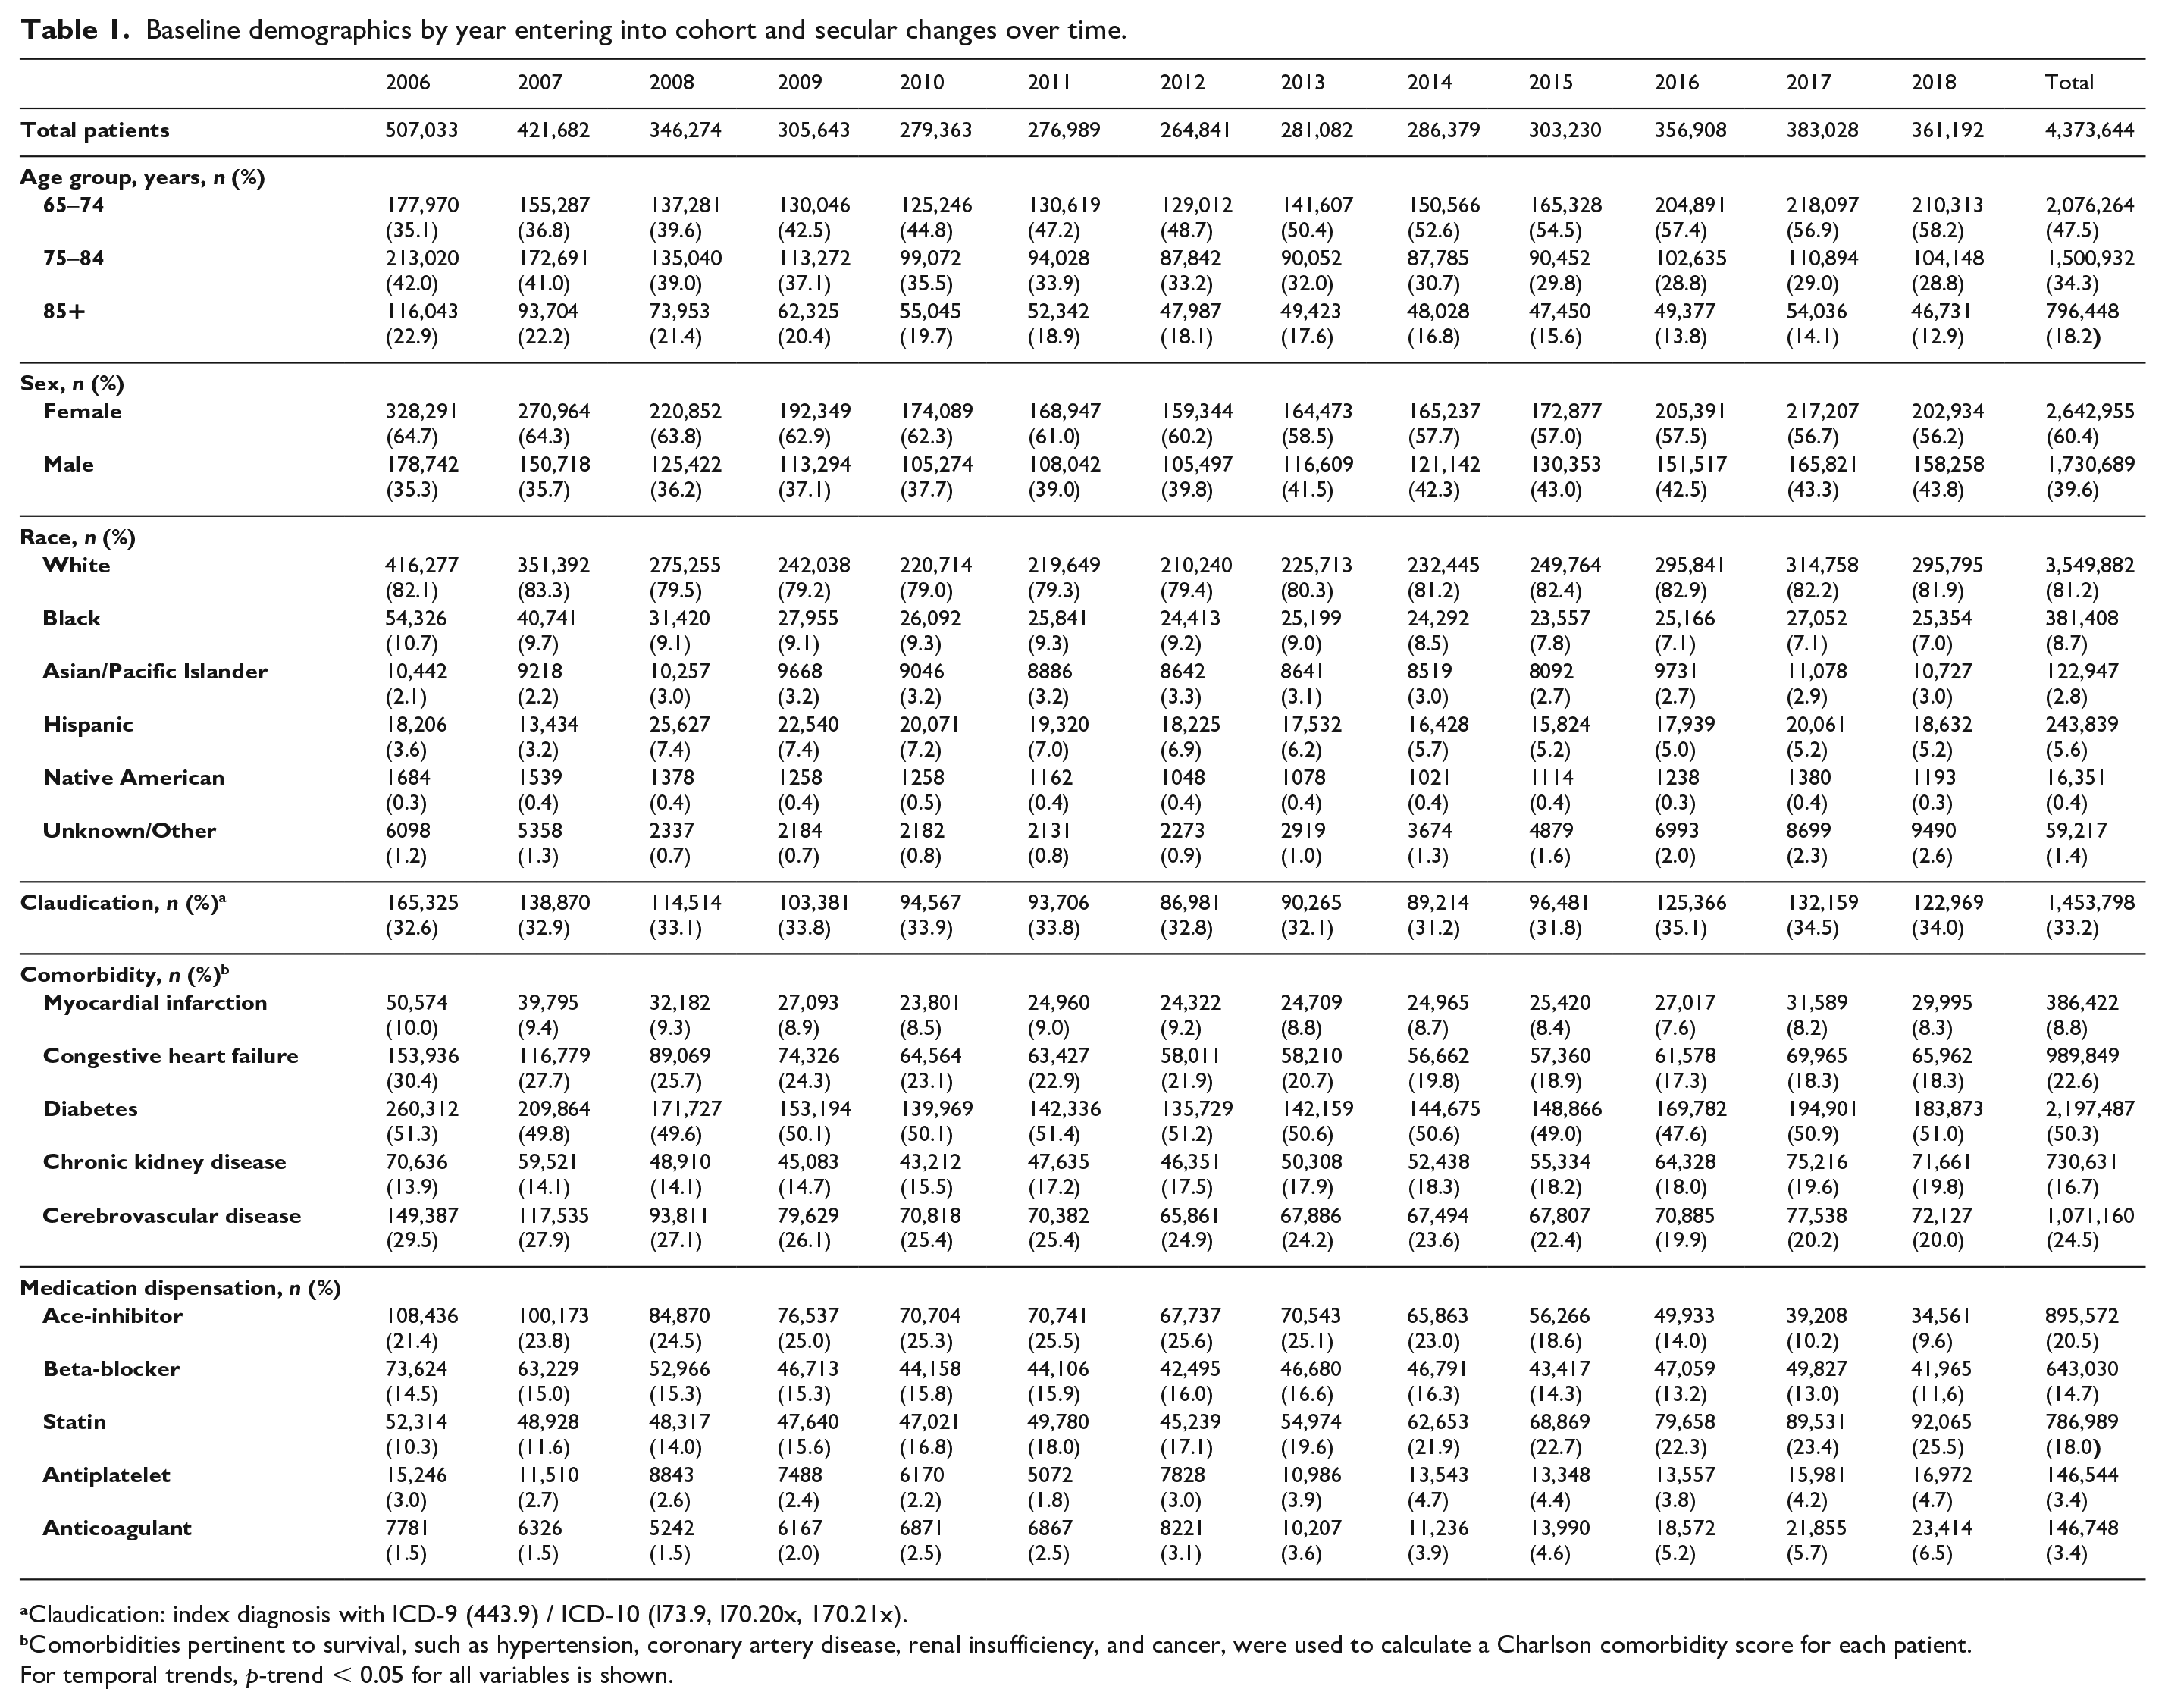
aClaudication: index diagnosis with ICD-9 (443.9) / ICD-10 (I73.9, I70.20x, 170.21x).
bComorbidities pertinent to survival, such as hypertension, coronary artery disease, renal insufficiency, and cancer, were used to calculate a Charlson comorbidity score for each patient.
For temporal trends, p-trend < 0.05 for all variables is shown.
Medication dispensing patterns
We assessed patient level rates of medication dispensing, in terms of the PDC for five classes of medications: (1) ACE-inhibitors, (2) beta-blockers, (3) statins, (4) antiplatelet agents exclusive of aspirin, and (5) anticoagulant agents (Appendix E). We noted that the class of medication with the highest overall mean PDC with Medicare Part D was ACE-inhibitors at 31.2%. The class of medication with the next highest PDC was statins (29.9%), followed by beta-blockers (22.8%), anticoagulant agents (6.5%), and antiplatelet agents (6.1%). Among this same group, we noted that 20.5% of patients had a PDC > 80% for ACE-inhibitor use; this was followed by 18% for statin use, 14.7% for beta-blocker use, and 3.4% for antiplatelet (other than aspirin) and anticoagulant use (Table 1).
For patients who entered the cohort in 2006, only 10.3% were noted to have a PDC > 80% for statins. However, for patients who entered the cohort in 2018, 25.5% had a PDC > 80% for statin medications, an increase of 147.5% over this period. Conversely, there was a reduction in the proportion of patients with PAD receiving dispenses for ACE-inhibitor medications over time (Figure 2). In 2006, 21.4% of patients who entered the cohort had a PDC > 80% for ACE-inhibitors, yet in 2018 this proportion was only 9.6%, a 55.1% reduction in the proportion of patients who regularly receive this medication as part of their Part D benefits.
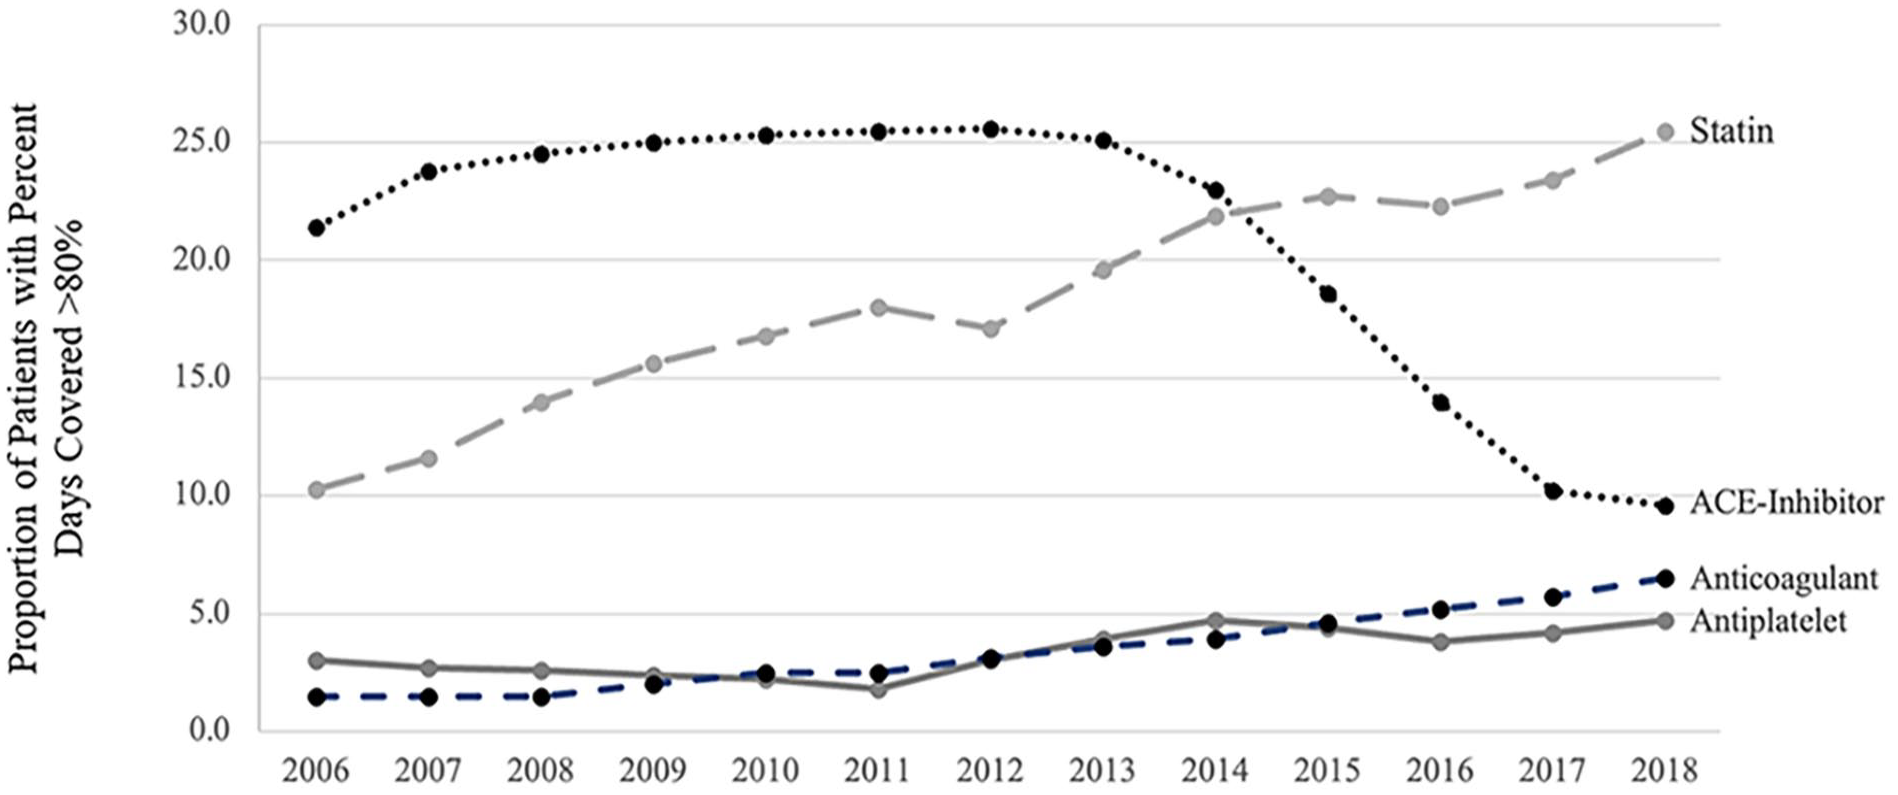
Proportion of patients with a PDC greater than 80% in the year following PAD diagnosis for four classes of medication.
Assessment of trends in mortality
Age-adjusted all-cause mortality rates at 1 year declined from 12.6% to 9.9% (p < 0.001) between 2006 and 2018 with similar trends observed in age-adjusted 5-year mortality rates (40.9% to 35.2%, p < 0.001) (Figure 3). In terms of crude mortality, the highest 1-year mortality rate of 14.6% occurred for patients who entered the cohort in 2006, and the lowest 1-year mortality rate of 9.5% was observed in 2016 and 2018 (Appendix B). From 2006 to 2018, there was a 5.1% absolute decline and a 35% relative reduction in 1-year all-cause mortality.
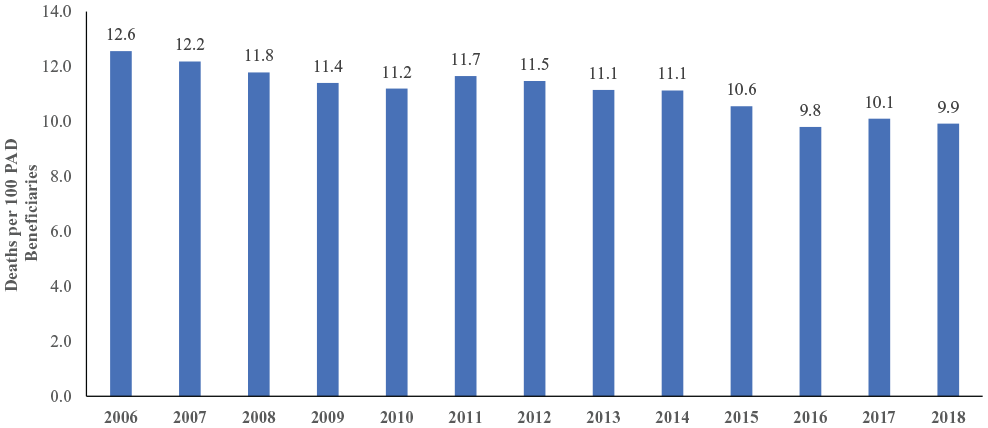
Trends in age-adjusted mortality over time for Medicare patients with peripheral artery disease from 2006 to 2018.
We next assessed 5-year all-cause mortality for this cohort of patients from 2006 to 2014. During this period, a total of 1,206,819 patients died within 5 years, for an overall 5-year all-cause mortality rate of 40.7%. The highest 5-year all-cause mortality rate of 46.2% occurred for patients who entered the cohort in 2006. The lowest 5-year all-cause mortality rate of 35.8% was for patients who entered the cohort in 2014, which was a 22.5% relative reduction over this period.
Regional trends in mortality and relationship to regional change in age at PAD diagnosis
Shown in Figure 4 are the hospital referral region-level rates of mortality change during the study period. Nearly all regions (296/306, 97%) had a decline in PAD mortality rates over time. In Figure 5, we plotted the regional change in PAD mortality against the regional changes in the age at diagnosis and noted that changes in age were directly correlated to change in PAD mortality (R2 = 0.29, p < 0.001).
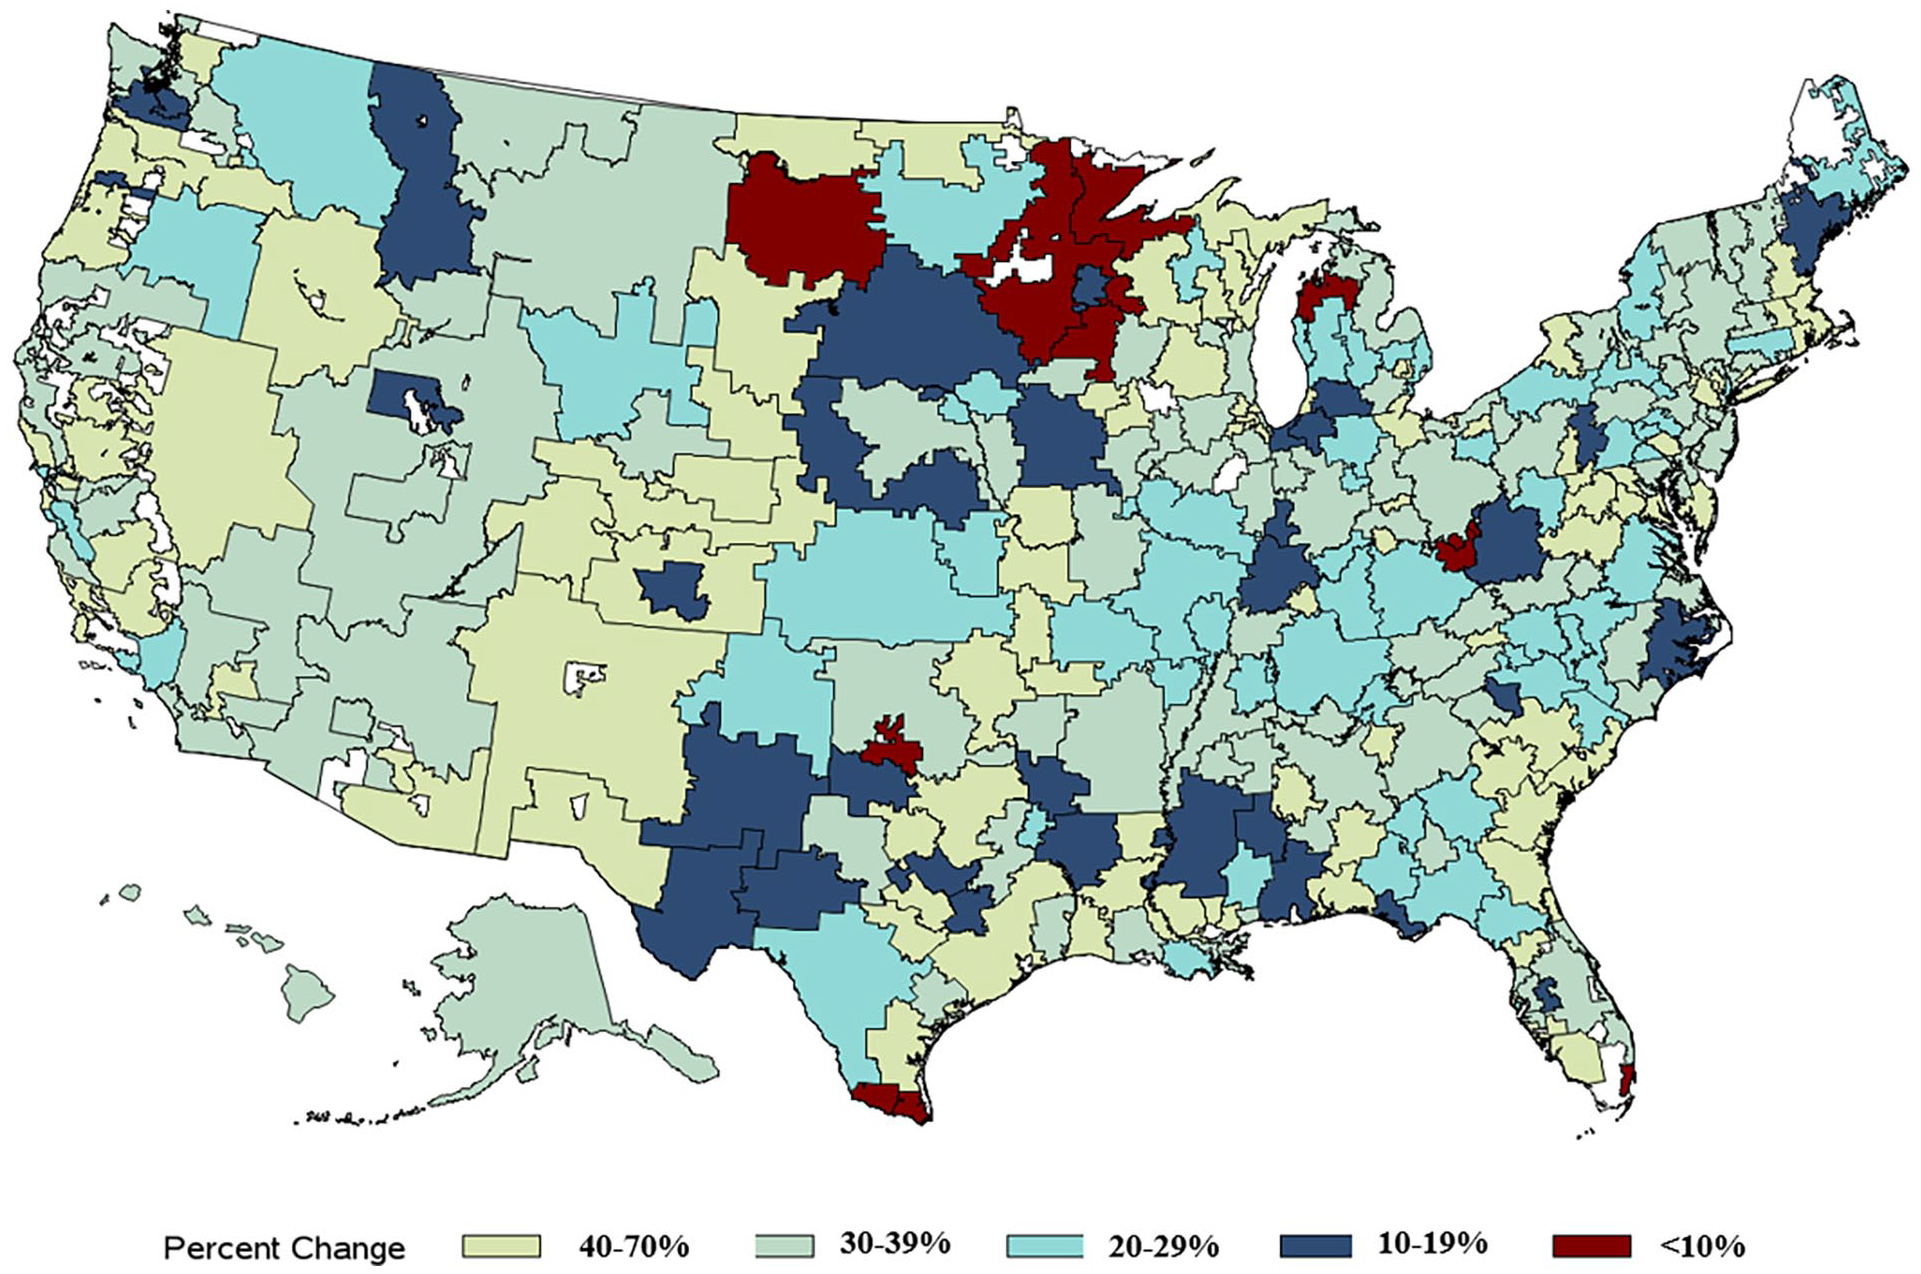
Regional changes in the 1-year mortality rate of patients with a new diagnosis code for peripheral artery disease between 2006 and 2018 in the United States.
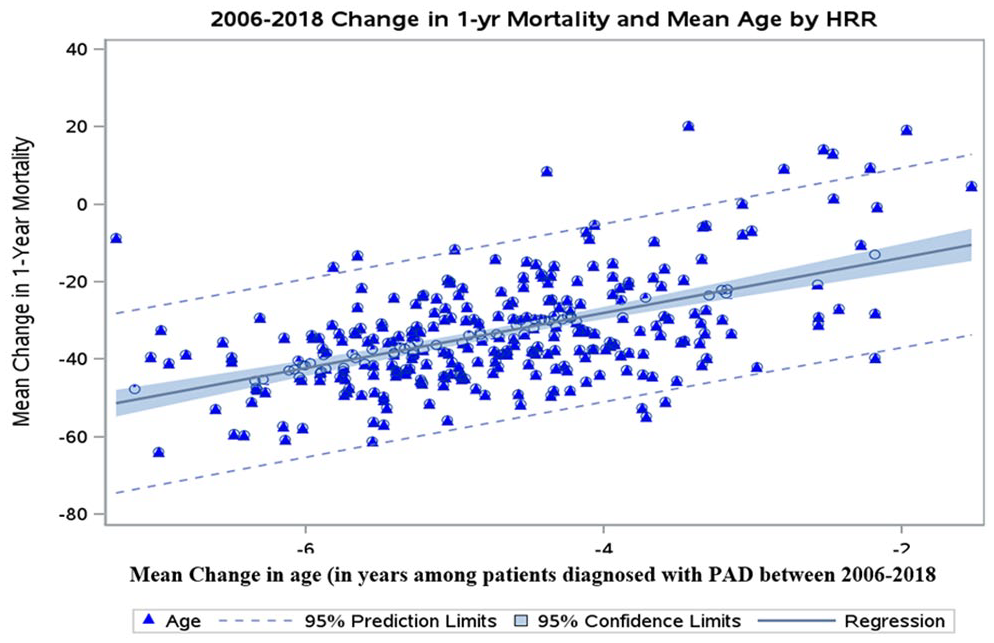
Relationships between the change in age, at the level of the hospital referral region (x-axis), and the change in 1-year mortality rate among patients with PAD, at the level of the hospital referral region, between 2006 and 2018 in the United States.
Models to identify factors associated with mortality
We performed Cox regression to examine factors which were associated with mortality at 1 and 5 years after diagnosis with PAD (Table 2 and Appendix F). We identified several factors which were associated with higher mortality among patients with PAD, including advanced age and the presence of comorbidities such as heart failure or cancer, where risks were nearly threefold higher in magnitude. Race/ethnicity was also one of the factors in this model. Declines in mortality were seen in almost all racial and ethnic subgroups, but these declines were smallest for Native American patients, and largest for White non-Hispanic patients. Asian/API (Asian/Pacific Islander) and Hispanic race/ethnicity were associated with a lower risk of 1-year mortality when compared to other racial and ethnic groups. We also examined the relationship between dispensing of certain medications such as statins and ACE-inhibitors and mortality, as well as the contribution of deaths with a preceding stroke or MI out of all deaths.
List of variables in the final model with associated hazard ratio at 1 year from any cause.
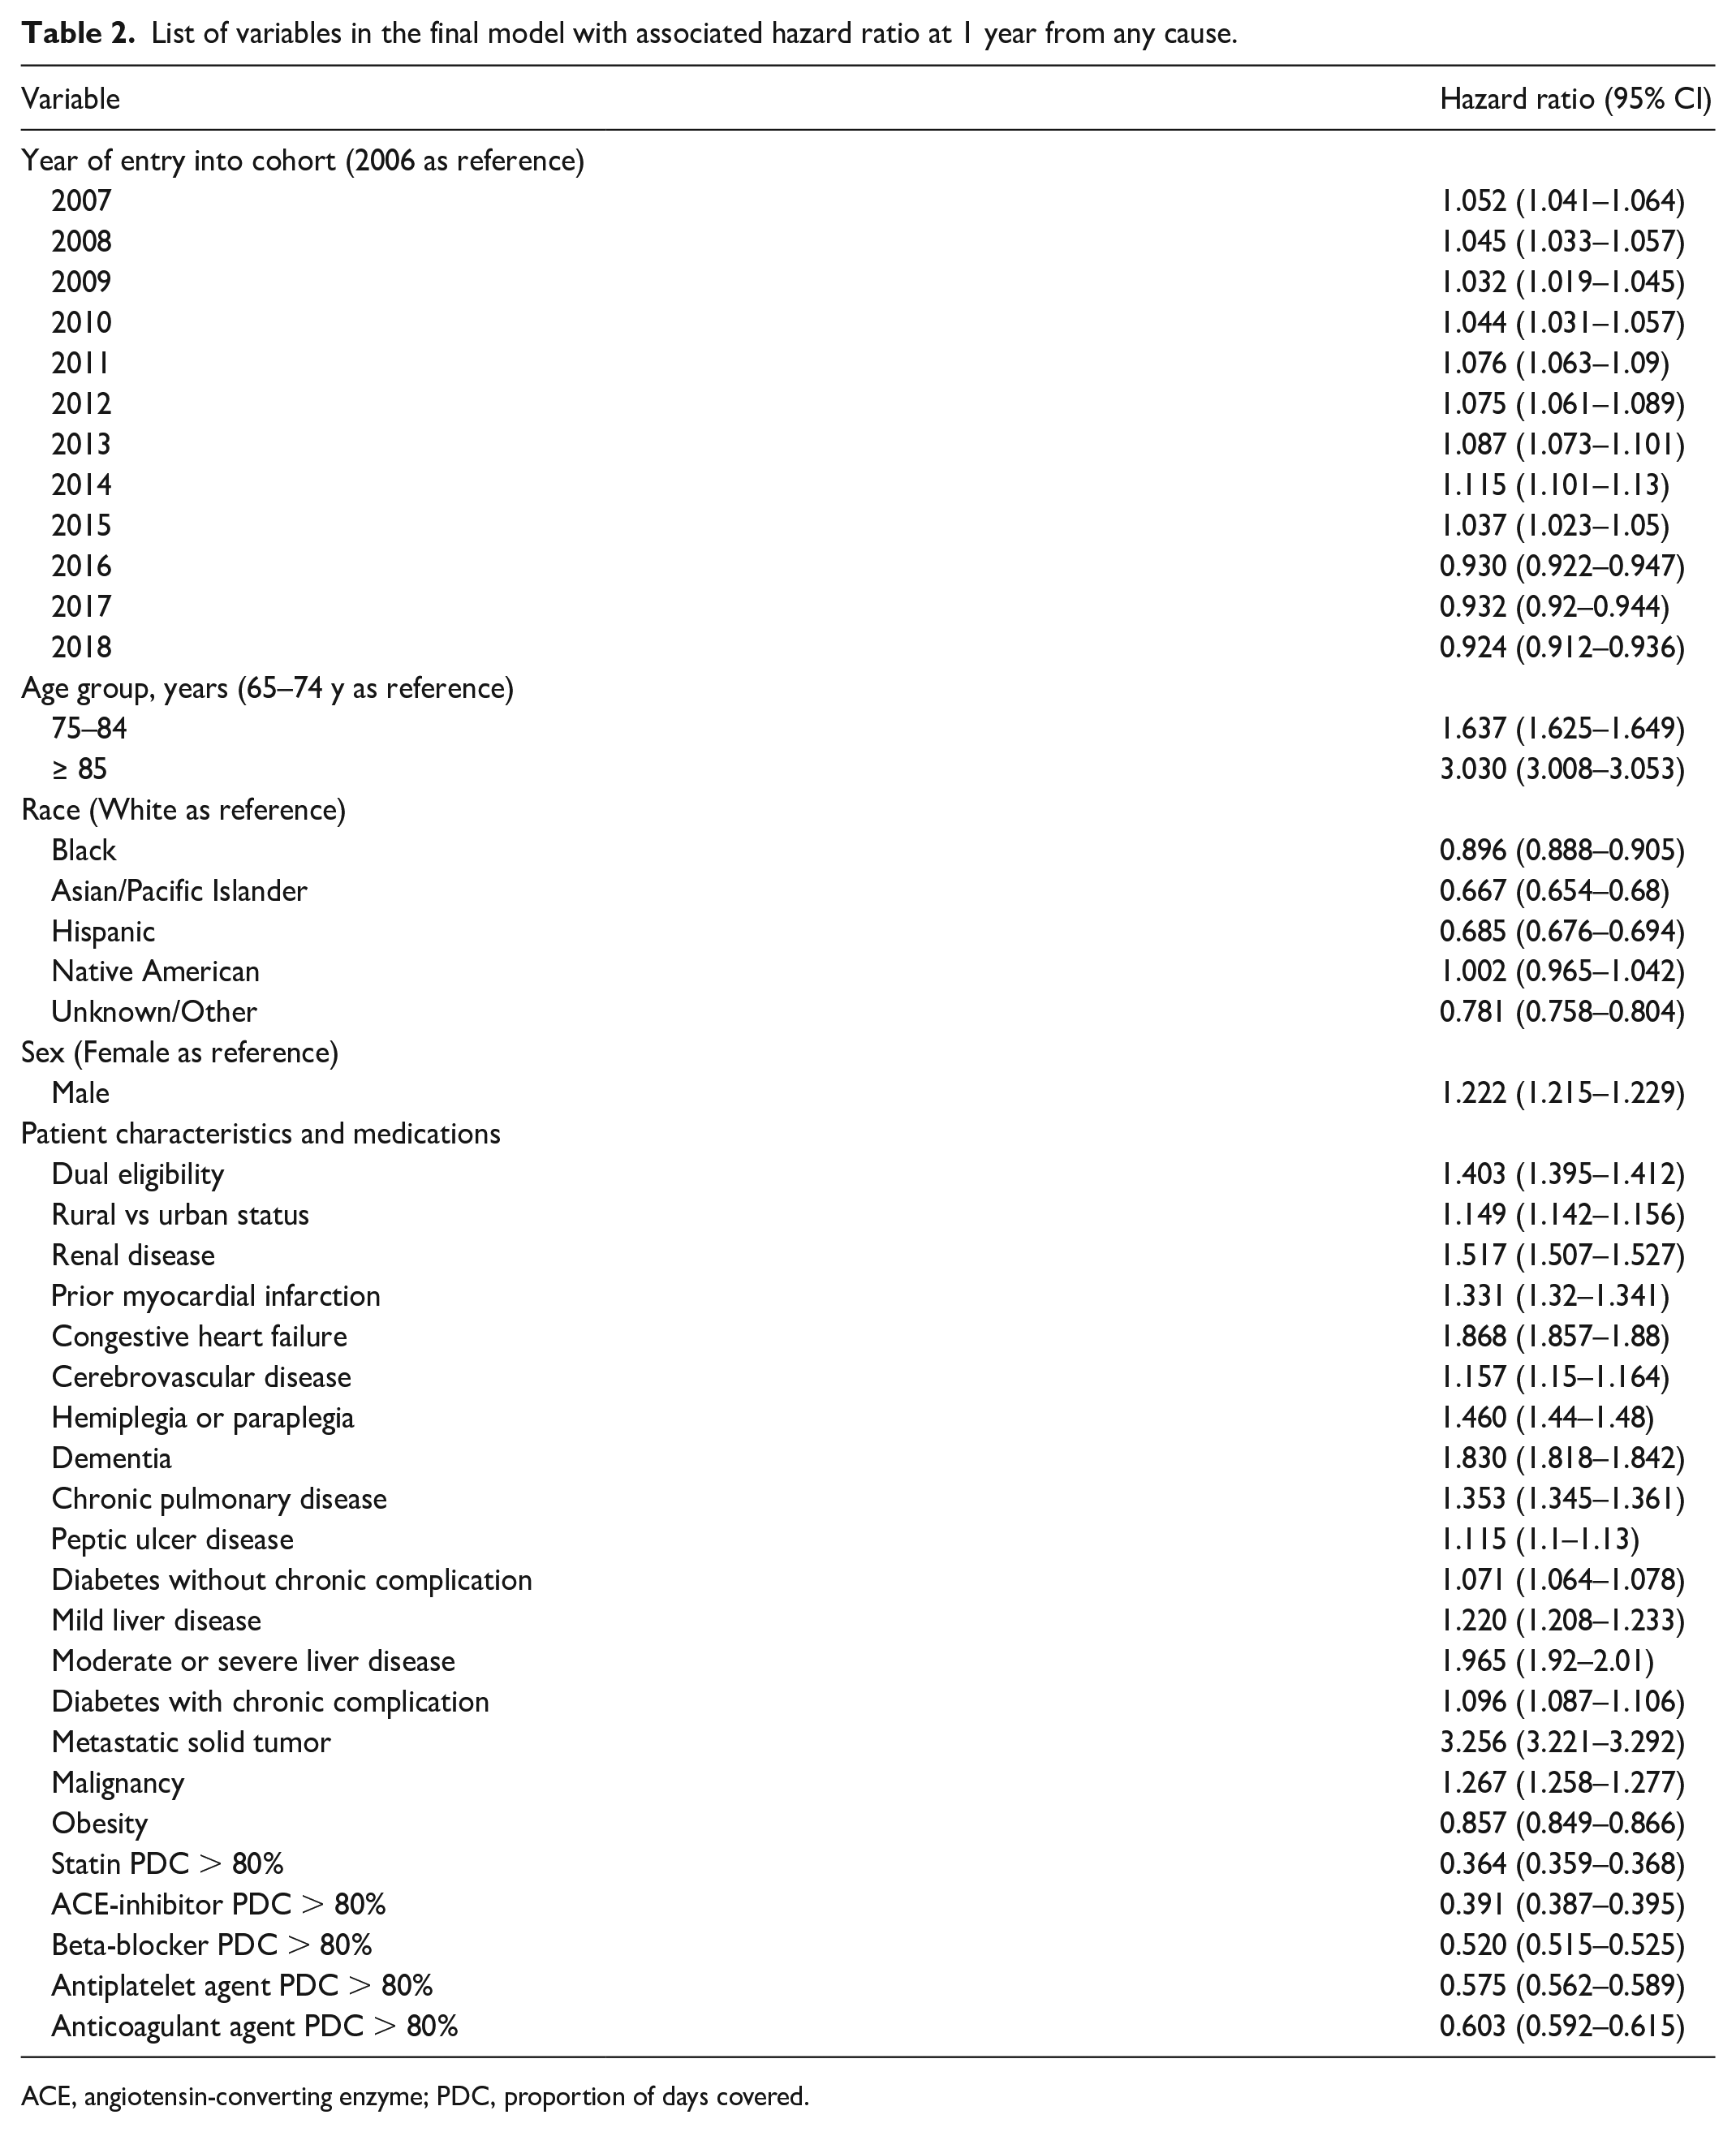
ACE, angiotensin-converting enzyme; PDC, proportion of days covered.
Each of the factors above, as well as sex and socioeconomic status, contributed in an additive manner to the overall model discrimination (receiver operator characteristic [ROC] = 0.8132) as shown in Appendix C. We repeated the regressions to examine factors which were associated with mortality following a cardiovascular event. When examining this mortality outcome, model discrimination decreased slightly (ROC = 0.7578) (Appendix G).
Trends in mortality among those with a prior cardiovascular event
Overall, 8.43% of patients who died (n = 258,914) experienced a cardiovascular event such as myocardial infarction or stroke within 30 days of their death. This represented 14.4% of the 1-year mortality among patients with PAD in 2006, but decreased to 11.6% by 2018, a 2.8% absolute decline in the proportion of deaths within 1 year in patients with PAD occurring with a recently preceding cardiovascular event (Appendix D).
Discussion
Our analysis of a cohort of US Medicare beneficiaries with a new diagnosis code for PAD between 2006 and 2018 demonstrated a 2.7% age-adjusted absolute decline in 1-year mortality, which represents a 21.4% relative reduction in mortality. These declines in mortality persisted after adjusting for the younger age of the cohort in later years and in sensitivity analyses limited to patients who died within 30 days of a cardiovascular event. Finally, multivariable models demonstrate that the observed reduction in mortality during the study was multifactorial and associated with patients’ younger age at diagnosis, changes in co-morbidity profiles, and higher rates of medication compliance.
Declines in mortality for patients with cardiovascular disease and stroke have been reported in the last 20 years,10–12,19 and have been associated with concomitant efforts in risk-factor reduction. 11 In the first 20 years of the 20th century, the decline in mortality for overall cardiovascular disease in most western nations was approximately 22% in relative terms, although important subgroups such as women and African American patients had less impressive declines. In relative terms, the decline in mortality among patients with PAD is strikingly similar to the declines seen in overall cardiovascular disease and stroke. As such, though some may interpret the 2.7% age-adjusted absolute decline in mortality among patients with PAD to be a modest gain, it may represent an important and iterative step forward in a high-risk population. Therefore, from our perspective, we feel our findings represent the positive impact of many years of collective efforts at prevention and treatment for patients with PAD who have experienced, in many ways, declines in mortality that are similar to other patients with atherosclerosis in other vascular beds.
These changes have largely evolved concomitantly with public awareness campaigns from multistakeholder patient-facing organizations. The American Heart Association and others have called for greater public awareness for the existence and diagnosis of PAD during the period examined in our study.30–33 Perhaps these public awareness efforts have helped achieve earlier recognition of PAD, and greater use of medical therapies targeting patients with PAD has had the opportunity to demonstrate its value and impact.
A greater awareness of increased options for noninvasive vascular testing and procedures may also drive patients and healthcare practitioners to recognize and treat PAD earlier. Recommendations from the US Preventative Services Task Force for patients with cardiovascular disease center on the evidence-based use of medications such as statins and antiplatelet agents. 34 These recommendations have translated into benefits for many patients with atherosclerosis, and newer trials have demonstrated the important role of oral anticoagulant medications as well.35,36 The American Heart Association has been a central driver of these initiatives, and professional societies involved in the treatment of patients with PAD should strive to emulate these efforts, especially through local and regional efforts in the highest risk regions across the United States.
Finally, the risk factors associated with worse survival were related to a variety of patient characteristics including their older age at diagnosis, comorbidities such as heart failure and chronic kidney disease, Native American or African American race, and the use of evidence-based medications. These factors have been reported previously, yet their relative importance in recent years, especially racial and ethnic subgroups such as Native Americans, provides context and guidance for the newest round of public awareness and intervention initiatives. Improving the delivery of these adjuncts, especially medication compliance, may serve as a new focus for clinicians and researchers, and these efforts should be applied to patients with PAD at the highest risk for mortality.
Our study has several limitations. First, our findings are limited to Medicare patients with a new diagnosis code for PAD using administrative billing codes. The demographics of this Medicare population (e.g., 81% White non-Hispanic, as defined by Medicare categories) may limit the applicability to other populations. 37 Second, given the administrative and observational nature of our data sources, the severity of PAD in each patient and other factors associated with disease severity, such as extent of glycemic control, could not be ascertained. Additionally, our analysis excludes non-FFS Medicare patients and Medicare patients less than 65 years old, which potentially serve as a source of bias in our results. Third, though we assessed medication dispensation using Part D data, this method is only able to capture prescriptions and medication dispensing for patients with Part D coverage, as over-the-counter medications such as aspirin are difficult to assess in these datasets.38,39 Fourth, our assessment of mortality associated with a cardiovascular event likely underestimates the true number of patients who experienced cardiovascular mortality. As we did not have direct access to patients’ cause of death, our study relied on patients having a cardiovascular event within the 30 days preceding their death. The proportion of cardiovascular deaths may seem low compared to other reports, but we used conservative estimates based on preexisting billing codes for cardiovascular disease; these estimates are undoubtedly lower than other methods which use less specific definitions.40,41 Finally, lead time bias may be evident in our associations between changes in age at diagnosis and mortality, and interactions between age, race, and comorbidities have changed over time in patients with PAD. Heterogeneity in the findings by year is potential evidence of this. 42 However, further clinical details would be necessary to determine if lead time bias was indeed present, and which racial group may be affected most by this phenomenon.
Conclusions
Our study describes a 2.7% age-adjusted absolute reduction in 1-year mortality among US Medicare patients diagnosed with PAD since 2006. This reduction in mortality appears to be multifactorial and is associated with patients’ younger age at diagnosis, their co-morbidity profile, and higher rates of dispensation of key classes of medications. A better understanding of the factors associated with mortality in patients with PAD will aid physicians in identifying those at highest risk, and provide targets for future interventions in improving outcomes in these high-risk groups.
Supplemental Material
sj-pdf-1-vmj-10.1177_1358863X241262330 – Supplemental material for Trends in patient characteristics and mortality among Medicare patients diagnosed with peripheral artery disease
Supplemental material, sj-pdf-1-vmj-10.1177_1358863X241262330 for Trends in patient characteristics and mortality among Medicare patients diagnosed with peripheral artery disease by Xavier Fowler, Kunal Mehta, Mark Eid, Barbara Gladders, Stephen Kearing, Kayla O Moore, Mark A Creager, Andrea M Austin, Mark W Feinberg, Marc P Bonaca, Philip Greenland, Mary M McDermott and Philip P Goodney in Vascular Medicine
Footnotes
Data availability statement
The data used in this work are publicly available for purchase from the Centers for Medicare & Medicaid Services. Our data use agreement limits the ability to share these data, but the codes used to build this cohort and perform these analyses can be made available upon request to the corresponding author.
Declaration of conflicting interests
The authors declared the following potential conflicts of interest with respect to the research, authorship, and/or publication of this article: Marc P Bonaca reports grant support to Brigham and Women’s Hospital (BWH) from AstraZeneca, Amgen, Daiichi Sankyo, and Merck and grant support to Colorado Prevention Center Clinical Research from AstraZeneca, Amgen, and Sanofi. Mary M McDermott has received grant funding from Helixmith and research support from Helixmith, ChromaDex, Mars, Inc., ArtAssist, and Reserveage. The remaining authors have no conflicts of interest.
Funding
This work was supported by the American Heart Association’s Strategically Focused Research Networks Grants (Bonaca PI, AHA 18SFRN3390008 and McDermott PI, AHA 18SFRN33900097).
Supplemental material
Supplemental material for this article is available online.
References
Supplementary Material
Please find the following supplemental material available below.
For Open Access articles published under a Creative Commons License, all supplemental material carries the same license as the article it is associated with.
For non-Open Access articles published, all supplemental material carries a non-exclusive license, and permission requests for re-use of supplemental material or any part of supplemental material shall be sent directly to the copyright owner as specified in the copyright notice associated with the article.