
Abstract
Background
Peripheral artery disease (PAD) is associated with modifiable atherosclerotic risk factors like hypertension, diabetes, hyperlipidemia, and smoking. However, the effect of risk factor control on outcomes and disparities in achieving control is less well understood.
Methods
All patients in an integrated, regional health system with PAD-related encounters, fee-for-service Medicare, and clinical risk factor control data were identified. Component risk factors were dichotomized into controlled and uncontrolled categories (control defined as low-density lipoprotein < 100 mg/dL, hemoglobin A1c < 7.0%, SBP < 140 mmHg, and current nonsmoker) and composite categories (none, 1, ⩾ 2 uncontrolled RFs) created. The primary outcome was major adverse vascular events (MAVE, a composite of all-cause mortality, myocardial infarction, stroke, and lower-extremity revascularization and amputation).
Results
The cohort included 781 patients with PAD, average age 72.5 ± 9.8 years, of whom 30.1% were Black, and 19.1% were Medicaid dual-enrolled. In this cohort, 260 (33.3%) had no uncontrolled risk factors and 200 (25.6%) had two or more uncontrolled risk factors. Patients with the poorest risk factor control were more likely to be Black (p < 0.001), Medicaid dual-enrolled (p < 0.001), and have chronic limb-threatening ischemia (p = 0.009). Significant differences in MAVE by degree of risk factor control were observed at 30 days (none uncontrolled: 5.8%, 1 uncontrolled: 11.5%, ⩾ 2 uncontrolled: 13.6%; p = 0.01) but not at 1 year (p = 0.08). risk factor control was not associated with outcomes at 1 year after adjustment for patient and PAD-specific characteristics.
Conclusions
risk factor control is poor among patients with PAD. Significant disparities in achieving optimal risk factor control represent a potential target for reducing inequities in outcomes.
Background
Peripheral artery disease (PAD) is characterized by atherosclerotic narrowing of lower-extremity arteries and affects more than 10 million Americans and 230 million people globally.1,2 Its presentation ranges from asymptomatic to disabling, and limb complications are associated with impaired quality of life, high healthcare costs, and significant morbidity and mortality.3–6 Disparities in outcomes by sex, race, rurality, and socioeconomic status have been noted; however, the complex interplay of demographic factors and PAD severity and treatment remains unclear.1,4,7,8 Improvements in PAD care and outcomes, including a reduction in inequities, are important targets of study for this growing health problem.
Several risk factors have been implicated in the development and progression of PAD, similar to atherosclerotic disease in other vascular beds. Hypertension (HTN), diabetes mellitus (DM), hyperlipidemia (HLD), and smoking are modifiable risk factors that contribute the majority of risk associated with developing PAD. 1 However, most previous analyses focus on the role of present comorbidities in PAD risk and outcomes rather than degree of control of these risk factors according to clinical guidelines.4,6,9–11
We aimed to describe demographic and disease-specific factors in achieving optimal risk factor control. We used clinical and laboratory data from electronic health records (EHR) coupled with Centers for Medicare and Medicaid Services (CMS) claims data to explore the role of risk factor control on longitudinal cardiovascular outcomes in a real-world cohort of patients with confirmed PAD. We hypothesized that optimal risk factor control is associated with fewer adverse cardiovascular and limb events in patients with PAD but is unequally achieved across our integrated health system.
Methods
Study population
This retrospective cohort study was approved by the Duke Health Institutional Review Board. Patients were selected from Duke University Health System (DUHS), comprising three hospitals and over 140 primary and specialty clinics in a network dispersed across North Carolina.
Patients with PAD were identified from a data warehouse query of the DUHS EHR. Eligible patients had one or more clinical encounters with PAD-related International Classification of Disease (ICD)-9 or ICD-10 diagnosis codes documented in the EHR between January 1, 2015 and March 31, 2016 (list of diagnosis codes available in online Supplementary Table 1). The index encounter date was defined as the discharge or departure date of the earliest PAD encounter in the study period, meaning that the majority of patients had prevalent PAD rather than incident PAD. PAD was clinically adjudicated through a multistep algorithmic reduction process using a method that has previously been described.8,12 PAD was defined as having one of four clinical criteria: (1) an abnormal ankle–brachial index (ABI, abnormal defined as ⩽ 0.9 or > 1.4); (2) imaging (computed tomography angiography, invasive peripheral angiography, magnetic resonance angiography or lower-extremity ultrasound) that demonstrated significant arterial stenosis (defined as ⩾ 50% stenosis); (3) prior lower-extremity revascularization; or (4) prior nontraumatic lower-extremity amputation for symptomatic PAD.
In order to assess outcomes longitudinally, we included patients who were enrolled in fee-for-service Medicare during the index encounter as well as continuously enrolled in the year prior and also had documented clinical and laboratory data in the 2 years prior to the index encounter to determine control of risk factors of interest. Patients missing clinical or laboratory data for any of the studied risk factors were excluded (Figure 1). Eligible patients had at least one outpatient systolic blood pressure (SBP) and at least one low-density lipoprotein (LDL) value. Additionally, patients were eligible for the study if (1) there was at least one documented hemoglobin A1c (HbA1c) value regardless of history of DM or (2) no documented HbA1c value and no history of DM. Patients with a history of DM but no documented HbA1c in the 2 years prior to the index encounter were excluded. 13 Eligible patients also had documentation of tobacco use (none, former, current).
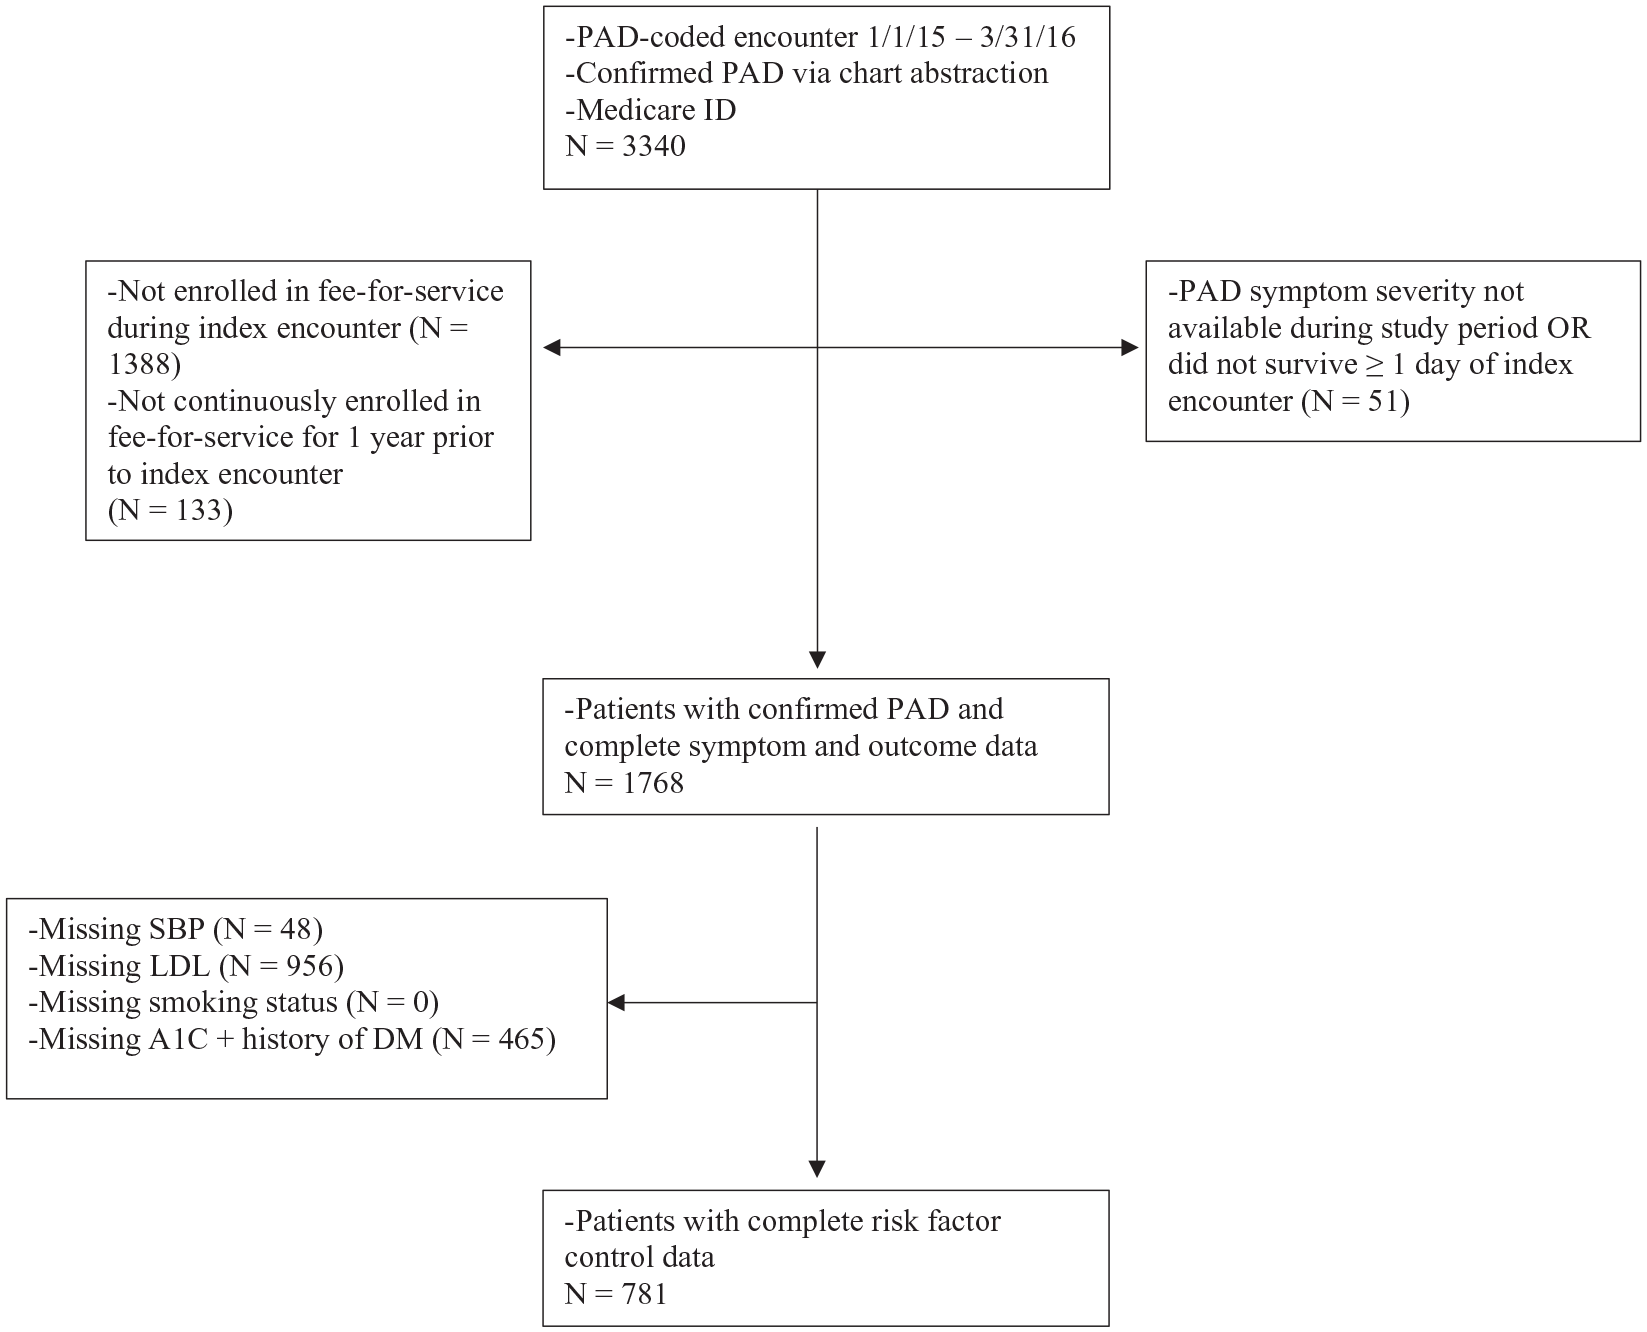
Ascertainment of the study population.
Study variables
Smoking status was manually abstracted from the EHR, whereas SBP and lab values (HbA1c, LDL) were extracted using an extraction tool from the Duke Enterprise Data Unified Content Explorer (DEDUCE) data warehouse. 14 A review of patients with no lab values extracted by DEDUCE was performed to manually abstract missing data. PAD-specific characteristics were manually abstracted during the clinical adjudication process. These included the most severe PAD symptom (asymptomatic, intermittent claudication (IC), or chronic limb-threatening ischemia (CLTI)) during the study period.
Other study variables included demographic characteristics of patients (age, sex, race), geographic region (rurality), socioeconomic status (census-tract or county-level median household income), and insurance coverage (Medicaid dual enrollment), which were collected from Medicare files, EHR data, and American Community Survey tables as available. In accordance with the CMS cell size suppression policy that requires removal of cell counts < 11, values of 1–10 were removed and other cells were represented as ranges to prevent the derivation of suppressed cells. 15 Statin use at any time prior to the index encounter, as documented in the EHR, was reported as a way to give a general sense of guideline-based medication use. Use of other medications was not reported due to concerns about incomplete EHR documentation, fragmentation of patient care across multiple health systems, and lack of adherence and persistence data. Comorbid conditions were obtained from inpatient, outpatient, and carrier claims from the year prior to the index encounter using validated algorithms for cancer, cerebrovascular disease (CBVD), chronic obstructive pulmonary disease (COPD), congestive heart failure (CHF), dementia, DM, HTN, ischemic heart disease (IHD), renal disease, and the Charlson Comorbidity Index.13,16,17
Exposure definition
Degree of control for each risk factor in the period 2 years prior to the index encounter was dichotomized into controlled or uncontrolled categories, and patients were grouped by the number of uncontrolled risk factors (none, 1, ⩾ 2 uncontrolled risk factors). Risk factor control was dichotomized using clinical practice guideline recommendations instead of using risk factor values as continuous variables. Control was defined as LDL < 100 mg/dL (< 2.59 mmol/L), HbA1c < 7.0%, SBP < 140 mmHg, and tobacco use history of current nonsmoker (never or former). Control thresholds were selected based on reasonable clinical targets outlined by contemporary guidelines during the lookback period. 11 Only SBP values from outpatient encounters were obtained, whereas HbA1c and LDL values were obtained from both inpatient and outpatient encounters. SBP values > 300 mmHg (none), LDL values > 500 mg/dL (35), and HbA1c values > 15% (1) were excluded as physiologically implausible. For continuous risk factor variables with multiple measurements per patient, control was determined by whether the majority of values fell into the controlled or uncontrolled category. In cases of a tie, the oldest value was dropped and the control category was reassessed. Patients without a documented HbA1c value and no history of DM were imputed to controlled HbA1c.
Outcome definitions and ascertainment
The primary outcome was major adverse vascular events (MAVE), a composite of all-cause mortality, myocardial infarction (MI), stroke, lower-extremity revascularization, and lower-extremity amputation. Secondary outcomes included major adverse cardiovascular events (MACE, a composite of all-cause mortality, MI, and stroke) and major adverse limb events (MALE, a composite of lower-extremity revascularization and amputation). Secondary outcomes also included individual components for each composite plus all-cause hospitalization. Composite event dates were determined by the earliest occurring component outcome. Outcome events were ascertained by searching inpatient, outpatient, Master Beneficiary Summary File, and carrier files in the 100% Medicare claims data from 2014 through 2017. Outcomes were assessed through 1 year following the index encounter.
Statistical analysis
Baseline characteristics of the study cohort were described overall and stratified by number of uncontrolled risk factors (none, 1, or ⩾ 2) using proportions for categorical variables and means with SDs or medians with quartiles for continuous variables. Group differences were evaluated using chi-squared tests for categorical variables and Kruskal–Wallis tests for continuous variables.
Cumulative incidence for mortality at 30 days and 1 year from the index encounter date were calculated using Kaplan–Meier estimates. Group differences by number of uncontrolled risk factors (none, 1, or ⩾ 2) were calculated using the log-rank test. For all other outcomes (MAVE, MACE, MALE, component events, and all-cause hospitalization) the cumulative incidence function was used to account for the competing risk of death and group differences were evaluated using Gray’s test.
Cox proportional hazards regression models were used to evaluate the association of risk factor control and baseline characteristics with composite outcomes and all-cause hospitalization by 1 year. These models were adjusted using patient characteristic covariates. Two models were constructed for each outcome: the first model adjusted for control of individual component risk factors and the second model adjusted for a single overall risk factor control variable (none, 1, or ⩾ 2 risk factor uncontrolled). The two models explored the effects of individual component risk factor control and composite control, respectively. For all results, cell values of 1–10 were suppressed or represented as a range of values in accordance with CMS cell suppression policy. All analyses were completed using SAS software, version 9.4 (SAS Institute Inc., Cary, NC, USA).
Results
Patient characteristics
A total of 3340 patients with confirmed PAD and Medicare were identified during the study period, of which 1768 had complete symptom and outcome data. Of these, 781 patients with complete data to determine risk factor control during the 2 years prior to the index date were included in the cohort (Figure 1). Patients with incomplete risk factor control data (n = 987) differed significantly from those with complete risk factor data across several demographic, geographic, socioeconomic, PAD symptom, and medical history baseline characteristics (Table 1).
Baseline characteristics of patients with peripheral artery disease included and excluded from the cohort.
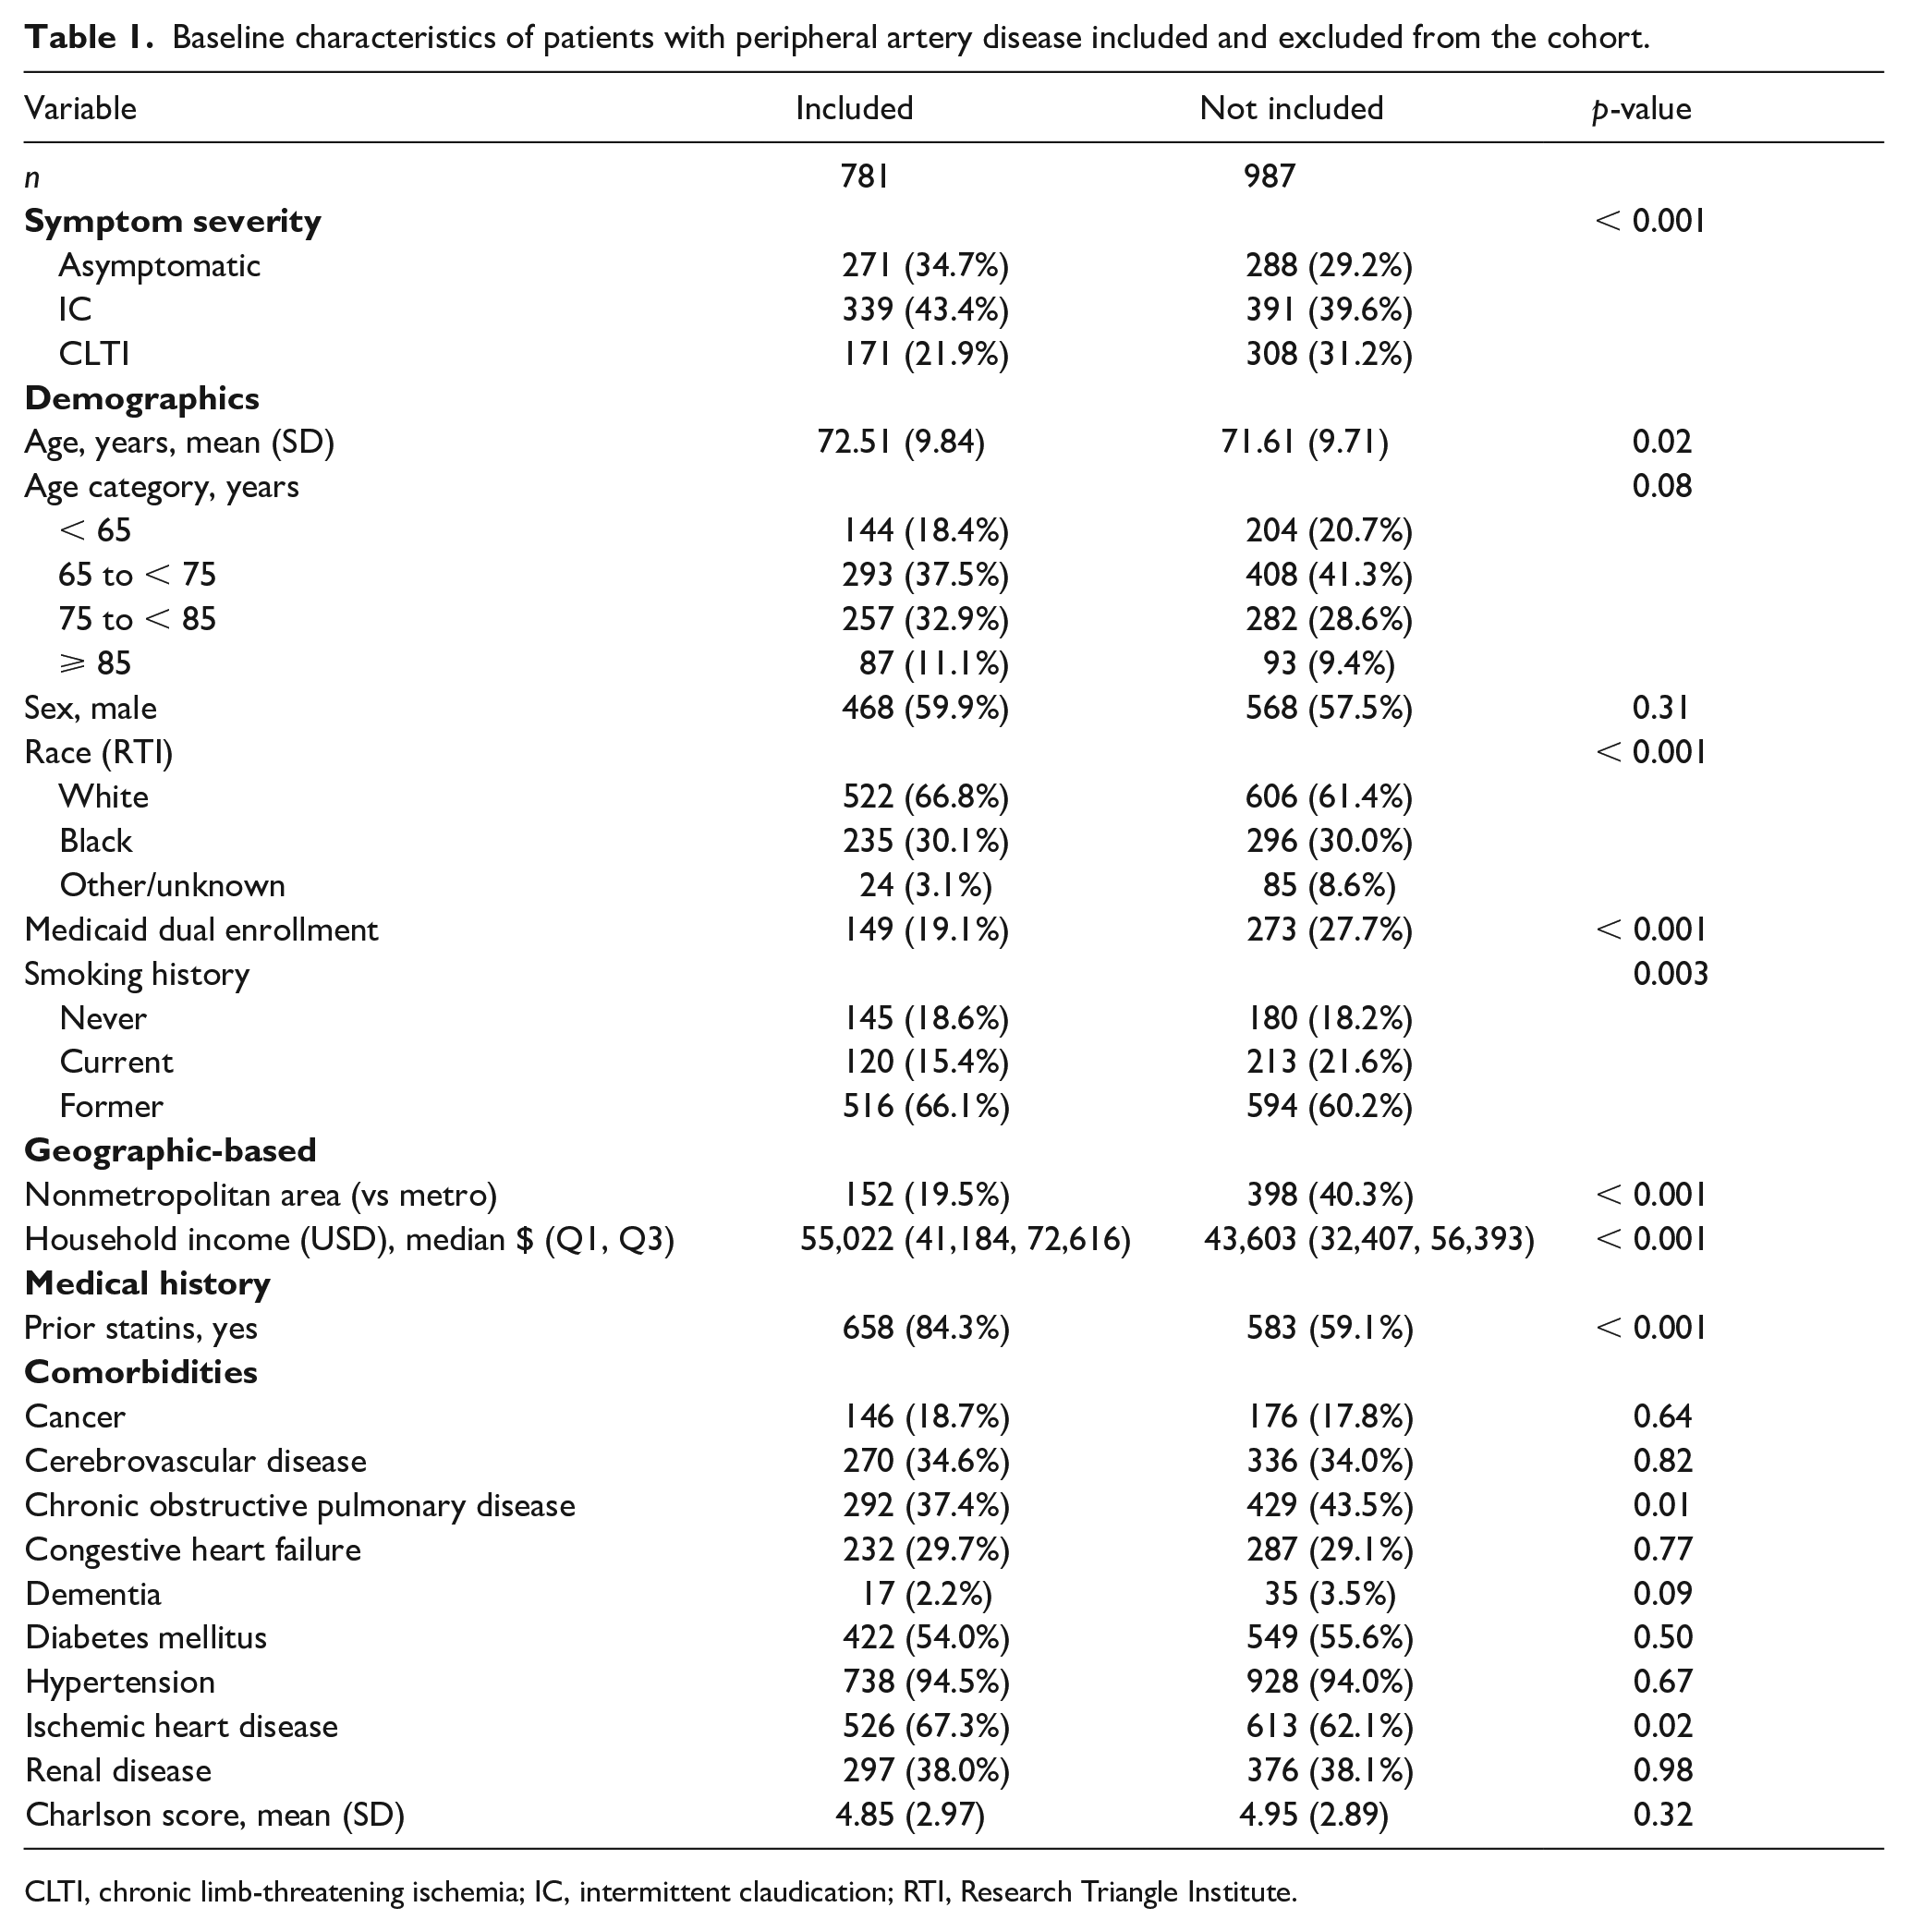
CLTI, chronic limb-threatening ischemia; IC, intermittent claudication; RTI, Research Triangle Institute.
A total of 260 (33.3%) patients had no uncontrolled risk factors, 321 (41.1%) had one uncontrolled risk factor, and 200 (25.6%) had two or more uncontrolled risk factors (Table 2). HTN was the risk factor most likely to be uncontrolled (33.6% of patients with one uncontrolled risk factor and 68.5% with two or more uncontrolled risk factor) whereas tobacco use was the least likely to be uncontrolled (11.5% and 41.5% of patients in one and two or more uncontrolled risk factor groups were currently smoking, respectively).
Baseline characteristics of patients with peripheral artery disease, by number of uncontrolled risk factors.
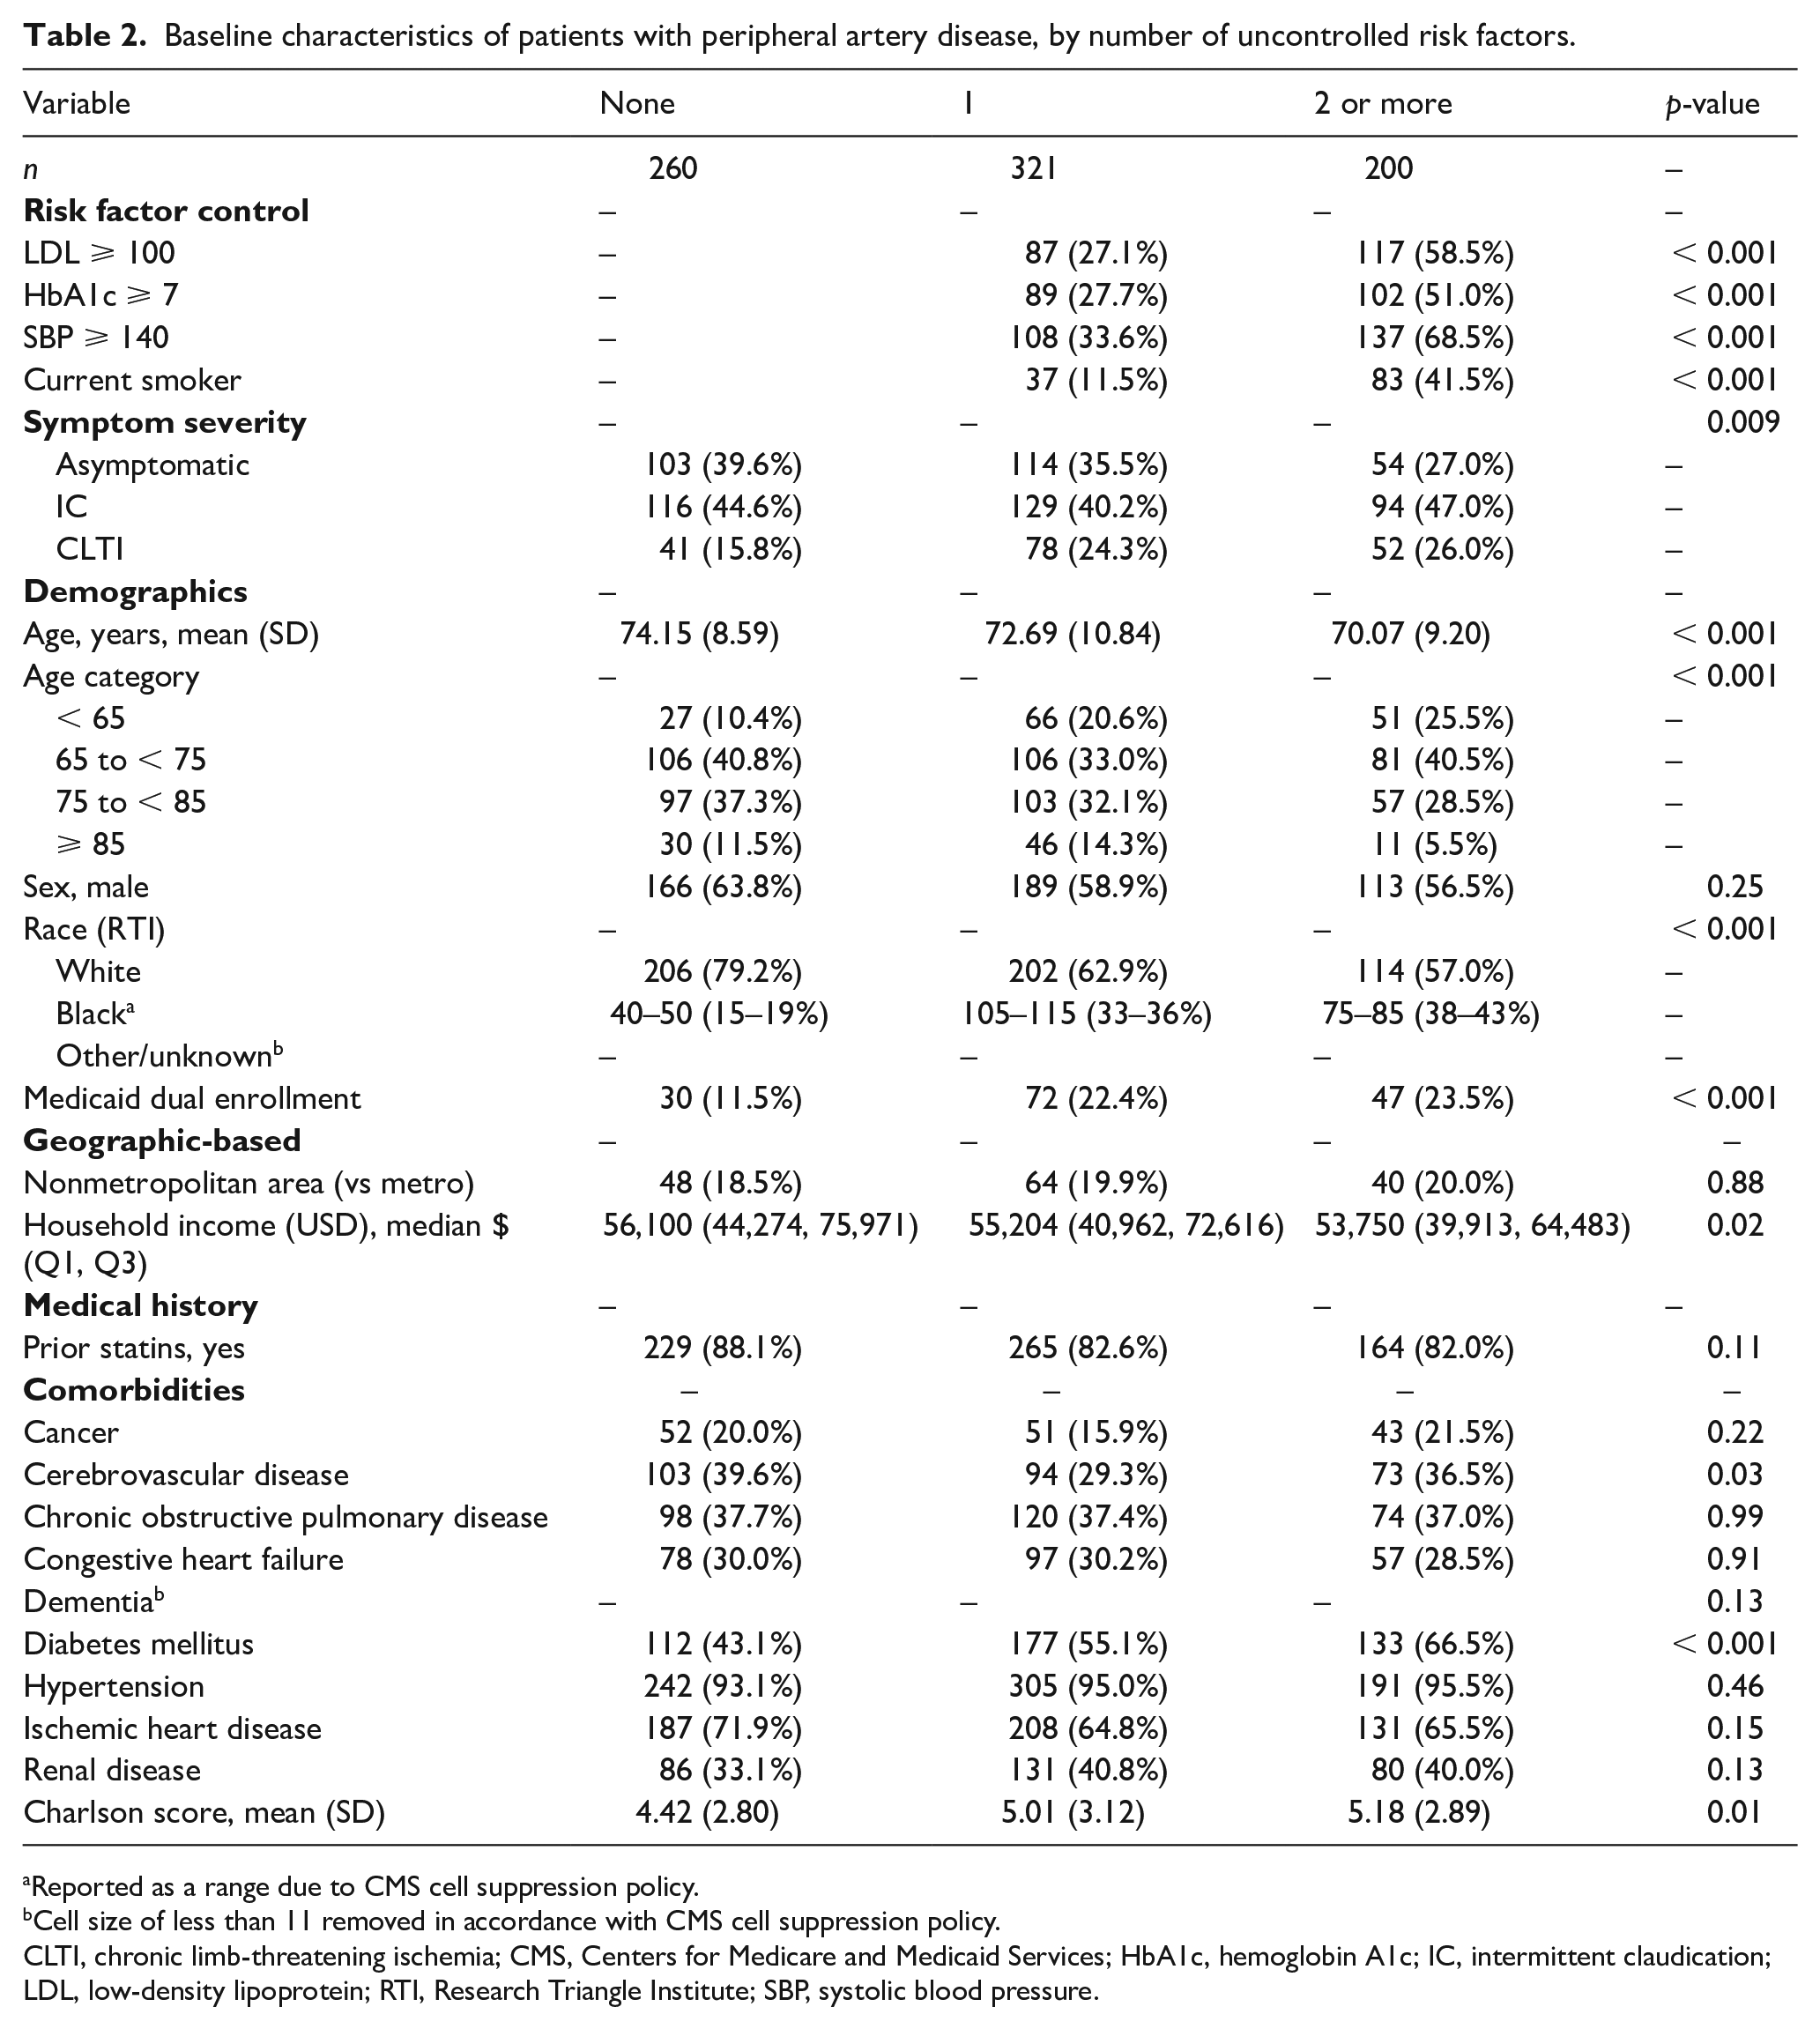
Reported as a range according to CMS cell suppression policy.
Cell size of less than 11 removed in accordance with CMS cell suppression policy.
CLTI, chronic limb-threatening ischemia; CMS, Centers for Medicare and Medicaid Services; HbA1c, hemoglobin A1c; IC, intermittent claudication; LDL, low-density lipoprotein; RTI, Research Triangle Institute; SBP, systolic blood pressure.
The average age overall was 72.5 ± 9.8 years but differed by degree of risk factor control, with patients with complete risk factor control being older, on average, than patients with two or more uncontrolled risk factors (p < 0.001). Patients with the poorest risk factor control were more likely to be Black (38–43%, p < 0.001) and dual Medicaid enrolled (23.5%, p < 0.001) than were patients with optimal control. Overall, 19.5% of patients lived in nonmetropolitan areas, which did not differ by degree of risk factor control (p = 0.88). Median census-tract income per group ranged from $56,100 (IQR $44,274, $75,971; none uncontrolled) to $53,650 (IQR $39,913, $64,483; ⩾ 2 uncontrolled; p = 0.02).
PAD symptom severity significantly differed between groups (Table 2; p = 0.009). Patients with two or more uncontrolled risk factors were more likely to have CLTI and less likely to have asymptomatic disease compared to patients with optimal control (CLTI 26.0% (⩾ 2 uncontrolled) vs 15.8% (none uncontrolled); asymptomatic 27.0% (⩾ 2 uncontrolled) vs 39.6% (none uncontrolled)).
Clinical outcomes
The cumulative incidence of outcomes are shown in Table 3 and Figure 2. Patients with two or more uncontrolled risk factors were more likely to experience MAVE by 30 days (none uncontrolled: 5.8%, 1 uncontrolled: 11.5%, ⩾ 2 uncontrolled: 13.6%; p = 0.01). A high rate of MAVE was observed by 1 year, with numerically higher MAVE rates with less risk factor control (none uncontrolled: 31.4%, 1 uncontrolled: 34.2%, ⩾ 2 uncontrolled: 40.5%; p = 0.08).
Observed cumulative incidence of each composite event type at 30 days and 1 year, by number of uncontrolled risk factors.
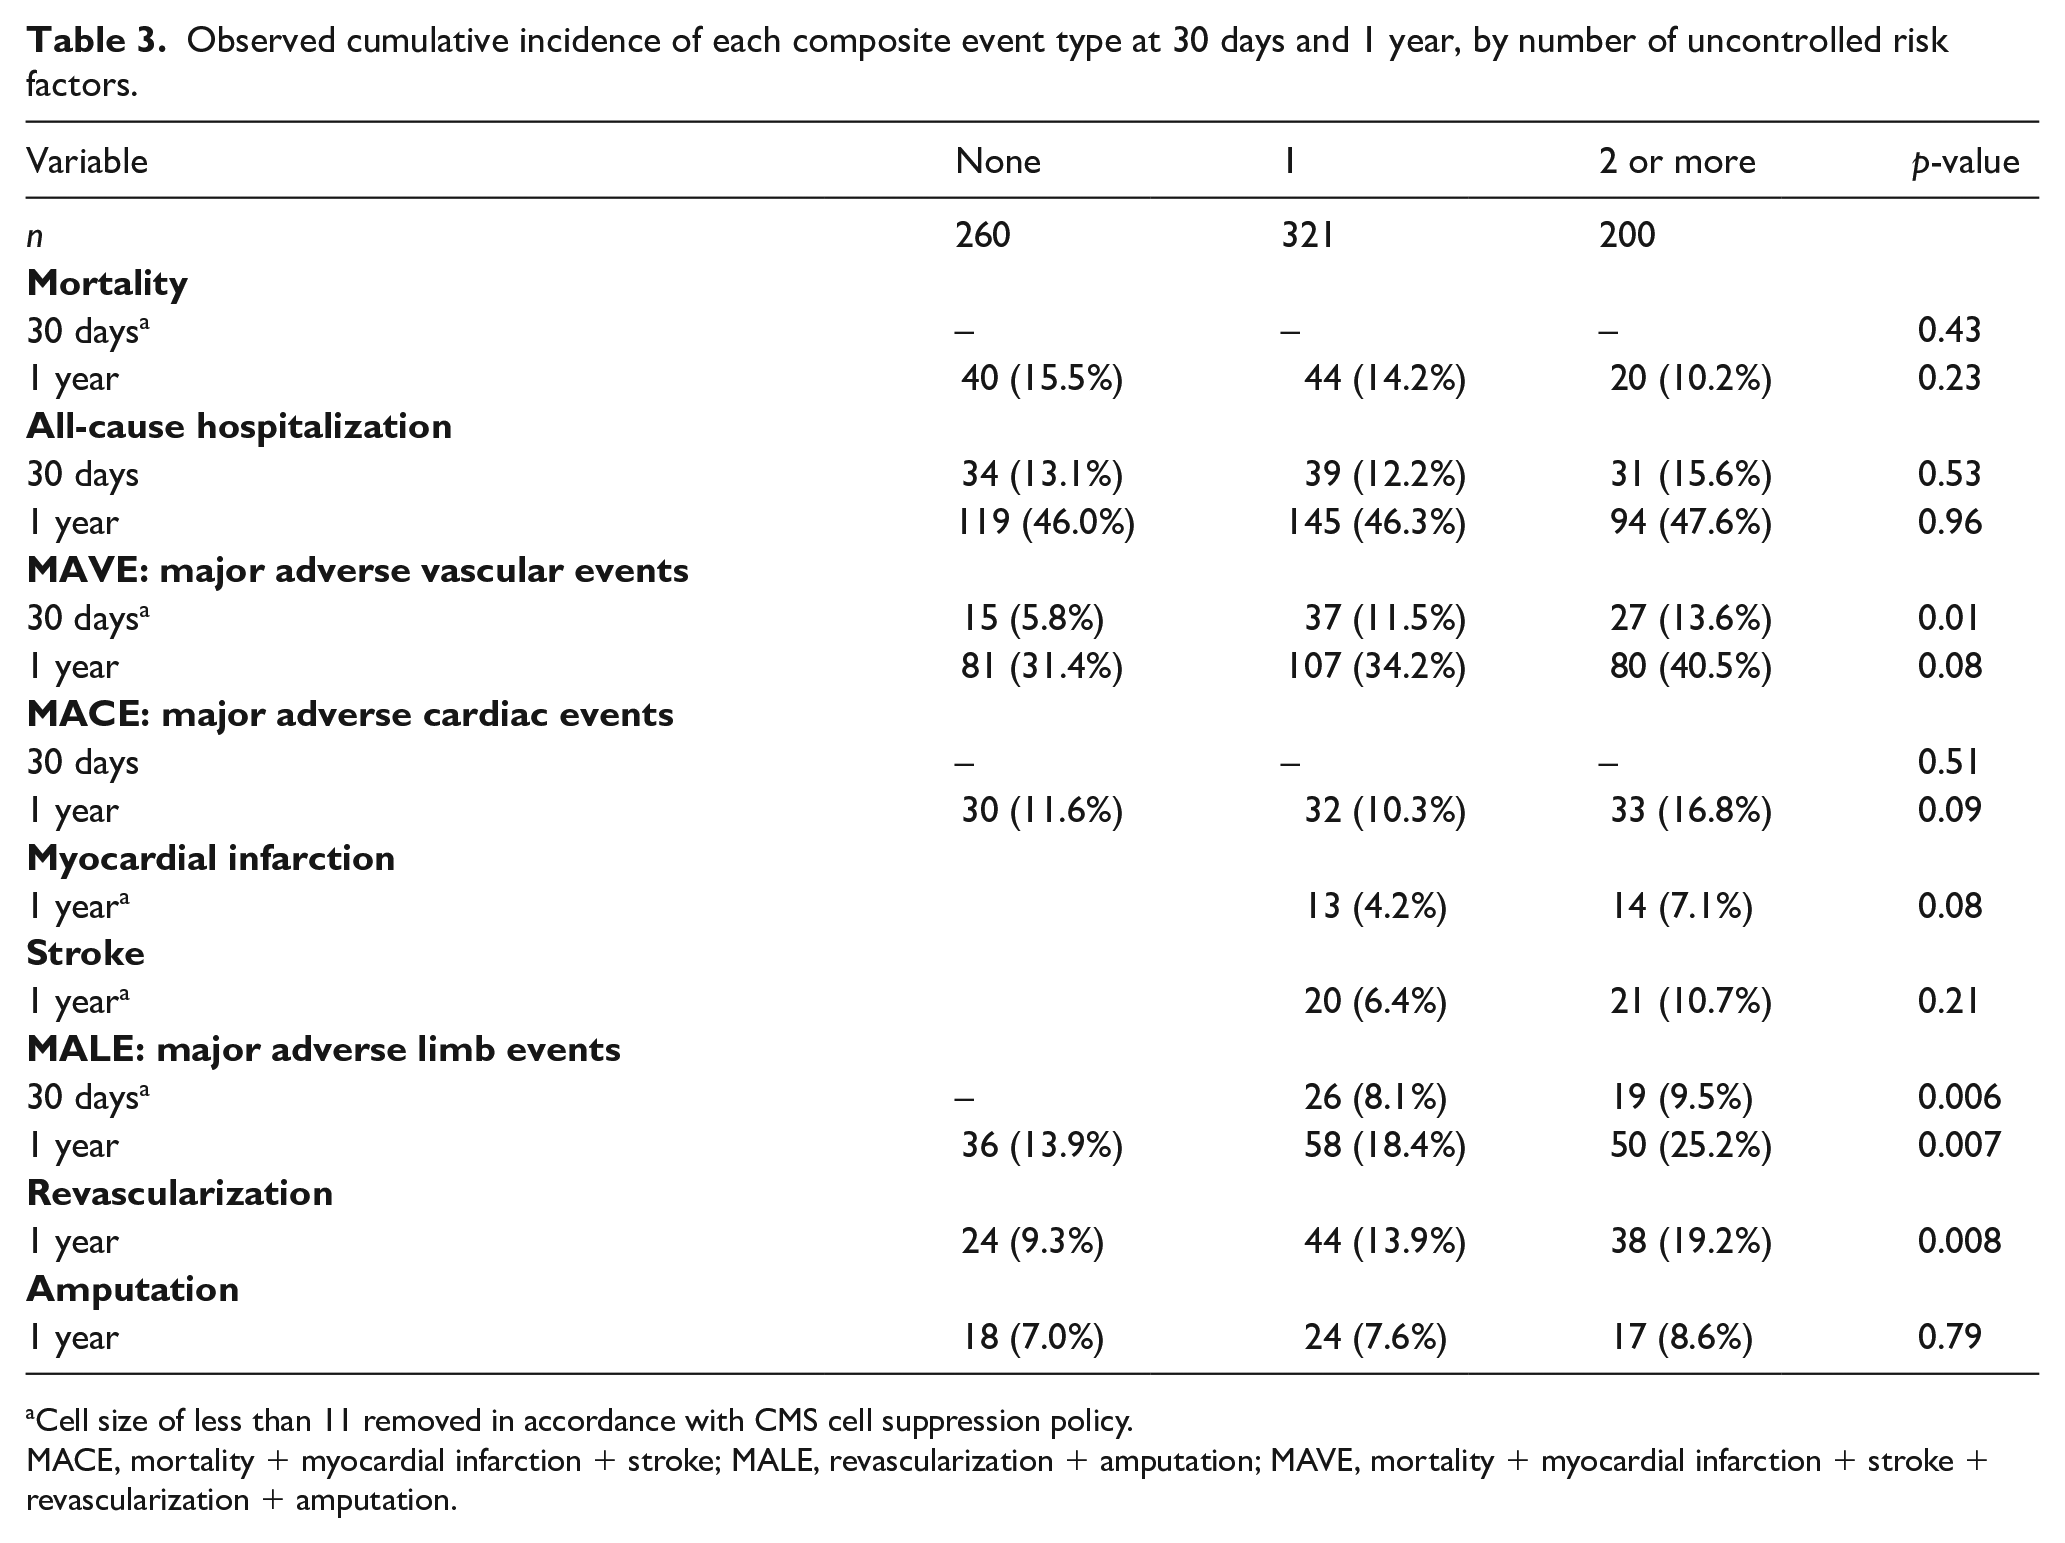
Cell size of less than 11 removed in accordance with CMS cell suppression policy.
MACE, mortality + myocardial infarction + stroke; MALE, revascularization + amputation; MAVE, mortality + myocardial infarction + stroke + revascularization + amputation.
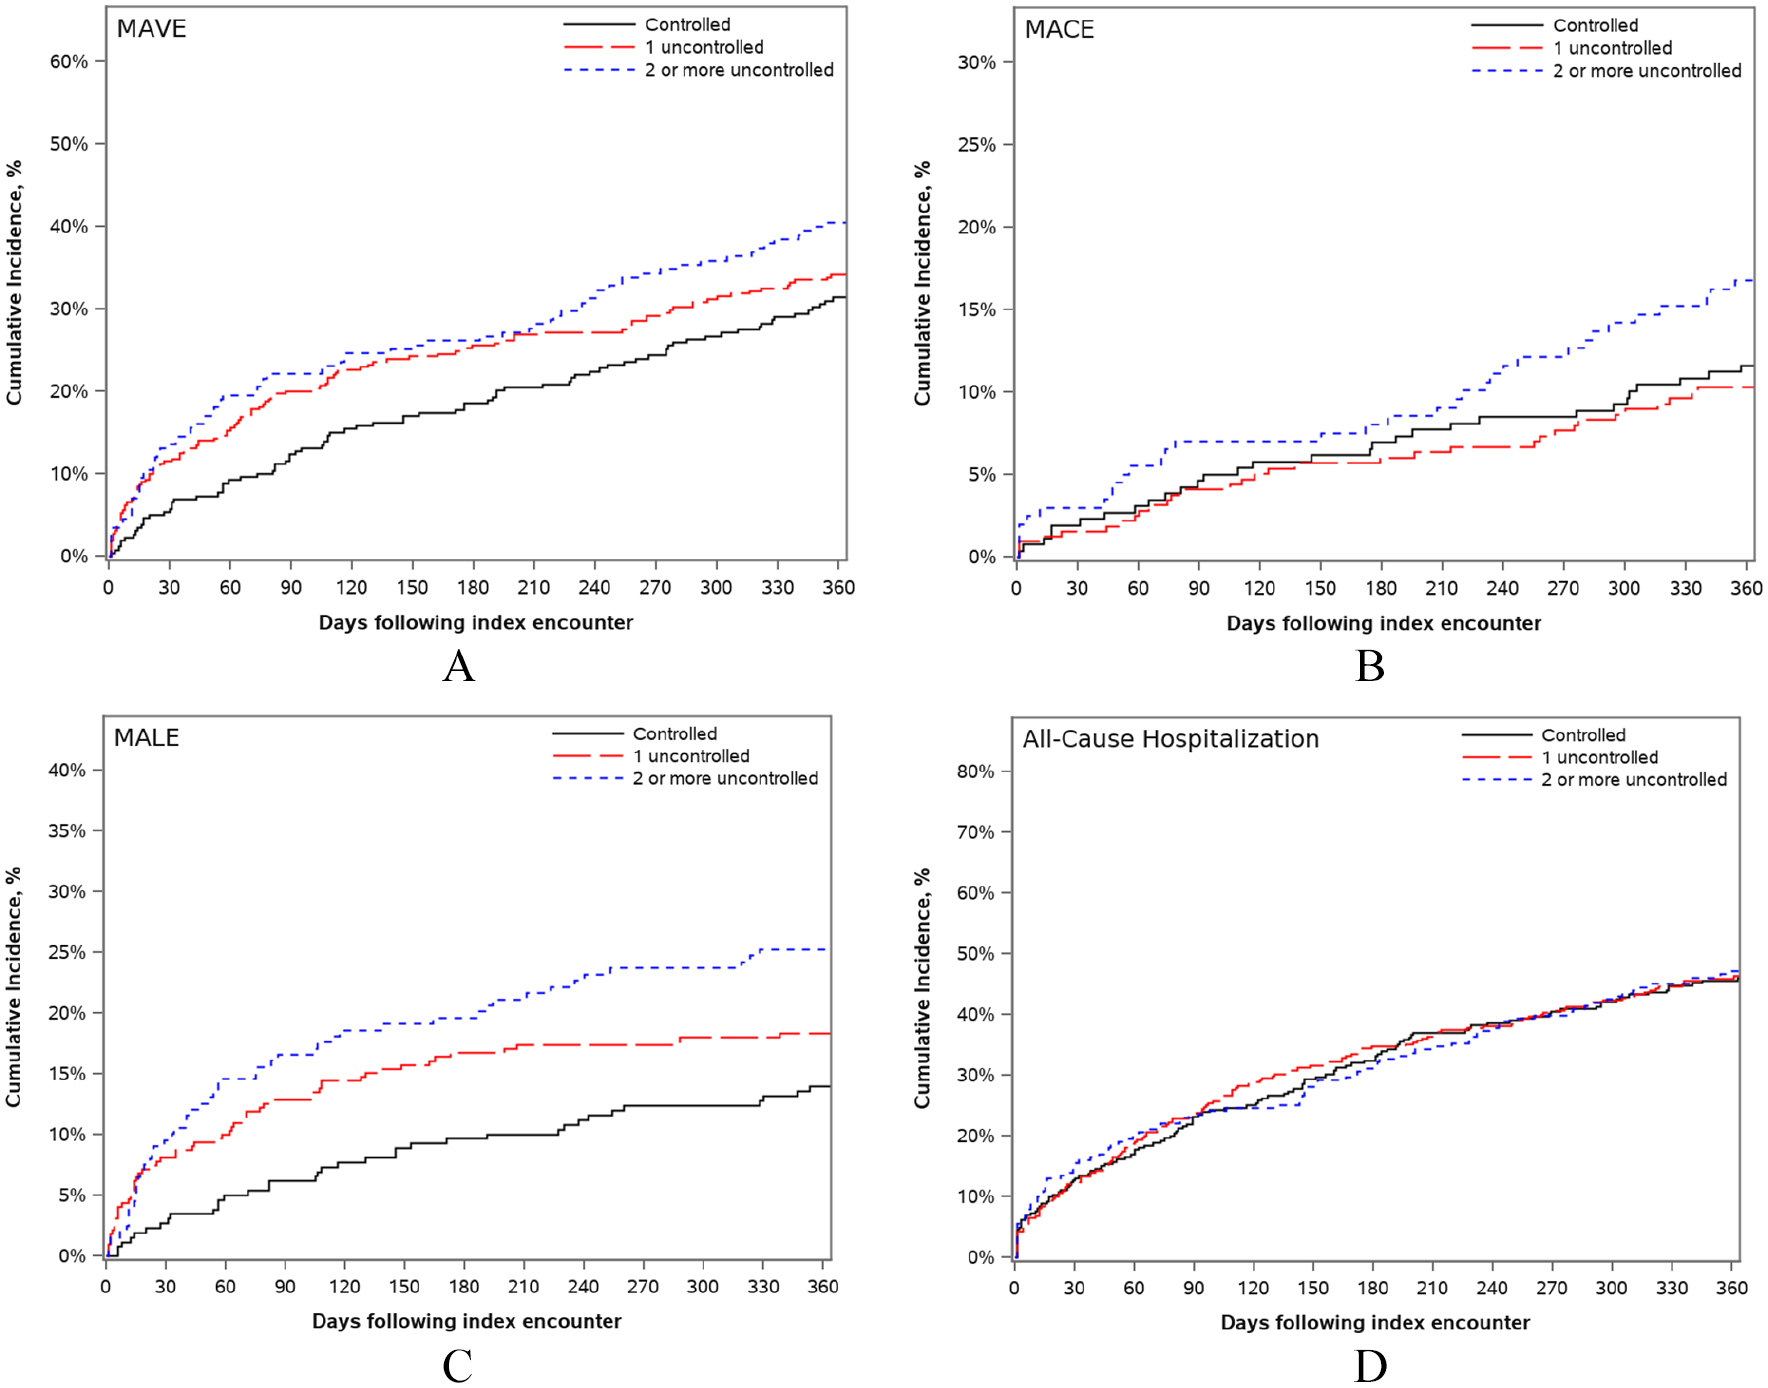
Cumulative incidence curves for
Significant differences in MALE were observed between groups by both 30 days (none uncontrolled: suppressed (due to CMS policy), 1 uncontrolled: 8.1%, ⩾ 2 uncontrolled: 9.5%; p = 0.006) and 1 year (none uncontrolled: 13.9%, 1 uncontrolled: 18.4%, ⩾ 2 uncontrolled: 25.2%; p = 0.007). This was driven by rates of lower-extremity revascularization at 1 year (none uncontrolled: 9.3%, 1 uncontrolled: 13.9%, ⩾ 2 uncontrolled: 19.2%; p = 0.008). No significant differences in rates of lower-extremity amputation were observed between groups at 1 year. There were also no statistically significant differences in the mortality rate, MACE, or all-cause hospitalization between groups at either 30 days or 1 year, although there was a numerically lower rate of all-cause death in the two or more uncontrolled risk factors group than among other groups.
Relationship between risk factor control and outcomes by 1 year
Patients with uncontrolled HbA1c were at heightened unadjusted risk of MAVE (HR 1.54, 95% CI 1.19–2.00; online Supplementary Table 2) and MALE (HR 1.93, 95% CI 1.37–2.70; online Supplementary Table 3), but not MACE (online Supplementary Table 4). After adjustment for patient demographics, PAD symptom severity, and comorbidities, uncontrolled HbA1c was no longer associated with elevated risk of any outcome. Patients with uncontrolled SBP were at higher unadjusted risk of MACE (HR 1.53, 95% CI 1.01–2.29), but this association did not persist after adjustment for patient covariates. Current smoking and uncontrolled LDL were not associated with outcomes in unadjusted or adjusted analyses. None of the uncontrolled risk factor measures were associated with all-cause hospitalization in either unadjusted or adjusted analyses (online Supplementary Table 5).
Patients with two or more uncontrolled risk factors were at heightened unadjusted risk of MAVE (HR 1.42, 95% CI 1.05–1.93; online Supplementary Table 6) and MALE (HR 1.93, 95% CI 1.26–2.94; online Supplementary Table 7), but not MACE (online Supplementary Table 8) or all-cause hospitalization (online Supplementary Table 9). These higher risks were no longer significant following adjustment.
Relationship between patient characteristics and outcomes by 1 year
Patients who were Medicaid dual-enrolled were at higher unadjusted risk of MAVE (HR 1.53, 95% CI 1.17–2.00) and all-cause hospitalization (HR 1.55, 95% CI 1.23–1.95). The heightened risk of MAVE did not remain statistically significant following adjustment for other patient characteristics and control of individual risk factors; however, the elevated risk of all-cause hospitalization remained (HRadj 1.36, 95% CI 1.05–1.76). Patients who resided in rural areas were at a significantly lower risk of all-cause hospitalization when adjusting for covariates and control of individual risk factors (HRadj 0.73, 95% CI 0.56–0.96). Conversely, patients in rural areas were at higher unadjusted risk of MALE (HR 1.55, 95% CI 1.07–2.25), but this elevated risk did not remain significant following multivariable adjustment. Patients who were Black were at higher unadjusted risk of MAVE (HR 1.65, 95% CI 1.28–2.12), MALE (HR 1.90, 95% CI 1.37–2.65), and all-cause hospitalization (HR 1.31, 95% CI 1.05–1.63), yet these risks were no longer significant after adjustment for confounding factors.
Discussion
In this paper, we evaluated the relationship between risk factor control and longitudinal clinical outcomes in a large group of patients with PAD within an integrated health system, and the analysis yielded three key findings. First, control of risk factors in patients with PAD is suboptimal and risk factor control varied significantly across patient demographics and clinical factors. Second, worse risk factor control was associated with a significantly higher incidence of major adverse events, but these increased risks did not persist after adjustment for patient characteristics. Finally, adjustment for risk factor control and patient characteristics attenuated but did not negate the relationships between social determinants of health and cardiovascular outcomes.
Guidelines recommend management of HTN, HLD, and DM as well as smoking cessation in patients with PAD through lifestyle modifications and/or medical therapy, with the goal of improved cardiovascular morbidity and mortality as well as quality of life.18,19 This study demonstrates the poor management of risk factors in patients with PAD, with only one-third of patients in this cohort achieving control of all modifiable risk factors and one-quarter lacking control of two or more. Poor risk factor management among patients with PAD has been previously documented, especially compared to conditions necessitating similar control, such as IHD and CBVD.5,20–23 Although insurance status and under-recognition of PAD can be reasonably expected to influence access to and quality of care, this cohort of patients with insurance coverage and diagnosed PAD still demonstrated suboptimal control of risk factors, pointing to the role of other provider- and patient-level factors in achieving ideal management. Identifying and addressing these factors will be crucial to ensuring better risk optimization for this patient population.
A higher incidence of cardiovascular events with poorer risk factor control is in keeping with analyses of larger databases. Analyses of the COMPASS trial and REACH registry have demonstrated higher rates of ischemic events at 1 year with worse individual as well as cumulative risk factor control for patients with PAD.5,24 Endpoints in this cohort were driven by limb events, particularly revascularization, as well as late cardiac events. A high rate of limb events was observed in all patients with available outcome data (i.e., including patients without risk factor control data) and has previously been noted in patients with both isolated PAD as well as polyvascular disease.5,8 This potentially suggests a greater burden of leg disease and symptoms despite the systemic atherosclerosis associated with PAD. The lack of significant association between risk factor control and outcomes in multivariable analysis in this cohort may have been due to limited statistical power due to the exclusion of patients with incomplete risk factor control data. This bears particular consideration given that patients who were excluded due to incomplete risk factor control data had characteristics similar to included patients with poor risk factor control, suggesting that the excluded patients may have disproportionately had poor risk factor control and more ischemic events.
Patients in this cohort with the poorest degree of control of risk factors (⩾ 2 uncontrolled) had more severe PAD symptoms (i.e., more likely to have IC and CLTI) and were younger. Previous studies have demonstrated the independent and cumulative association of HTN, DM, HLD, and tobacco use with the risk of PAD and severity.9,10,25 Our findings suggest that the degree of control of risk factors, not just their presence or absence, may be related to symptom severity. However, the relationship between risk factor control and symptom severity remains unclear and may be bidirectional – whereas worse risk factor control may accelerate PAD progression and worsen symptoms, more severe symptoms could limit mobility and exercise capability, for instance, thus impeding risk factor control. Large studies have demonstrated that older patients are more likely to have clinical risk factors for PAD, 25 but are also more likely to have better control of these risk factors compared to younger patients. 5 There are several possible reasons that older patients had better risk factor control in our study. Older patients may have more established PAD and cardiovascular care, resulting in more consistent management of risk factors. It is also conceivable that patients with less risk factor control may develop PAD earlier due to a heightened risk profile. The relationship between degree of risk factor control and age of PAD incidence as well as symptom severity merits further exploration.
Several aspects of risk factor control in relation to race, ethnicity, and socioeconomic status were notable in this study. Patients with the poorest control of risk factors were significantly more likely to be Black (38–43% vs 15–19%), dual Medicaid enrolled (23.5% vs 11.5%), and live in areas with lower annual median income ($53,750 vs $56,100) when compared with patients with optimal control. Additionally, non-White, rural, and poorer (i.e., lower median income and greater Medicaid dual enrollment) patients were significantly more likely to be excluded from this cohort due to incomplete available risk factor control data. Incomplete data may be the result of less access to care, fragmented care or lower-quality care, potentially pointing towards underservice of these patients. Importantly, among included patients, adjusting for degree of risk factor control and other patient characteristics attenuated but did not negate the elevated risk of many cardiovascular outcomes in historically underserved groups, suggesting multiple and potentially modifiable contributors to disparities in outcomes. However, an increased risk for all-cause hospitalization among dual Medicaid enrolled patients as well as those residing in metropolitan areas persisted after adjustment. Increased risk of hospitalization among Medicaid patients has previously been noted in post-MI care, 26 as have worse in-hospital and overall outcomes for PAD patients with Medicaid.27,28 A greater burden of comorbidities, more advanced disease, less access to care, and other social determinants related to poverty may all contribute to this elevated risk of hospitalization.
Our findings are in line with a growing understanding of the relationship between social drivers of health, such as race and socioeconomic status, and cardiovascular risk factors and outcomes.6,10,18,22,26 Disparities in risk factor control that mirror inequities in cardiovascular outcomes in patients with PAD suggest risk factor control is a potential intermediate step on the causal pathway of poorer outcomes in underserved groups. These social determinants may influence unmeasured drivers of differences in risk factor control. These factors may include access to care, ability to adhere to medications and lifestyle modifications, patient–provider communication and trust, racism or bias, patient attitudes towards disease and treatment, health literacy, access to nutritious foods, and ease of physical activity, among others.7,29–34Addressing disparities in risk factor control through equitable implementation of guideline-directed medical therapy, targeted implementation programs, culturally appropriate patient education in underserved communities, and patient and community empowerment is an important step in reducing inequalities in cardiovascular outcomes.
Study limitations
This study has several limitations. This observational study is from a single large referral center, therefore geographic variability in both risk factor control and PAD outcomes is likely not represented. The cohort only includes fee-for-service Medicare patients to facilitate robust outcome ascertainment, limiting generalizability. The cohort was further limited to patients with available EHR data necessary to determine risk factor control, excluding patients with more fragmented care. Patients with providers in multiple health systems (e.g., a local primary care physician but vascular specialist in a distant city) may have a different risk factor profile and outcomes due to fragmented care. Control of component risk factors was dichotomized based on reasonable clinical targets; however, person-time spent above and below control thresholds may contribute to outcomes and were not easily analyzed retrospectively. The study’s retrospective design makes some temporal and causal relationships impossible to discern (e.g., risk factor control and symptom severity), but determination of risk factor control during a 2-year lookback period preserved the temporal relationship to measured outcomes.
Nevertheless, our analysis suggests further investigation into risk factor control and better implementation in underserved communities is warranted. Replicating this analysis among broader patient populations, including wider geographic areas with variable insurance status, can further evaluate the role of risk factor control in PAD outcomes and disparities in implementing guideline-directed care. A prospective design could assess the role of risk factor control in both PAD incidence, progression, and severity, including studies of primary and secondary prevention with guideline-directed medical therapy and lifestyle interventions. Trials or large dataset analyses testing different control thresholds can provide more evidence for and improve clinical treatment goals. These future investigations can refine the understanding of the relationship between risk factor control and PAD, optimize control definitions, and improve implementation.
Conclusions
Patients with PAD have poor risk factor control, with significant differences in degree of control mirroring known racial and socioeconomic disparities in outcomes. Observed differences in cardiovascular outcomes by degree of risk factor control were mitigated by adjustment for other patient characteristics. Patients with dual Medicaid enrollment and metropolitan residence remained at elevated risk for all-cause hospitalization after adjustment for risk factor control and patient characteristics. Addressing disparities in risk factor control is an actionable step in reducing inequities in cardiovascular outcomes for patients with PAD. Further exploration of the role of risk factor control on PAD incidence, severity, and progression as well as contributors to disparities in control is desperately needed.
Supplemental Material
sj-pdf-1-vmj-10.1177_1358863X221084360 – Supplemental material for Impact of risk factor control on peripheral artery disease outcomes and health disparities
Supplemental material, sj-pdf-1-vmj-10.1177_1358863X221084360 for Impact of risk factor control on peripheral artery disease outcomes and health disparities by F Will Pohlman, Cassie B Ford, E Hope Weissler, Michelle M Smerek, N Chantelle Hardy, Dennis I Narcisse, Steven J Lippmann, Melissa A Greiner, Chandler Long, Jennifer A Rymer, J Antonio Gutierrez, Manesh R Patel and W Schuyler Jones in Vascular Medicine
Footnotes
Declaration of conflicting interests
The authors declared the following potential conflicts of interest with respect to the research, authorship, and/or publication of this article: Dr Gutierrez: consulting – Janssen Pharmaceuticals and Amgen, Inc. Dr Patel: research grants – Janssen, Bayer, National Heart, Lung, and Blood Institute, HeartFlow, Phillips; advisory board/consulting – Bayer, Janssen, HeartFlow. Dr Jones: research support – Boehringer Ingelheim, Doris Duke Charitable Foundation, National Institutes of Health, Patient-Centered Outcomes Research Institute; advisory board – Bayer, Bristol Myers Squibb, Janssen Pharmaceuticals. The other authors reported no conflicts of interest.
Funding
Doris Duke Charitable Foundation provided a Clinical Scientist Development Grant to Dr Jones to complete this work. Dr Weissler is supported by the National Heart, Lung, and Blood Institute of the National Institutes of Health under Award Number F32HL151181. The content is solely the responsibility of the authors and does not necessarily represent the official views of the National Institutes of Health.
Supplementary material
The supplementary material is available online with the article.
References
Supplementary Material
Please find the following supplemental material available below.
For Open Access articles published under a Creative Commons License, all supplemental material carries the same license as the article it is associated with.
For non-Open Access articles published, all supplemental material carries a non-exclusive license, and permission requests for re-use of supplemental material or any part of supplemental material shall be sent directly to the copyright owner as specified in the copyright notice associated with the article.