
Abstract
Background:
Point-of-care duplex ultrasound has emerged as a promising test for the diagnosis of peripheral artery disease (PAD). However, the interpretation of morphologically diverse Doppler arterial spectral waveforms is challenging and associated with wide inter-observer variation. The aim of this study is to evaluate the utility of machine learning techniques for the diagnosis of PAD from Doppler arterial spectral waveforms sampled at the level of the ankle in patients with diabetes.
Methods:
In two centres, 590 Doppler arterial spectral waveform images (PAD 369, no-PAD 221) from 305 patients were prospectively collected. Doppler arterial spectral waveform signals were reconstructed. Blinded full lower-limb reference duplex ultrasound results were used to label waveform according to PAD status (i.e., PAD, no-PAD). Statistical metrics and multiscale wavelet variance were extracted as discriminatory features. A long short-term memory (LSTM) network was used for the classification of raw signals, and logistic regression (LR) and support vector machines (SVM) were used for classification of extracted features. Signals and feature vectors were randomly divided into training (80%) and testing (20%) sets.
Results:
The highest overall accuracy was achieved using a logistic regression model with a combination of statistical and multiscale wavelet variance features, with 88% accuracy, 92% sensitivity, and 82% specificity. The area under the receiver operating characteristics curve (AUC) was 0.93.
Conclusion:
We have constructed a machine learning algorithm with high discriminatory ability for the diagnosis of PAD using Doppler arterial spectral waveforms sampled at the ankle vessels.
Keywords
Background
Peripheral artery disease (PAD) is a major global health problem which is estimated to effect over 230 million people worldwide. 1 It is characterised by progressive atherosclerotic stenosis and occlusion of the lower-limb arteries, resulting in reduced blood flow and tissue perfusion. Diabetes is an important risk factor for PAD, 2 and the dangerous synergy between the two conditions is associated with poor clinical outcomes, such as increased risk of diabetic foot ulceration, lower-limb amputation, myocardial infarction, stroke, and mortality.3–5
The diagnosis of PAD in people with diabetes is important and allows for an opportunity to reduce cardiovascular morbidity and mortality through risk factor modification and optimisation of best medical therapy, including the use of antiplatelet and lipid-lowering treatment. 6 Furthermore, enhanced ulcer prevention strategies, such as frequent foot checks and the provision of orthotic footwear and inserts, can be adopted to reduce the risk of ulceration. 7 In patients with active ulceration, the detection of PAD may indicate the need for timely revascularisation to promote healing and reduce the risk of amputation. 8
The typical clinical presentations of PAD may be absent, subtle or atypical in patients with diabetes who often suffer from accompanying peripheral neuropathy with impaired sensation and are also more likely to suffer from diffuse or distal atherosclerotic disease. 9 Therefore, bedside tests serve an important role in the diagnosis of PAD. Point-of-care duplex ultrasound (DUS) has been shown to be the most accurate 10 and cost-effective 11 bedside test for the detection of PAD in patients with diabetes. It allows for detailed morphological assessment of Doppler arterial spectral waveforms, sampled from the distal posterior tibial and anterior tibial arteries, at the level of the ankle. A haemodynamically significant proximal arterial lesion results in morphological change in the downstream waveform sampled at the level of the ankle. However, identifying pathology through waveforms can be complex as a number of morphological abnormalities can occur, such as loss of pulsatility, long systolic rise time, waveform broadening, and long forward flow. We have recently shown that incorporating these adverse features into the definition for pathological waveforms improves overall diagnostic accuracy. 10 However, we also note that a key barrier to the implementation of point-of-care DUS in routine clinical practice is the recognition of these adverse waveform features.
Machine learning techniques allow for nonlinear classification of ‘hard-to-define’ physiological signals. Although not previously applied to the classification of Doppler arterial spectral waveforms, this approach may reduce inter-observer variation and facilitate the adoption of point-of-care DUS for the detection of PAD in diabetes.
The aim of this study was to evaluate the utility of machine learning techniques for the diagnosis of PAD from Doppler arterial spectral waveforms sampled at the level of the ankle in patients with diabetes. We describe the application of a long short-term memory network (LSTM) for the classification of raw signals, as well as logistic regression (LR) and support vector machines (SVM) classification using extracted time- and time-frequency domain features.
Methods
Study design
The study methodology is summarised in Figure 1. This study is based on a prospectively recruited cohort of 305 patients with diabetes who presented to two diabetic foot clinics in London, United Kingdom (TEsting for Arterial Disease in Diabetes study, TrEAD). The TrEAD study aimed to evaluate the diagnostic accuracy of point-of-care DUS and other commonly used bedside tests for the detection of PAD in patients with diabetes as compared to a blinded reference test of a full lower-limb DUS. The study was approved by the Health Research Authority (REC reference 17/LO/1447). Every patient gave written informed consent to take part in the study. The TrEAD protocol and details of patient recruitment and data acquisition have been recently published.10,12 The funders (Chelsea and Westminster Plus charity) had no influence on the design of the study and were not involved in data collection, data analysis or the writing of the manuscript.
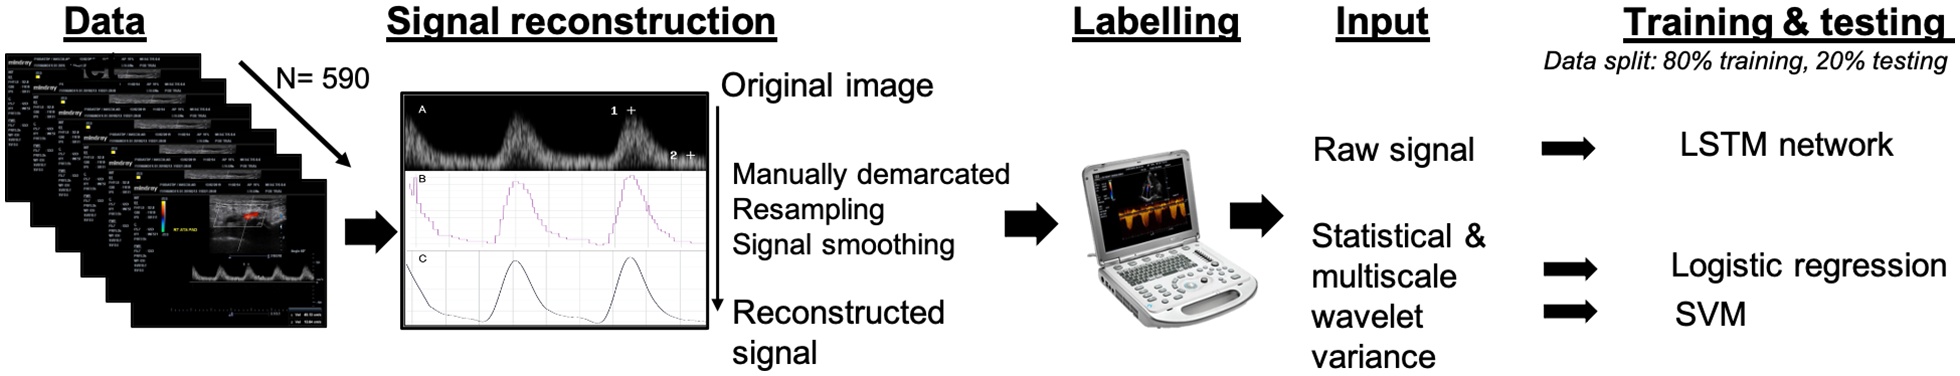
Summary of signal processing and machine learning methodology.
Point-of-care DUS was performed using a portable ultrasound machine (Mindray M7; Shenzhen, China) with a linear 6–14 MHz transducer by a vascular scientist. The anterior and posterior tibial arteries were first visualised at the ankle, using B-mode imaging and colour Doppler, in transverse and then longitudinal planes. Arterial spectral waveforms were then sampled from the centre of each vessel using a Doppler angle of < 60°. Waveforms were optimised for interpretation by adjusting sample volume, sample size, Doppler scale, Doppler gain, and wall thump filter settings. Images of all arterial spectral waveforms sampled at the distal anterior and posterior tibial arteries were collected.
Full lower-limb reference DUS, performed by a blinded vascular scientist, was used as the reference test and results were used to label each point-of-care DUS arterial spectral waveform according to PAD status (i.e., PAD, no-PAD). All lower-limb arterial segments were assessed (iliac, femoral, popliteal, and tibial) using a combination of B-mode, colour Doppler, and spectral Doppler ultrasound in transverse and longitudinal planes. Peak systolic velocity (PSV) was selectively sampled throughout the segments and at areas of suspected stenosis. PSV ratio (PSVR) was calculated as the ratio of PSV at the site of stenosis to where the lowest pre- or poststenotic PSV value was measured. All reference scans were performed using the Mindray M7 (Shenzhen, China) ultrasound system with linear (6–14 MHz) and curvilinear (2–5 MHz) transducers. PAD was defined as the presence of occlusions, or stenosis, or diffuse stenotic disease, which individually or collectively caused significant velocity change (PSVR ⩾ 2; represents a 50% stenosis) and flow disturbance locally, and resulted in biphasic or monophasic signal distally. In this definition, multiple subcritical stenoses would result in a classification of PAD if they collectively resulted in significant velocity change and flow disturbance.
Signal reconstruction
All waveform images (Figure 2A) were uploaded to the R software (version 3.3.1; R Foundation for Statistical Computing, Vienna, Austria) and individually reconstructed using the R package Digitize (version 0.0.4). First, the x (time, seconds) and y axes (PSV, cm/second) for each image were defined. Then, the outer envelope of the waveform was manually demarcated. This process generates calibrated x, y coordinates for each signal.
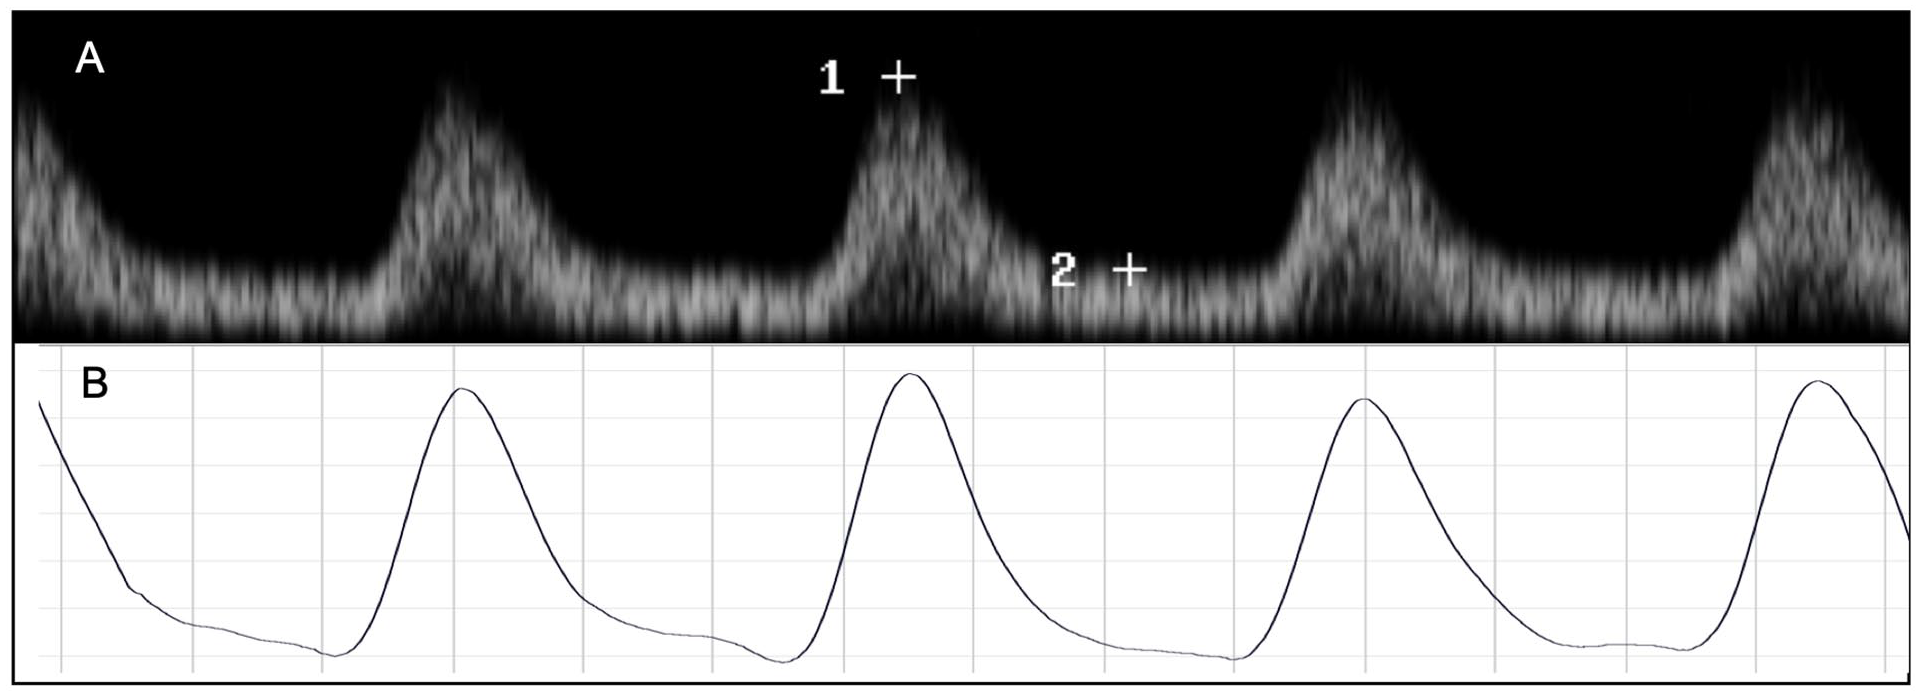
Reconstructed signals were exported to MATLAB software (version R2020b; The MathWorks Inc., Natick, MA, USA) and resampled using the nearest neighbour method at a predefined time step of 0.0001 seconds (sampling rate 10 kHz per second) and further synchronised. Each image captured 3.5 seconds of signal recording. To account for late starts in recording, all signals were extracted from 0.5 to 3.5 seconds; the resulting signals were 3 seconds long (30,000 samples). Signal smoothing was performed using the Savitzky–Golay method. An example of a reconstructed and smoothed signal is shown in Figure 2B.
Extraction and selection of statistical and time-frequency domain features
To reduce the dimension of the data, feature extraction was performed and time and time-frequency domain features of potential importance were extracted.
The following 13 time-domain statistical features were extracted: kurtosis, skewness, peak value, mean, SD, root mean square (RMS), impulse factor, crest factor, clearance factor, signal to noise ratio (SNR), total harmonic distortion (THD), signal to noise and distortion ratio (SINAD), and shape factor. Definitions for these features are given in the online supplementary material S1.
Time-frequency domain features were extracted using discrete wavelet transform (DWT), which deconstructs a signal into frequency sub-bands (scales), as shown in Figure 3. DWT is widely applied in engineering and captures and localises transient features in time series data. By decomposing a signal into components of different scales, DWT allows for the detection of variations across scales in observed data. Multiscale wavelet variance estimates were extracted from each signal over the entire data length. Multiscale wavelet variance estimates have been shown to be useful in distinguishing between different electrocardiogram (ECG) signals. 13 A wavelet filter of length 2 of the Daubechies family (db2) was used to generate DWT coefficients, and hence the DWT variance of the signal. The maximum number of scales was determined based on the signal length 13 and set at 13, resulting in 14 possible features (i.e., 13 detail coefficients and one approximation coefficient).
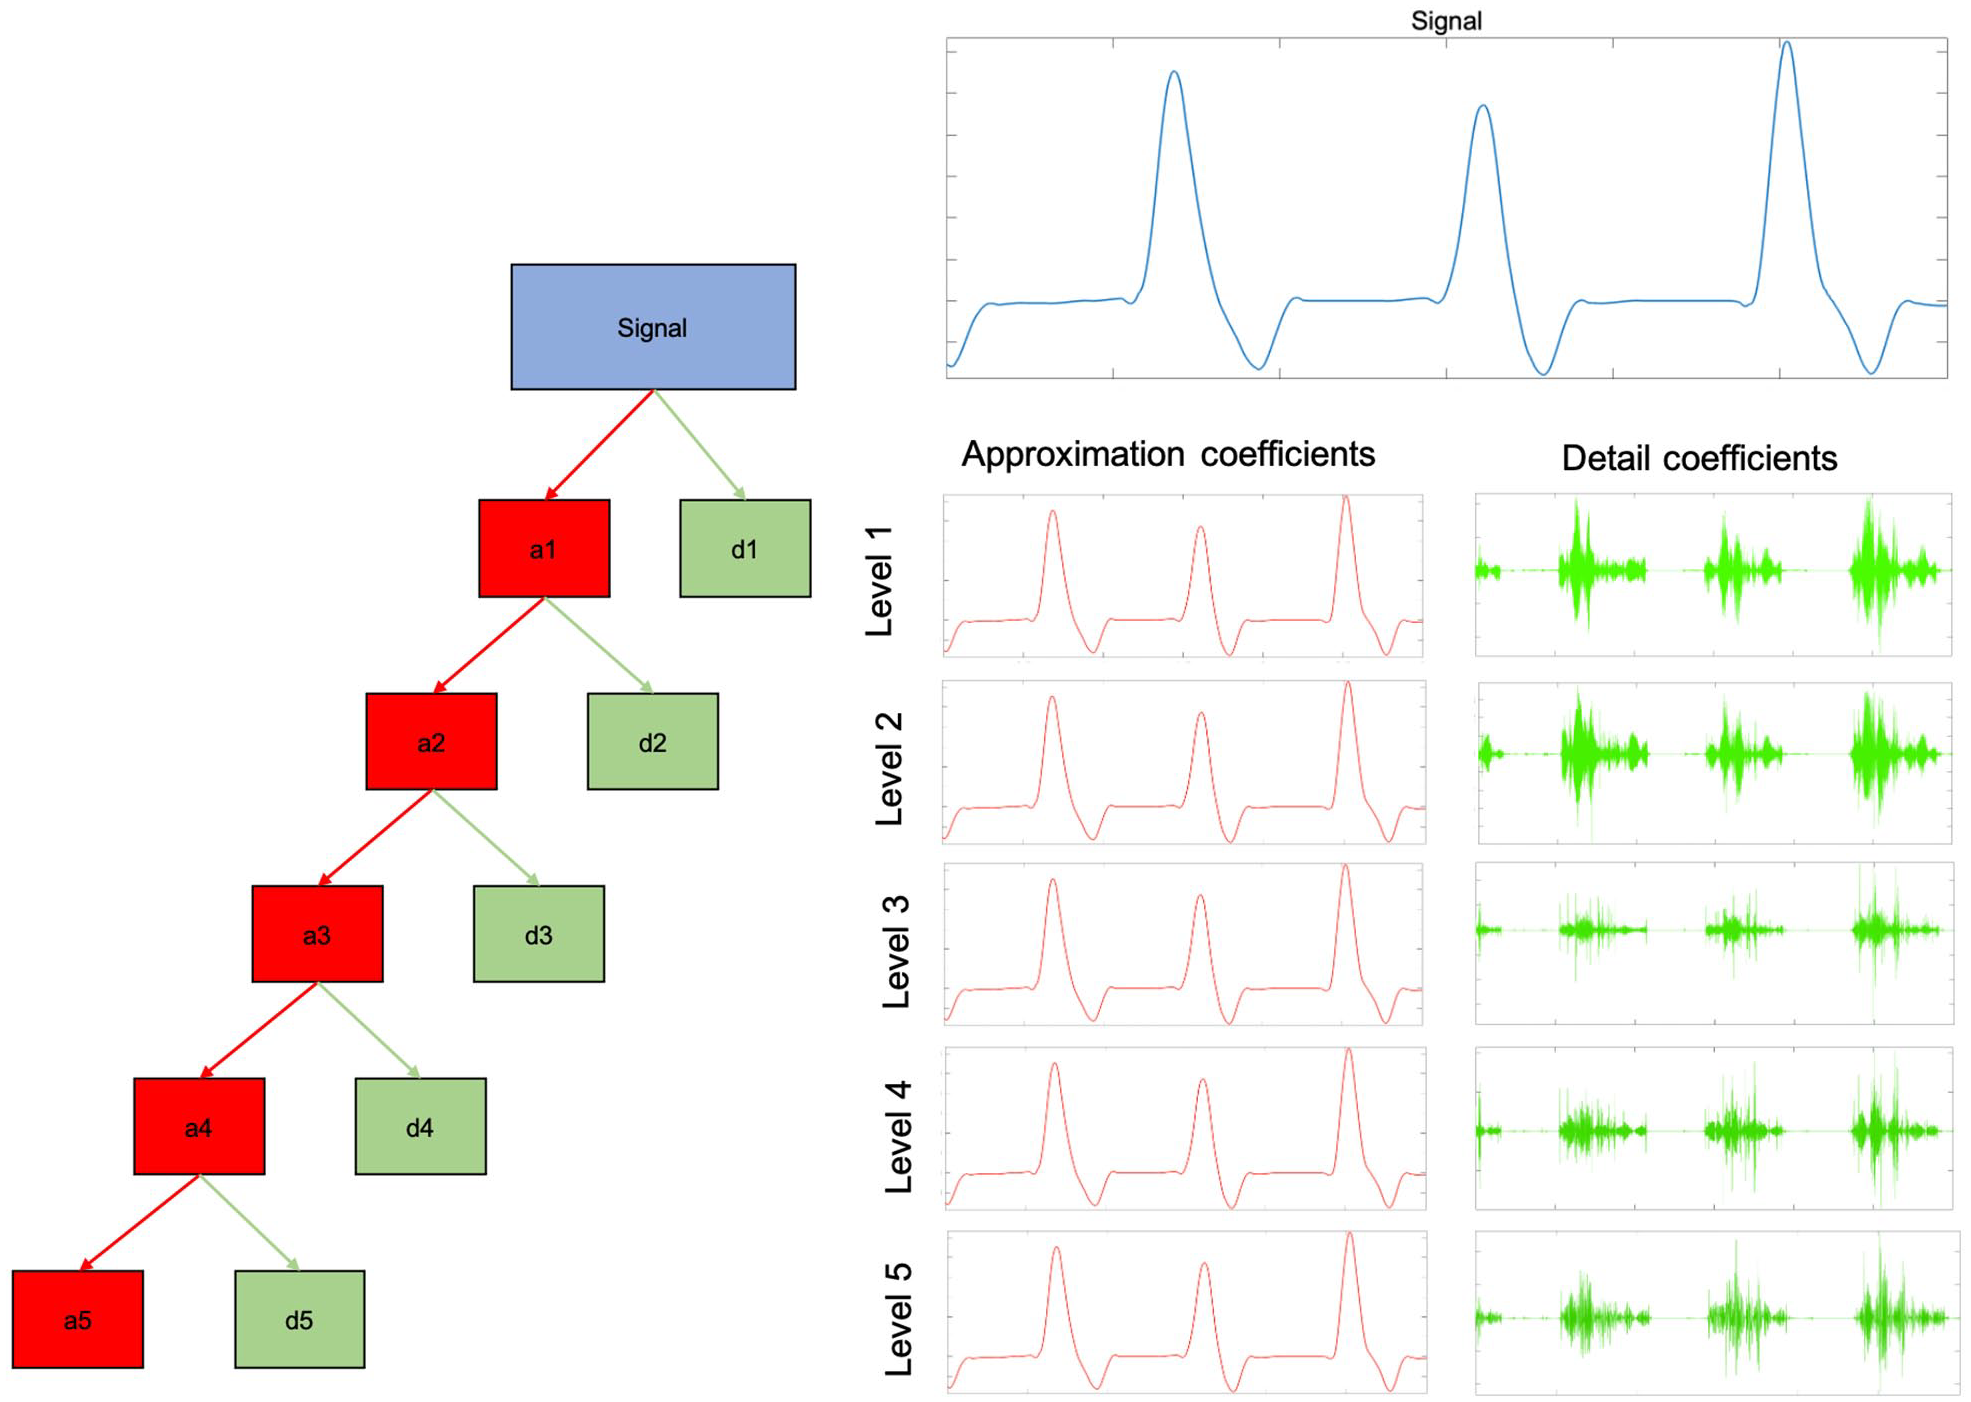
Five-level decomposition of a Doppler arterial spectral waveform. Each level DWT returns two sets of coefficients: the approximation coefficients (red) and the detail coefficients (green) of the db2 wavelet. The approximation coefficient represents the output of a low pass filter (averaging filter) and the detail coefficient represents the output of a high pass filter (difference filter) of the DWT. At each level of the decomposition process the DWT is applied to the approximation coefficients of the previous level, the frequency resolution is doubled through filtering, and the time resolution is halved through downsampling. (Note: in our analysis, we performed a 13-level decomposition.)
Differences in the 27 possible features were compared between the PAD and no-PAD groups using independent t-test and only those with a statistically significant difference were retainedFigure 3.
Classification
An LSTM memory network was used for the classification of raw signals, and LR and SVM were used for classification based on extracted features. LSTM networks are a type of recurrent neural network. These deep learning models are well suited to handling time series data as they can learn and remember over long sequences. 14 LR and SVM are more traditional machine learning models that are generally computationally less complex, easy to implement, and have good accuracy for simple datasets. LR uses a logistic (or sigmoid) function to model a binary dependent variable. SVM is a method which creates a line or hyperplane that separates the data into different categories. The hyperplane is deduced by maximising the geometric distance between the support vectors of the categories. New data will be projected onto the hyperspace and subsequently classified based on relationship to the hyperplane.
All signals were labelled as ‘PAD’ or ‘no-PAD’ according to the results of the reference DUS using the MATLAB Signal Processing Toolbox. Signals and feature vectors were randomly divided into the training (80%) and testing (20%) sets. All models were trained using a central processing unit (CPU).
Long short-term memory network classification of raw signals
A single-input network was trained using the binary cross-entropy loss, for a maximum of 10 epochs on mini-batches of size 15, with the initial learning rate of 0.01 and sequence length of 15,000. The network consisted of a bidirectional LSTM network with 100 hidden units, two fully connected layers, a softmax layer, and an output layer. To achieve the same number of signals in each class (i.e., PAD and no-PAD), oversampling was performed.
Logistic regression and support vector machine classification of extracted features
Linear kernel support vector machine (Kernel scale set to ‘Automatic’, box constraint level, multiclass method 1v1 and standardised data set to ‘True’) and logistic regression models were compared using (1) all combined features, (2) multiscale wavelet variance features only, and (3) statistical features only.
Results
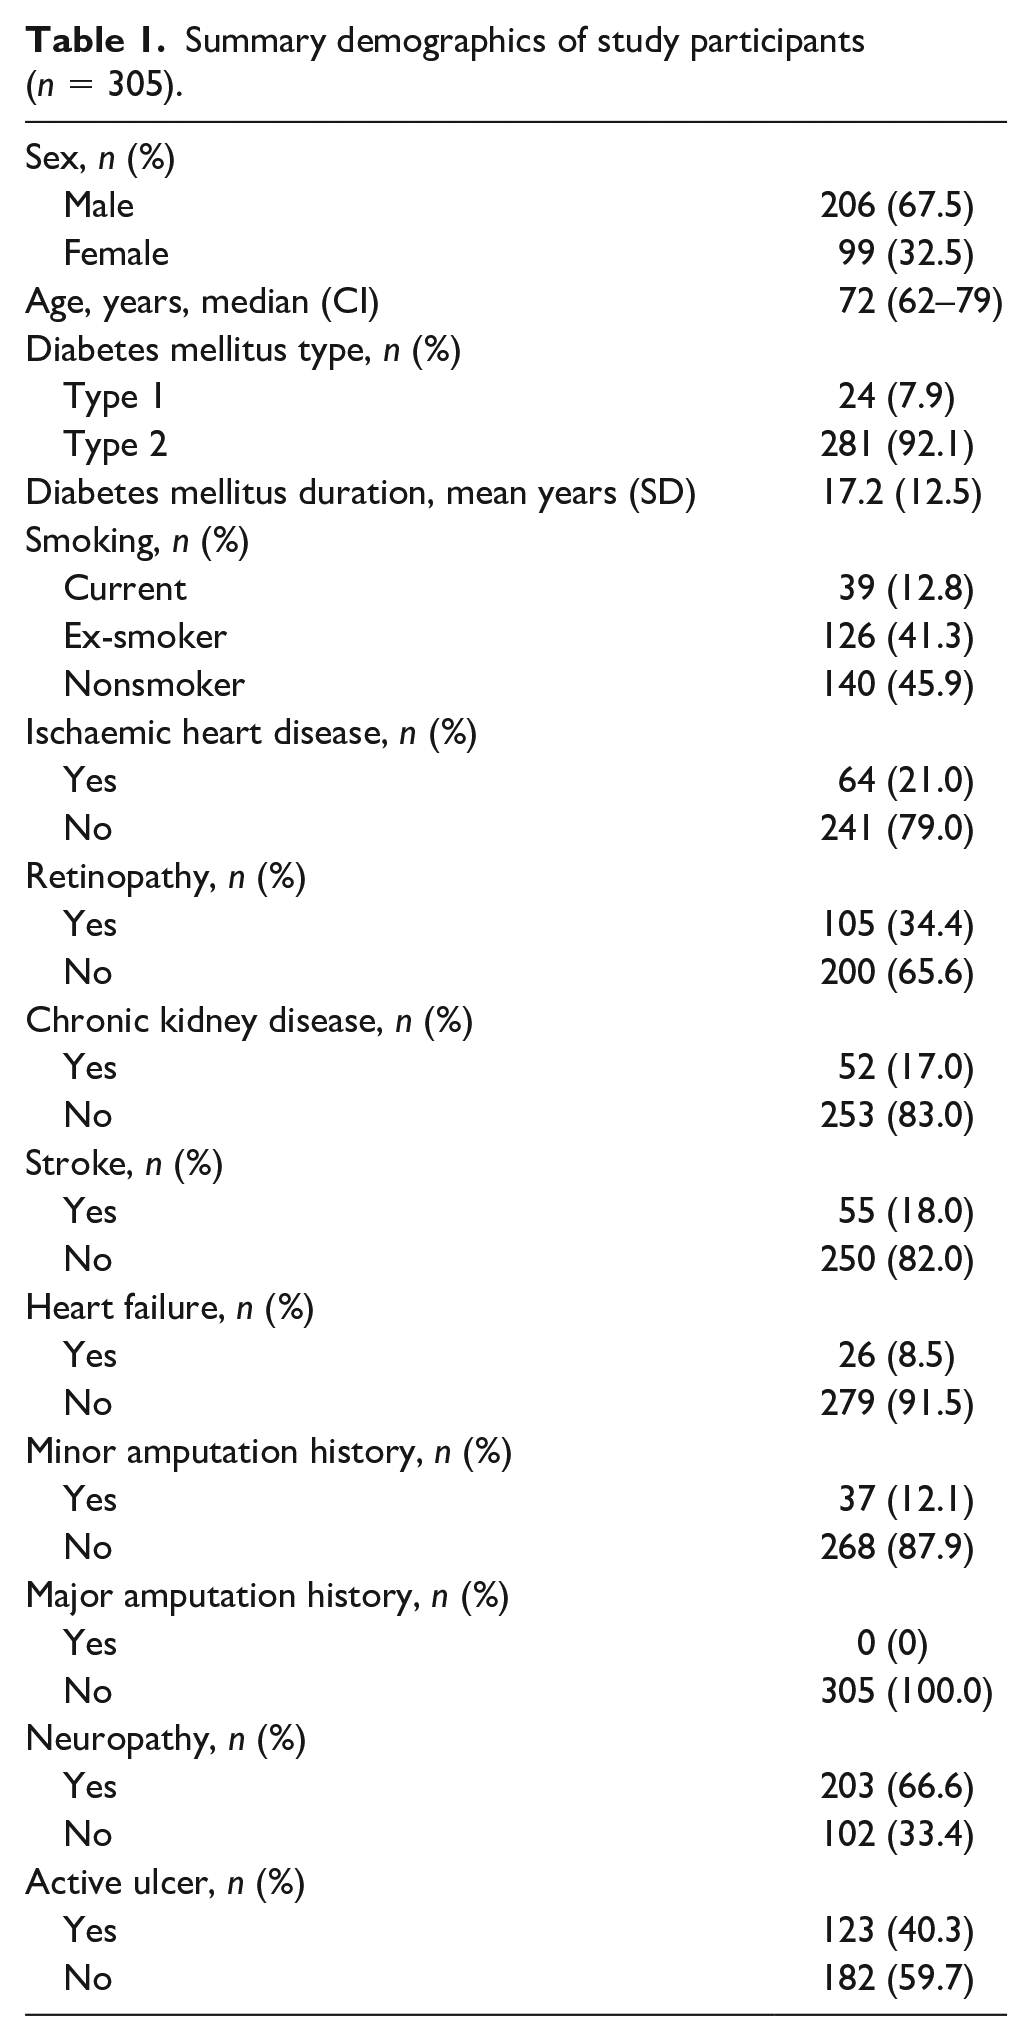
After excluding occluded vessels which were not amenable to signal extraction, 590 arterial spectral waveforms from 305 patients were available for analysis (PAD 369, no-PAD 221). Baseline demographic data for the 305 study participants are presented in Table 1. All patients had a diagnosis of diabetes. Patients were representative of those managed in high-risk diabetic foot clinics with a high prevalence of active ulceration (n = 123, 40.3%) and neuropathy (n = 203, 66.6%). A toe–brachial pressure index (TBPI) measurement was only possible for 234 patients (previous hallux amputation, n = 20; hallux ulceration, n = 33; hallux deformity, n = 7; tremor, n = 5; pain, n = 6). The average TBPI value was 0.83 (SD ± 0.34).
Summary demographics of study participants (n = 305).
Of the 27 possible features, 26 (13 statistical time-domain and 13 time-frequency multiscale variance features) were statistically different between the two groups (online supplementary material S2 and S3) and were used as features for classification.
The overall test accuracy, sensitivity, and specificity for each classification approach is presented in Table 2. Higher overall accuracy was achieved using the SVM and LR methods combined with extracted features as compared to LSTM network classification of raw signals. The highest overall accuracy was achieved using both statistical time-domain and time-frequency domain multiscale wavelet variance features in combination with a logistic regression model, with 88% accuracy, 92% sensitivity, and 82% specificity and the corresponding confusion matrix is presented in the online supplementary material S4. The area under receiver operating characteristics curve (AUROC) metrics show excellent discrimination between the PAD and no-PAD groups (Figure 4; AUC = 0.93). AUROC plots for the other machine learning methods are presented in the online supplementary material S5.
Summary of machine learning performance.
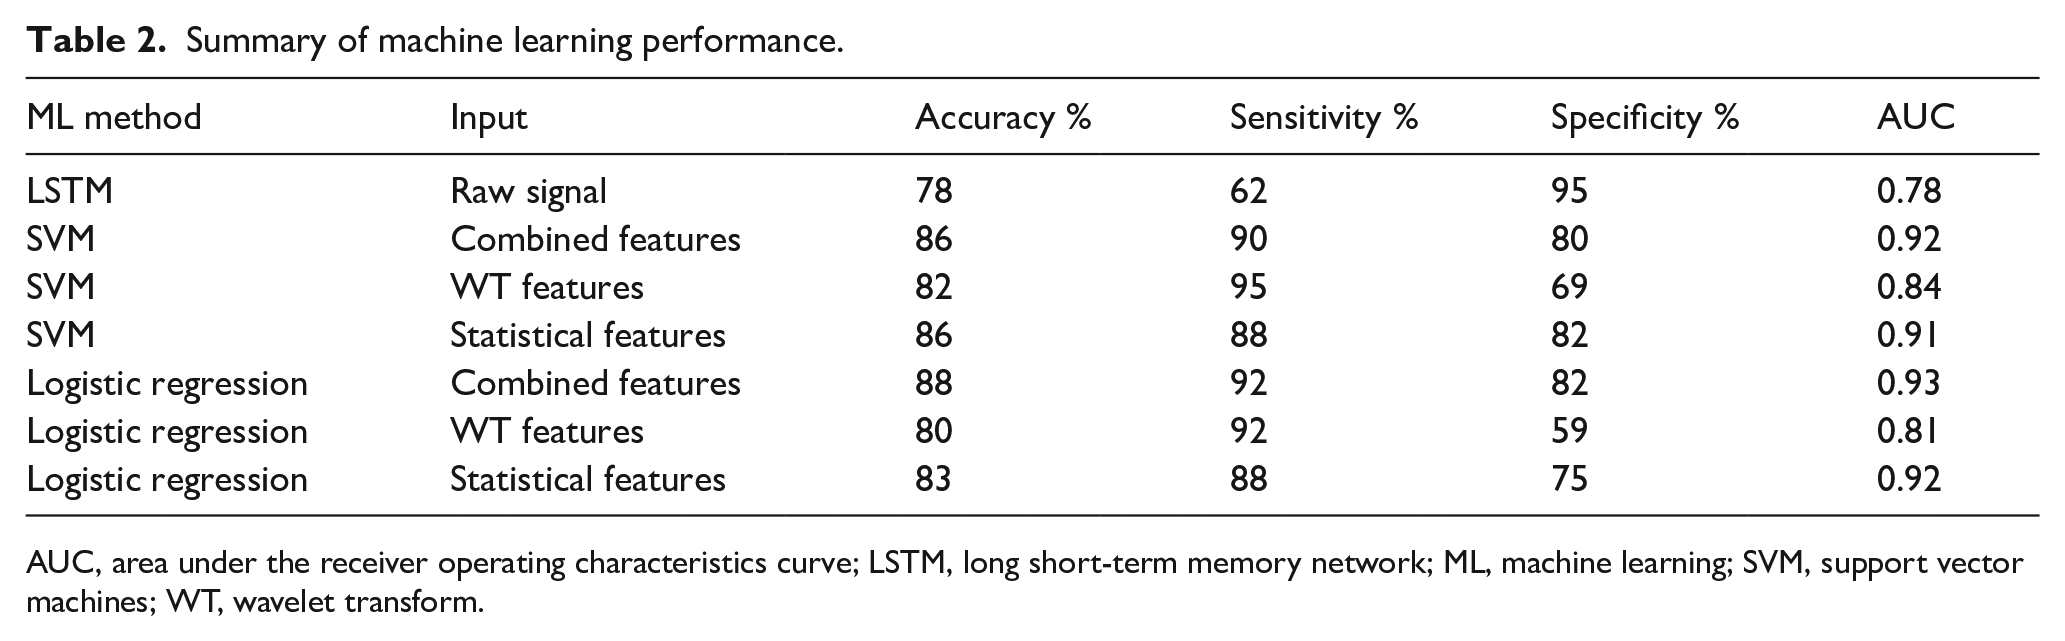
AUC, area under the receiver operating characteristics curve; LSTM, long short-term memory network; ML, machine learning; SVM, support vector machines; WT, wavelet transform.
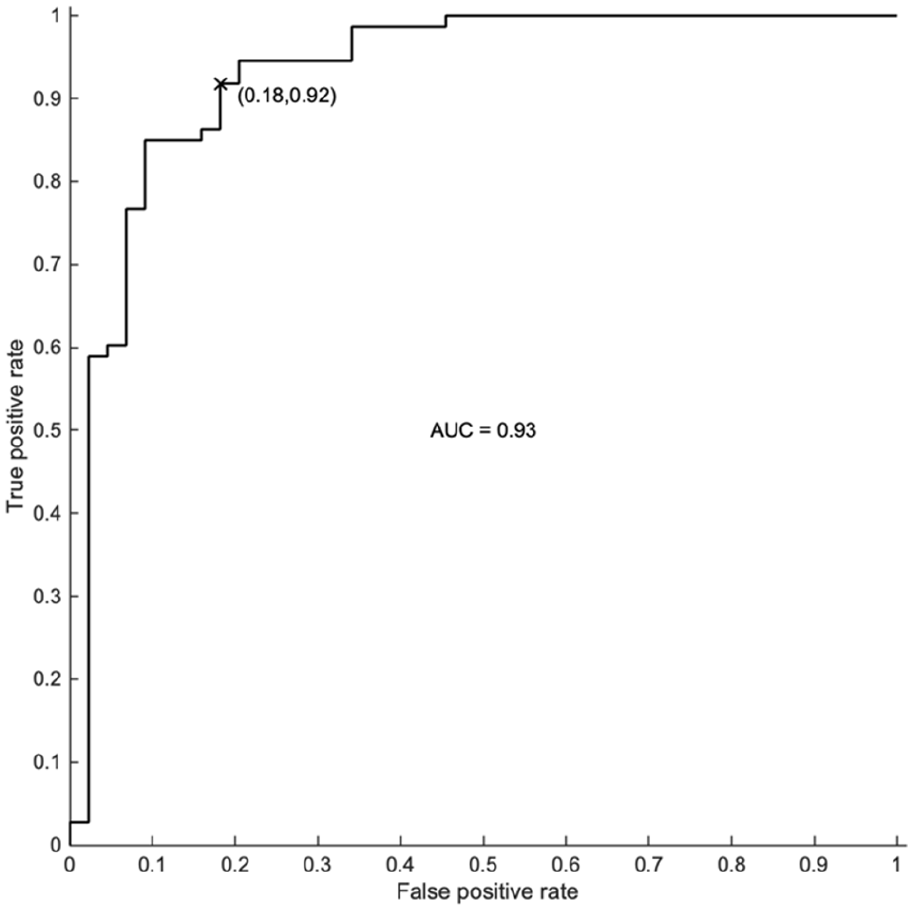
AUROC for a logistic regression model using a combination of time-domain statistical and time-frequency domain multiscale wavelet variance features. The x marks current classifier performance on the receiver operating characteristics curve.
Discussion
Early pioneering work of Strandness et al. reported on morphological differences in Doppler arterial waveforms of normal and atherosclerotic peripheral arteries.15,16 This was followed by rapid technological and methodological advancement, which established vascular ultrasound as the single most important noninvasive vascular diagnostic imaging modality. Despite important early efforts to define certain aspects of waveform morphology, such as resistance and pulsatility, in quantitative terms,17,18 waveform assessment has not changed for almost 50 years. To the best of our knowledge, this is the first study to apply machine learning to the classification of Doppler arterial spectral waveforms at the ankle for the diagnosis of PAD. We have shown that machine learning can achieve high diagnostic accuracy for PAD from the interpretation of ankle Doppler arterial waveforms. The performance of machine learning (sensitivity 92%, specificity 82%) in this study is comparable to that of waveform interpretation by expert vascular scientists reported in the TrEAD study (sensitivity 95%, specificity 77%). 10 However, it has the added advantage of standardising assessment and eliminating interobserver variation, which represents a significant challenge given the qualitative and subjective nature of waveform interpretation. This approach may also shorten the learning curve for point-of-care DUS by removing waveform interpretation as a barrier and hence further facilitate its adoption in routine clinical practice. This is important given that point-of-care DUS is a bedside test for use by frontline health care professionals looking after patients with diabetes (surgeons, podiatrists, nurses, and physicians), who are unlikely to have had formal training in vascular ultrasound.
Our algorithm also outperformed a machine learning model trained using diverse clinical, demographic, imaging, and genomic information (AUC = 0.87). 19 This highlights the value of highly discriminatory information that can be extracted from physiological Doppler signals. However, additional gains in performance may be gained from combining these data with other clinical data and this would be an interesting line of future research. There is also evidence in the literature that machine learning can be harnessed to classify toe photoplethysmography (PPG) signals for the detection of PAD as diagnosed using ankle–brachial pressure indices as the reference standard (overall accuracy of 88.9%). 20 In the future, direct comparison of the diagnostic accuracy of these two approaches would be of interest.
Although our study is related to the specific application of point-of-care DUS for the detection of PAD in patients with diabetes, our findings have wider implications for the field of vascular ultrasound. Recently, acknowledging significant heterogeneity in waveform interpretation, there has been an attempt to standardise key definitions and descriptors of waveform morphology by expert consensus.21,22 However, it remains the case that waveform morphology is complex and is dependent on location in the arterial tree as well as severity of disease. Waveform interpretation will therefore likely remain challenging and will continue to be associated with significant inter-observer variation. Machine learning tools, such as those tested in this study, may be useful in standardising assessment and reducing inter-observer variation when applied to other vessels or patient groups (e.g., carotid imaging).
In this study, we have found higher classification accuracy when using statistical time-domain and multiscale wavelet variance time-frequency features for classification, as compared to the ‘end-to-end’ based on the raw signal. However, this may not be an exhaustive list of putative features and further work is necessary to investigate optimal feature selection, which may further improve classification accuracy. Additionally, our study has focused on determining the feasibility of this approach and has not exhausted algorithm optimisation through hyperparameter tuning or alterations in the waveform reconstruction methodology (e.g., varying the step size when reconstructing the signal). Furthermore, improvements in accuracy may also be achieved by establishing a large repository of waveforms and thereby increasing the size of the dataset available for training. Importantly, these will have to be labelled accurately using a suitable reference test. In this study, we used a full lower-limb DUS as our reference standard. This has the advantage of being inexpensive, noninvasive and has also been shown to have a good agreement with intra-arterial digital subtraction angiography (DSA). 23 However, it may be less reliable in interrogating the commonly affected distal vessels in diabetes9,23 and may fail to detect isolated atherosclerotic PAD lesions in the foot vessels. Doppler arterial spectral waveform machine learning analysis may be able to detect isolated disease in the foot which would be associated with increased vascular resistance and a change in waveform morphology. It is possible that cases of isolated PAD in the foot may have been present but mislabelled using our chosen reference test. Alternative strategies, such as magnetic resonance angiography (MRA) and computed tomography angiography (CTA), may be suitable reference test alternatives.
Surprisingly, in our analysis we observed that a deep learning approach underperformed compared to logistic regression and support vector machine techniques. We also observed that support vector machines underperformed as compared to logistic regression. This may be because logistic regression is more vulnerable to overfitting. Although this is out of the scope of this proof-of-concept study, future work should focus on exploring this observation and systematically evaluating the effect of hyperparameter tuning, signal preprocessing, and a larger dataset on classification accuracy.
Further work, such as using advanced recurrent neural networks, 24 is also necessary to prospectively evaluate the diagnostic accuracy of our constructed machine learning algorithm and the feasibility of its implementation in real time clinical practice. To achieve this, the algorithm could be combined with a programme that automatically reconstructs the Doppler waveform without the need for manual user demarcation, which can be time-consuming and impractical in a busy clinical setting. Furthermore, recruited patients were representative of those presenting to high-risk diabetic foot clinics, with a high prevalence of PAD, neuropathy, and active ulceration. Therefore, although our results will be highly relevant to routine diabetic foot clinic practice, evaluation of its performance should also be assessed in low PAD prevalence settings such as primary and community care.
A significant strength of this study is that patients were representative of those that would be managed in routine clinical practice with high incidence of neuropathy and ulceration. Furthermore, as mentioned, reference imaging was used to determine the presence or absence of PAD.
Conclusion
We have constructed a machine learning algorithm with high discriminatory ability for the diagnosis of PAD using Doppler arterial spectral waveforms sampled at the ankle vessels. The algorithm has shown promise in terms of both accuracy and feasibility, although its future implementation in real time clinical practice requires further long-term prospective evaluation.
Supplemental Material
sj-pdf-1-vmj-10.1177_1358863X221105113 – Supplemental material for Machine learning-based classification of arterial spectral waveforms for the diagnosis of peripheral artery disease in the context of diabetes: A proof-of-concept study
Supplemental material, sj-pdf-1-vmj-10.1177_1358863X221105113 for Machine learning-based classification of arterial spectral waveforms for the diagnosis of peripheral artery disease in the context of diabetes: A proof-of-concept study by Pasha Normahani, Viknesh Sounderajah, Danilo Mandic and Usman Jaffer in Vascular Medicine
Footnotes
Acknowledgements
Infrastructure support for this research was provided by the NIHR Imperial Biomedical Research Centre (BRC). Contents of this manuscript are subject to an international patent filing (application no. 2101599.5, filed February 4, 2021).
Data Availability
The data that support the findings of this study are available on request from the corresponding author.
Declaration of conflicting interests
The authors declared no potential conflicts of interest with respect to the research, authorship, and/or publication of this article.
Funding
We acknowledge funding from Chelsea and Westminster Plus charity for the TrEAD study that preceded this work. Pasha Normahani is funded by a National Institute of Health Research (NIHR) Academic Clinical Lectureship.
Supplementary material
The supplementary material is available online with the article.
References
Supplementary Material
Please find the following supplemental material available below.
For Open Access articles published under a Creative Commons License, all supplemental material carries the same license as the article it is associated with.
For non-Open Access articles published, all supplemental material carries a non-exclusive license, and permission requests for re-use of supplemental material or any part of supplemental material shall be sent directly to the copyright owner as specified in the copyright notice associated with the article.