
Abstract
Introduction:
Several factors related to lesion characteristics and endovascular therapy (EVT) procedures have been reported to affect primary patency after EVT. However, it is unknown why these factors were associated with primary patency. We hypothesized patency failure was related to poor blood flow in affected arteries.
Methods:
This retrospective study included 131 consecutive patients who had received EVT with bare metal stents for peripheral artery disease caused by femoropopliteal artery lesions. Based on the tertile post-EVT flow velocity of the superficial femoral artery (SFA), patients were divided into high (n = 43), middle (n = 44), and low (n = 44) flow velocity groups. Flow velocity was measured using the frame count method. We measured incidence of major adverse limb events (MALE), composed of target lesion revascularization (TLR), non-TLR, and major amputation.
Results:
At a median follow-up period of 22.7 months, MALE had occurred in 7 (16.3%), 10 (22.7%), and 29 (65.9%) of patients from the high, middle, and low SFA flow velocity groups, respectively (p < 0.001). Kaplan–Meier analysis showed incidence of MALE was significantly higher in the patients of low SFA flow velocity (log-rank test χ2 = 38.8, p < 0.001). Multivariate analysis found low SFA flow velocity to be an independent predictor for MALE (hazard ratio: 4.42; 95% CI: 2.27 to 8.60; p < 0.001) as was ankle–brachial index.
Conclusion:
Post-EVT SFA flow velocity for femoropopliteal artery lesions treated with bare metal stents is an independent predictor of limb patency. The frame count method for assessing arterial flow velocity is convenient and has potential for wide applications in EVT.
Keywords
Introduction
The prevalence of peripheral artery disease (PAD) is 4–12%1–3 and has been increasing, mainly due to an aging population in study countries. 4 Patients with PAD usually have several atherosclerotic risk factors. Several tests are available for diagnosis of PAD. Ankle–brachial index (ABI) is useful for screening and surveillance of PAD.5,6 Duplex ultrasound, computed tomography angiography, and magnetic resonance angiography are useful for anatomical characterization of PAD.7–10 With regard to treatment, endovascular therapy (EVT) or bypass surgery are two options for revascularization, with selection depending on the anatomical location and extent of arterial lesions. 11 For EVT with self-expanding nitinol stents, recent studies have reported a 1-year patency rate of 63–83%12–15 and longer-term patency rates of 60–75%16,17 in short to intermediate-length lesions of the superficial femoral artery (SFA). Factors that have been reported to affect primary patency after EVT with self-expanding nitinol stents include lesion characteristics, such as presence of runoff vessels below the knee, poor ABI before EVT, and TransAtlantic InterSociety Consensus (TASC) classification D lesions.18,19 Factors related to EVT characteristics, such as insufficient stent enlargement and edge dissection, have also been reported to affect primary patency.20,21 However, it is unknown why these factors lead to worse outcomes. We hypothesized that patency failure was ultimately related to lower flow velocity in the affected arteries. To test this hypothesis, we measured angiographic flow velocity immediately after femoropopliteal stenting, and performed quantitative angiographic analysis. Specifically, we applied the thrombolysis in myocardial infarction (TIMI) frame count method 22 to measure flow velocity in these lower extremity lesions, then evaluated its effect on clinical outcomes.
Methods
Study design, setting, and participants
We retrospectively reviewed records of 131 consecutive patients with PAD caused by femoropopliteal artery lesions, who had received self-expanding nitinol stents at Yokosuka Kyosai Hospital from April 2016 to March 2019. When bilateral femoropopliteal artery disease was present and treated within the study period, we used the data from the limb that was treated first. Dual antiplatelet therapy with aspirin (100 mg once a day) and either ticlopidine (100 mg twice a day) or clopidogrel (75 mg once a day) were started more than 1 week before EVT. Prolonged treatment with dual antiplatelet therapy for at least 1 month after EVT and a lifelong course of aspirin was recommended to all patients by way of instruction to the referring physicians. Balloon angioplasty was performed using an optimal balloon size. All patients underwent self-expanding nitinol stent deployment. Patients who underwent EVT without stents or with interwoven nitinol stents, stent grafts, or drug eluting stents were excluded. Operators decided how many stents and what kind of stents were required, with the goal of bringing residual stenosis to < 30%. Patients with > 30% residual stenosis after EVT were excluded. There were no exclusion criteria related to age or lesion length. Although angiographic frame count could be affected by cardiac output, such as with heart failure or aortic stenosis, we did not exclude patients with possibly reduced cardiac output.
The hospital’s ethics committee approved this study protocol and did not require informed consent. The study was performed in accordance with the Declaration of Helsinki.
Outcomes
The clinical outcomes studied were the incidence of major adverse limb events (MALE) and major adverse events (MAE). A MALE was defined as the composite of both major amputation and re-intervention, which included target lesion revascularization (TLR) and non-TLR. TLR was defined as revascularization for a stenosis or occlusion within the stent or within 5 mm adjacent to the stent. Non-TLR was defined as revascularization for ipsilateral SFA without a stent. MAE was defined as a composite of MALE and all-cause death.
Data measurement
Biochemical measurements were performed the day before EVT.
Figure 1 shows the method of measuring flow velocity by application of the frame count method. We used automatic contrast dye injection and all angiograms were filmed at 15 frames/s. The number of frames was counted from when contrast reached the distal edge of the guiding catheter to a landmark point of the SFA. The landmark point was an arbitrary point appearing in the same frame as the guiding catheter. The vessel length between the distal edge of the guiding catheter and the landmark point of the SFA was measured by quantitative angiographic analysis. Using these two values, SFA flow velocity was calculated as:

Patients were divided into three groups – high, middle, and low SFA flow velocity groups – using the tertile value of SFA flow velocity.
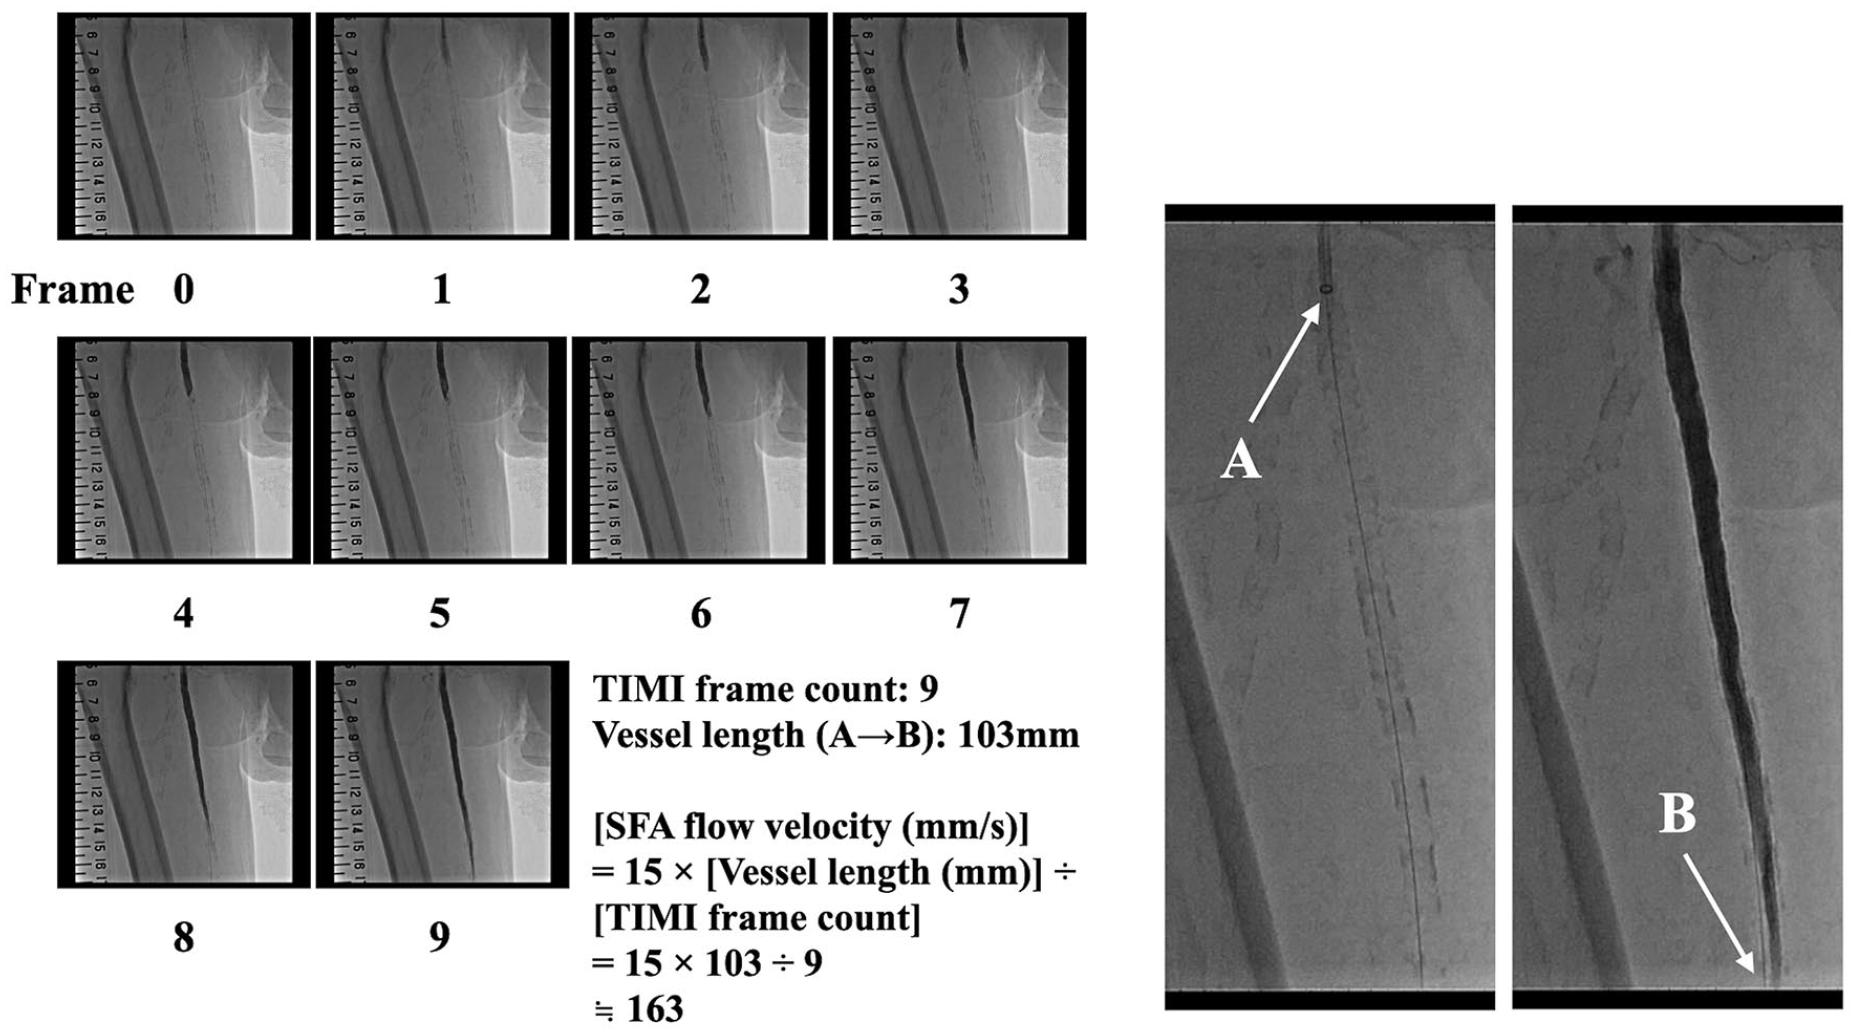
An example of how to calculate SFA flow velocity. We used automatic contrast dye injection and all angiograms were filmed at 15 frames/s. Point A is the distal edge of the guiding catheter. Point B is a distal SFA landmark. The landmark point was an arbitrary point appearing in the same frame as the guiding catheter. The number of frames was counted from when contrast reached point A to point B. The length between point A and point B is measured by quantitative angiographic analysis.
Statistical methods
Normality of the data was verified using the Kolmogorov–Smirnov test. Continuous variables are expressed as mean ± standard deviation if they were normally distributed, and as medians with interquartile range otherwise. Inter-group comparison was performed using Student’s t-test or the Mann–Whitney test, and categorical comparisons were performed using Fisher’s exact test. Time-to-event data were analyzed with the Kaplan–Meier method and the log-rank test. Cox regression analysis was used to identify the predictors of MALE and MAE. The hazard ratio (HR) and its 95% CI were computed. Multivariate Cox regression analysis was performed using variables with p < 0.05 in univariate Cox regression analysis. All statistical analyses were performed using statistical software EZR, version 1.33 (Jichi Medical University Saitama Medical Center, Japan). 23 Statistical significance was defined as p < 0.05.
Results
Participants
Tertile values of post-EVT SFA flow velocity were 105 and 148 mL/s, and led to 43, 44, and 44 patients allocated to the high, middle, and low SFA flow velocity groups, respectively.
Descriptive data
Patient characteristics of each group are shown in Table 1. There were 86 males (65.6%) and mean age was 73.8 years old. The number of patients with chronic limb-threatening ischemia was 31 (23.7%), TASC II C or D was 57 (43.5%), and chronic total occlusion was 61 (46.6%). Significant differences in lesion and periprocedural characteristics between the three groups were observed in runoff vessels below the knee before EVT (p = 0.03), TASC II C or D lesion (p = 0.03), total number and length of stents (p = 0.04, p < 0.001), and ABI after EVT (p = 0.001 ).
Patient, lesion, and procedural characteristics.
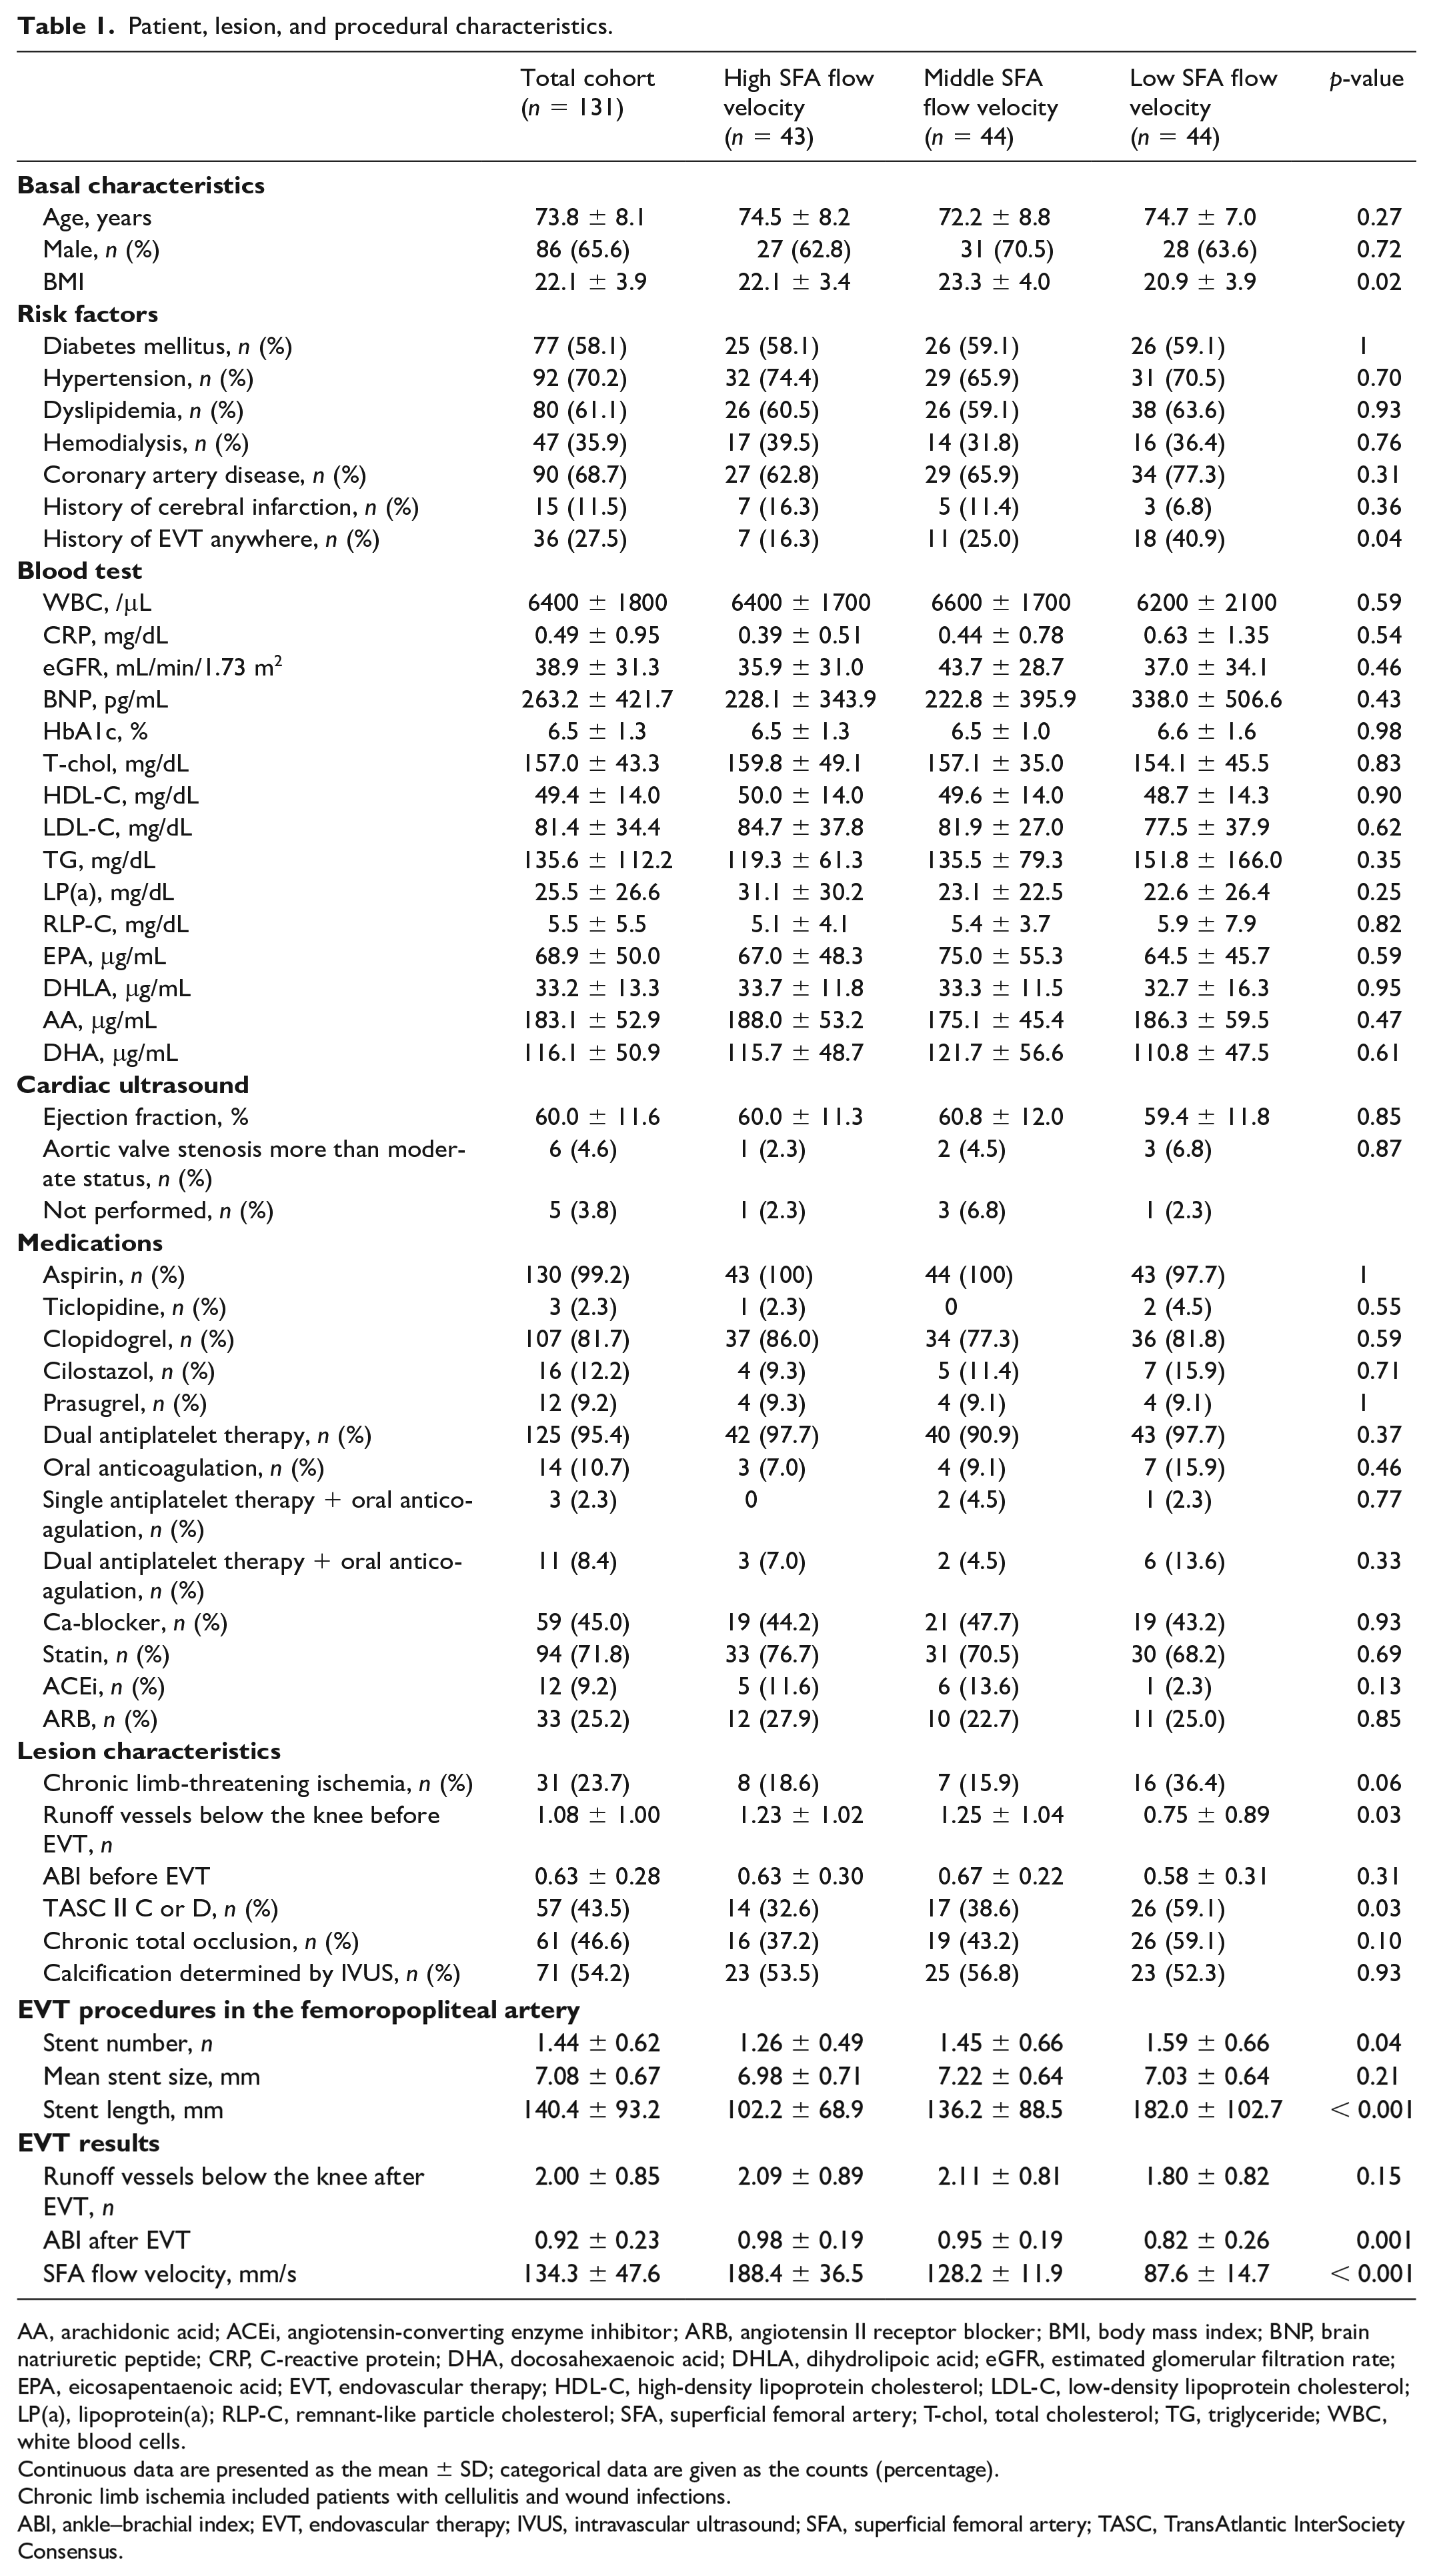
AA, arachidonic acid; ACEi, angiotensin-converting enzyme inhibitor; ARB, angiotensin II receptor blocker; BMI, body mass index; BNP, brain natriuretic peptide; CRP, C-reactive protein; DHA, docosahexaenoic acid; DHLA, dihydrolipoic acid; eGFR, estimated glomerular filtration rate; EPA, eicosapentaenoic acid; EVT, endovascular therapy; HDL-C, high-density lipoprotein cholesterol; LDL-C, low-density lipoprotein cholesterol; LP(a), lipoprotein(a); RLP-C, remnant-like particle cholesterol; SFA, superficial femoral artery; T-chol, total cholesterol; TG, triglyceride; WBC, white blood cells.
Continuous data are presented as the mean ± SD; categorical data are given as the counts (percentage).
Chronic limb ischemia included patients with cellulitis and wound infections.
ABI, ankle–brachial index; EVT, endovascular therapy; IVUS, intravascular ultrasound; SFA, superficial femoral artery; TASC, TransAtlantic InterSociety Consensus.
Outcome data
Table 2 summarizes clinical outcomes for each group. There were significant differences between the three groups in TLR, non-TLR, and all-cause death, but not in amputations. In addition, there were significant differences between the three groups in both the composite outcomes of MALE and MAE. The Kaplan–Meier estimates of MALE at 30 months were 16.5%, 25.5%, and 81.4% for high, middle, and low flow velocity, respectively (HR: 3.08; 95% CI: 2.00 to 4.77; p < 0.001) (Figure 2). The Kaplan–Meier estimates of MAE at 30 months were 28.5%, 40.5%, and 90.0%, respectively (HR: 2.71; CI: 1.90 to 3.87; p < 0.001) (Figure 3).
Clinical outcomes.
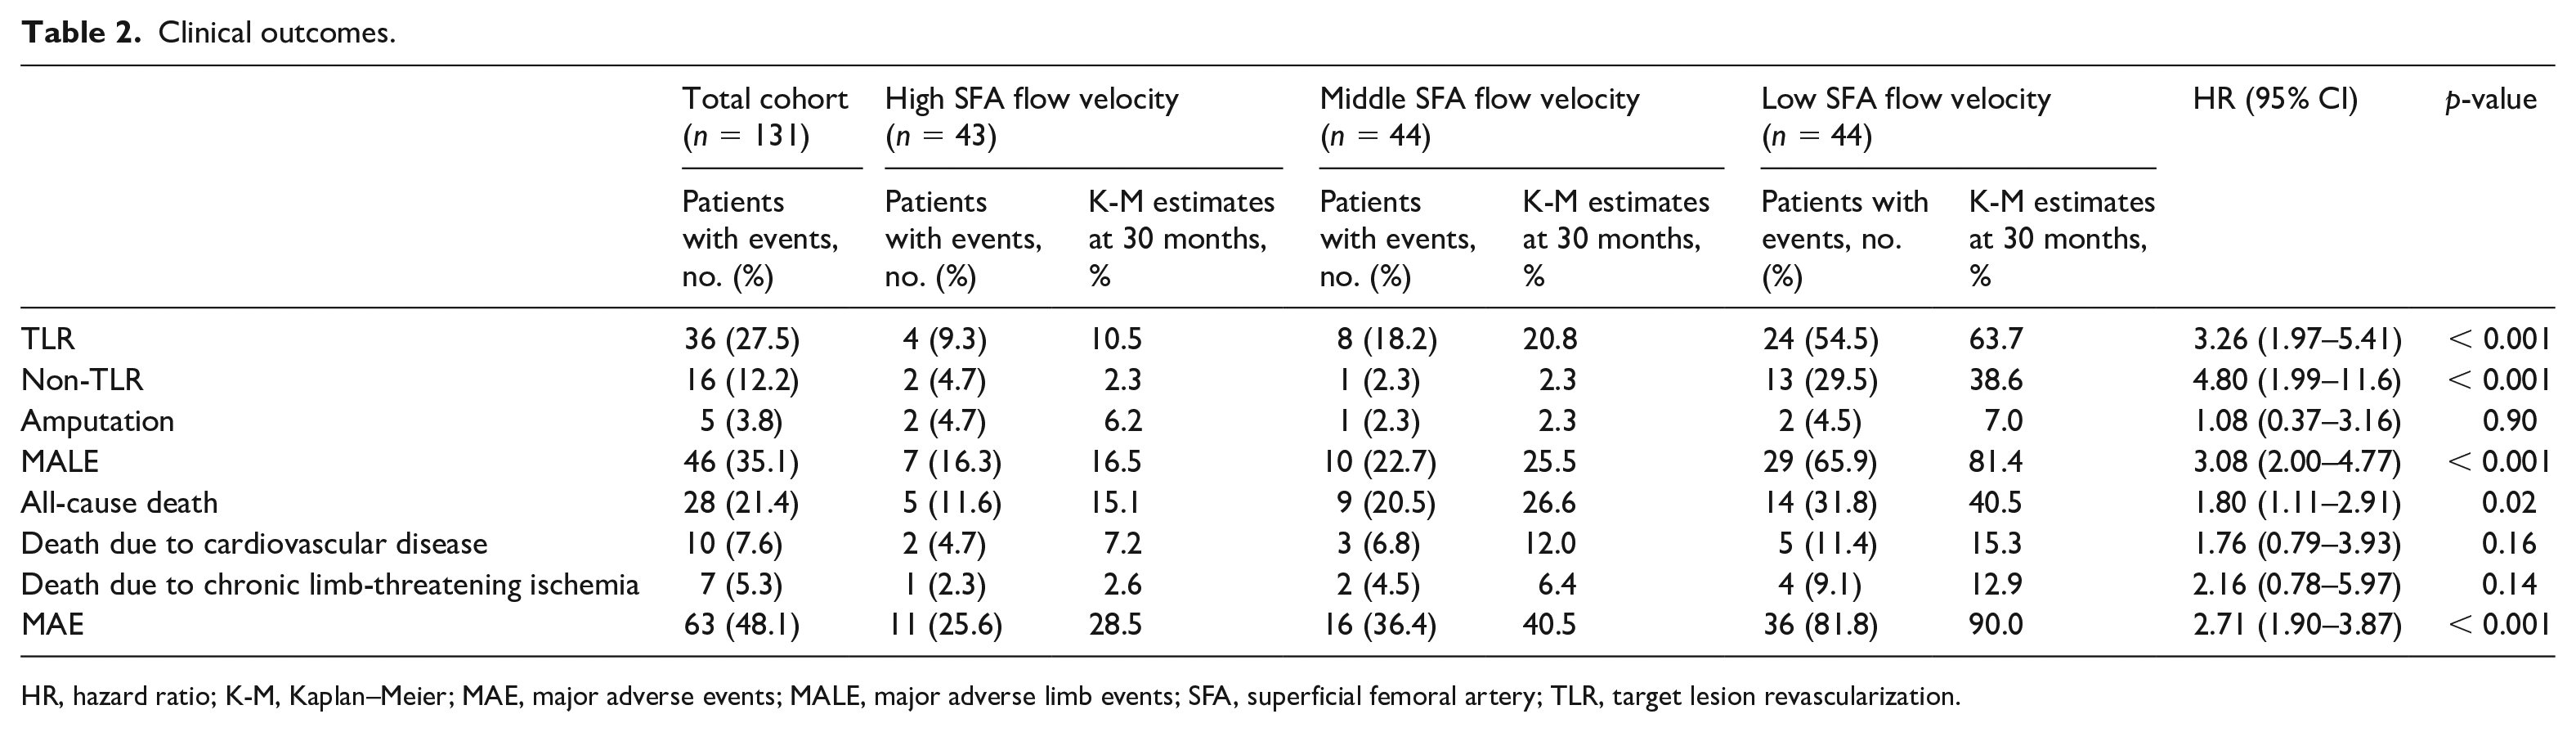
HR, hazard ratio; K-M, Kaplan–Meier; MAE, major adverse events; MALE, major adverse limb events; SFA, superficial femoral artery; TLR, target lesion revascularization.
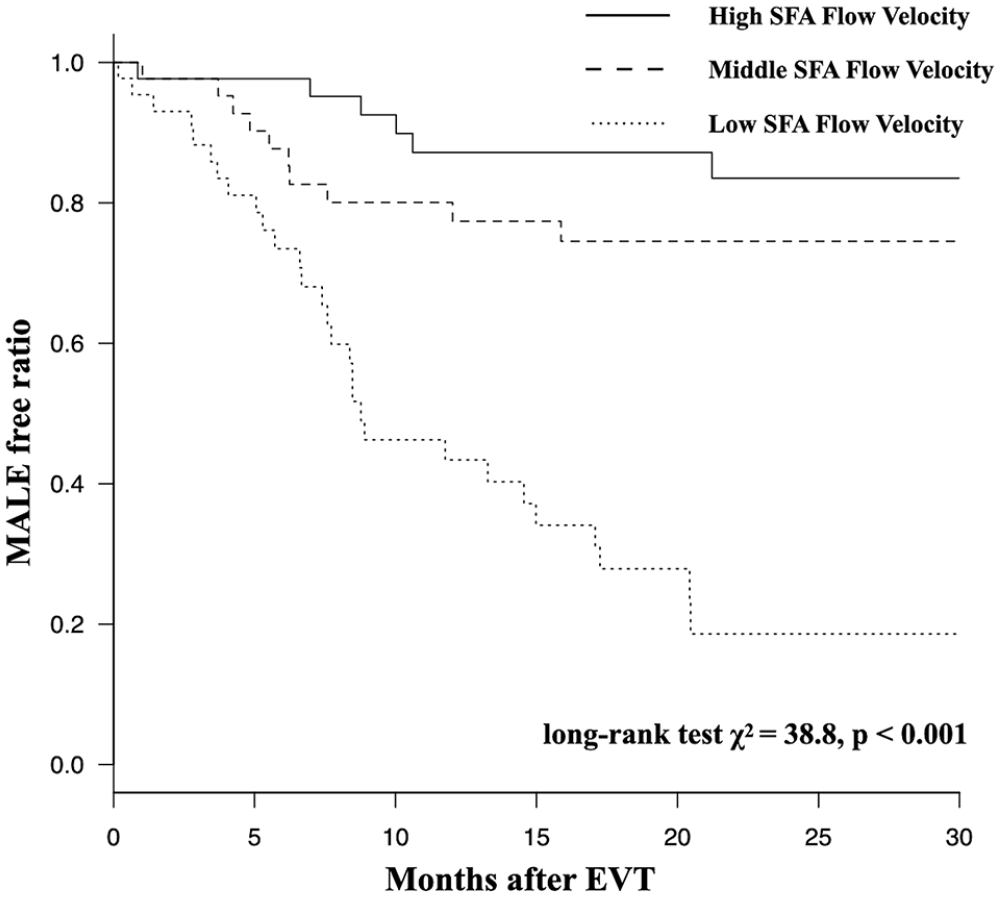
Kaplan–Meier curves for major adverse limb events (MALE).
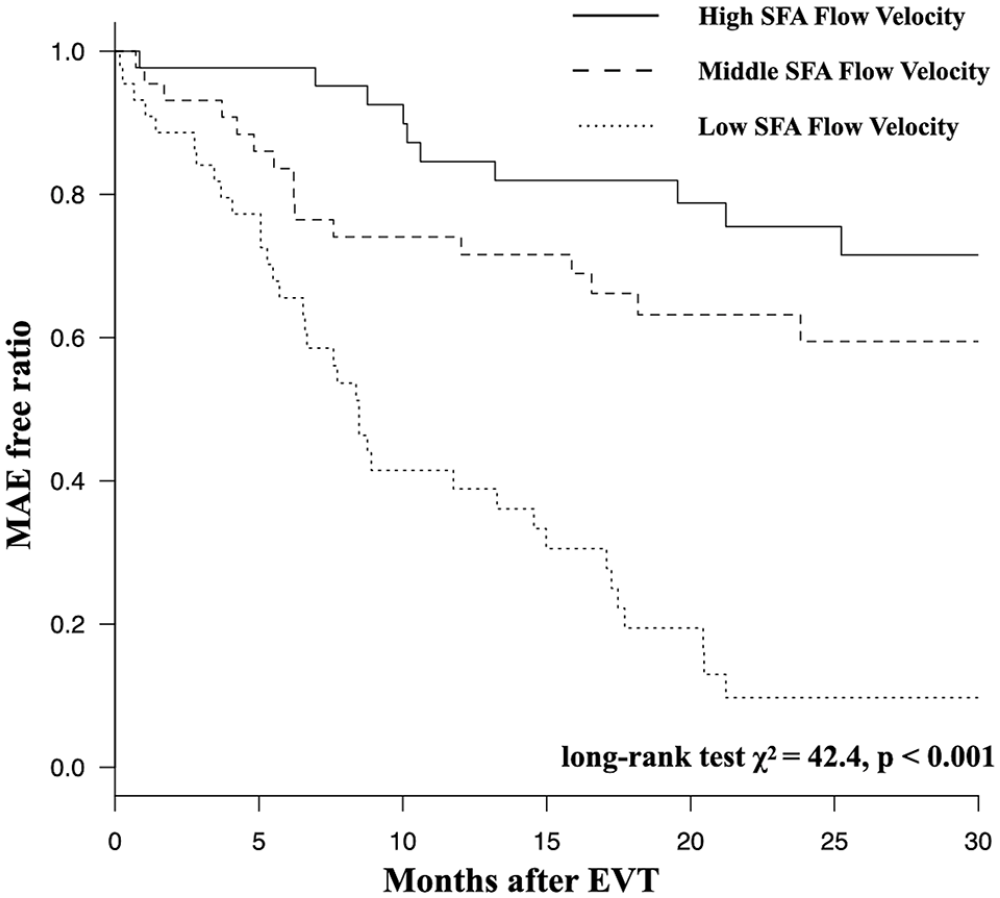
Kaplan–Meier curves for major adverse events (MAE).
Independent predictors of MALE are summarized in Table 3. Univariate Cox regression analysis showed several parameters were significantly associated with MALE – namely, sex, number of runoff vessels below the knee lesion before EVT, ABI before and after EVT, and total length of stents – but only two parameters, namely ABI after EVT (HR: 0.11; CI: 0.03 to 0.37; p < 0.001) and low SFA flow velocity defined as the lowest tertile of SFA flow velocity (HR: 4.42; 2.27 to 8.60; p < 0.001), remained independent in multivariate Cox regression analysis.
Multivariate Cox regression analysis for major adverse limb events (MALE).
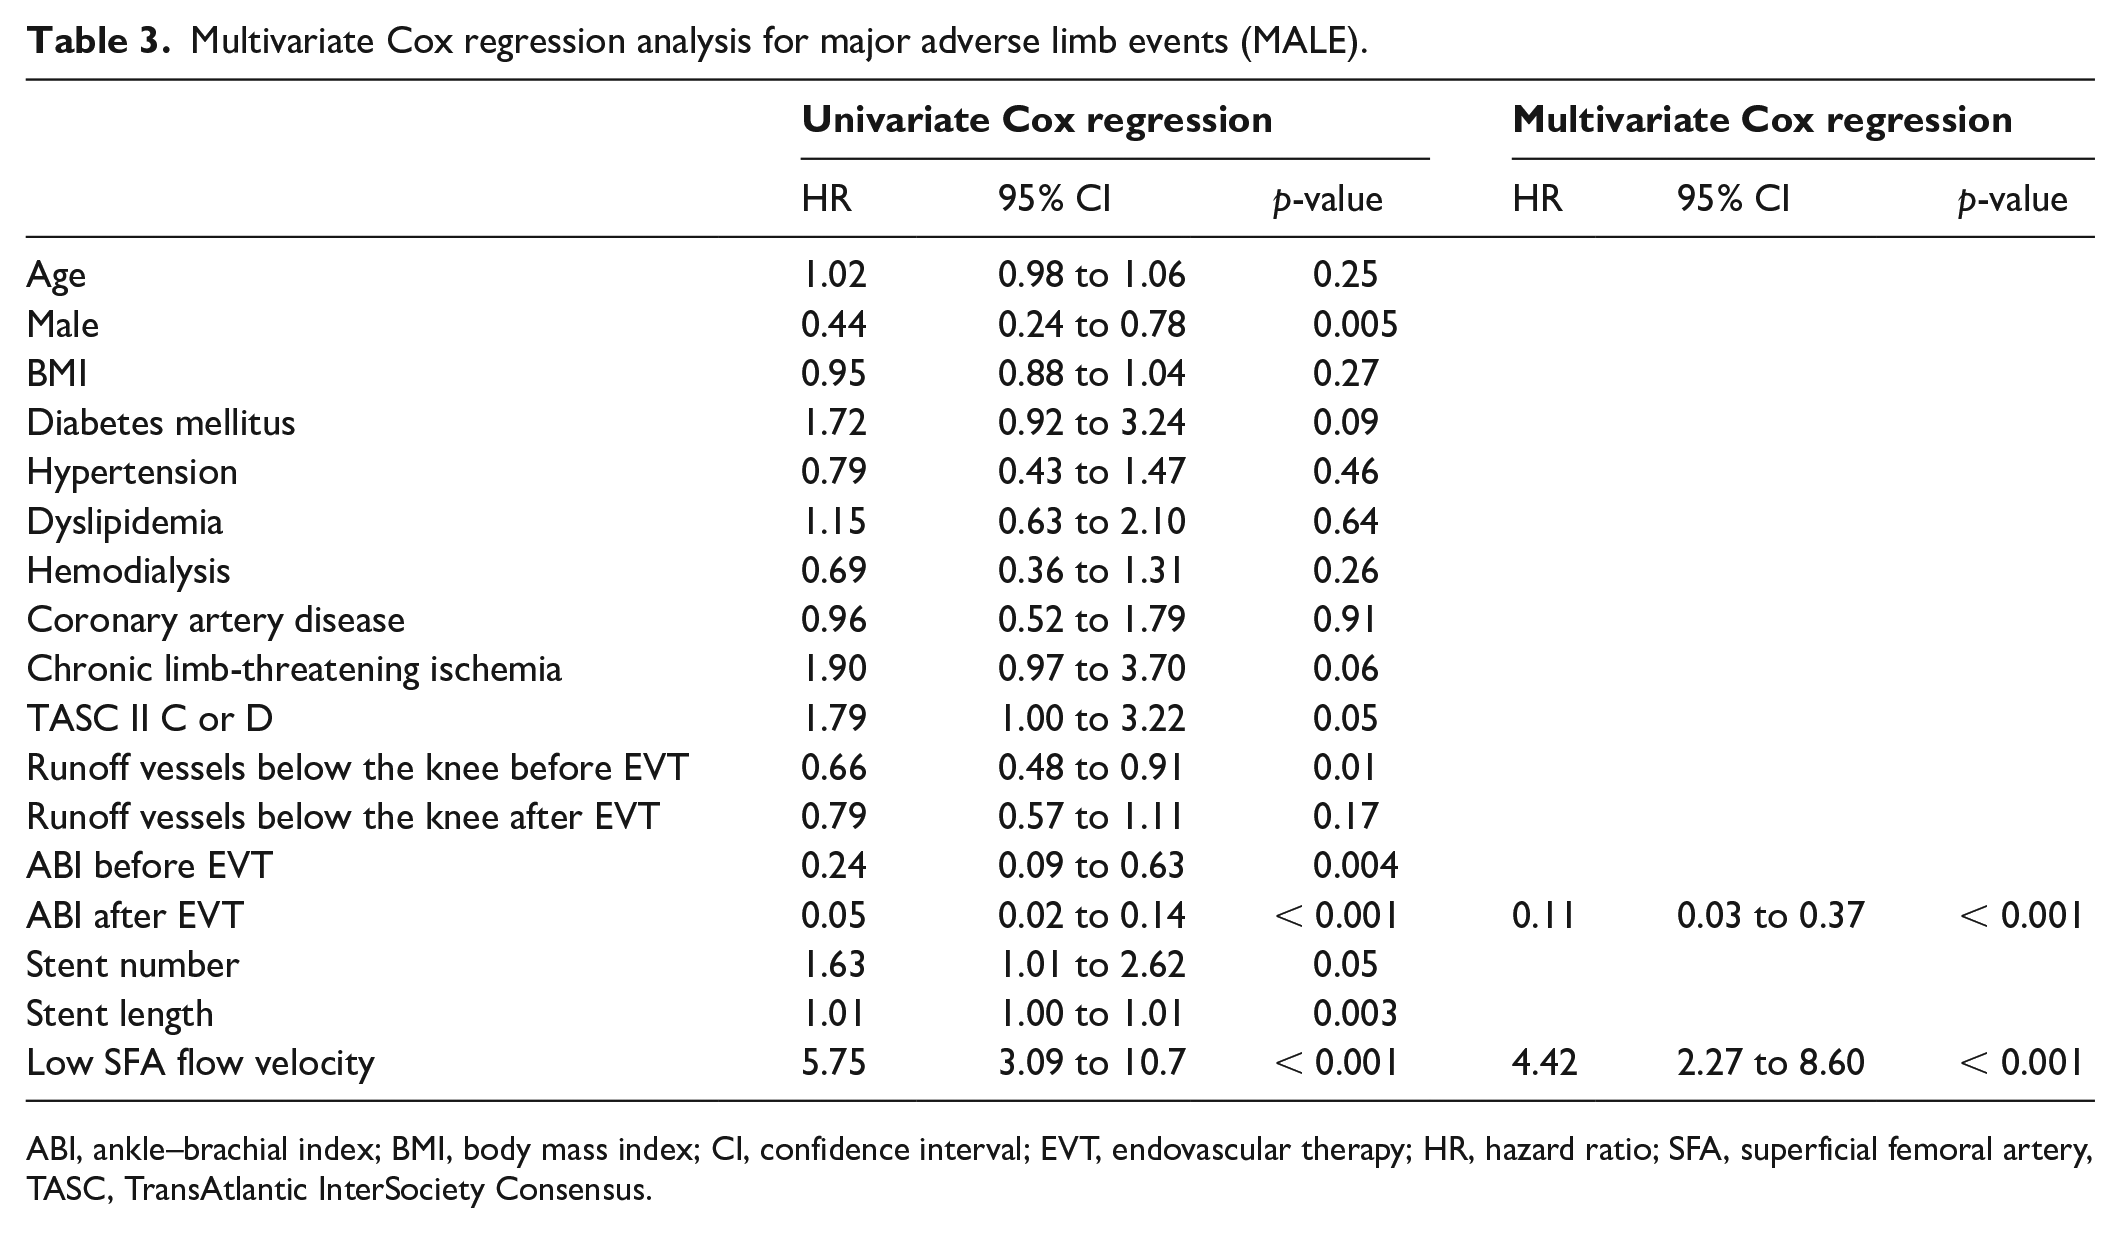
ABI, ankle–brachial index; BMI, body mass index; CI, confidence interval; EVT, endovascular therapy; HR, hazard ratio; SFA, superficial femoral artery, TASC, TransAtlantic InterSociety Consensus.
Independent predictors of MAE (MALE plus all-cause death) are summarized in Table 4. Univariate predictors were identical to that for MALE except for the loss of sex and the addition of chronic limb ischemia, TASC II C or D, number of runoff vessel below the knee lesion after EVT, and stent number. In multivariate analysis, ABI after EVT (HR: 0.12; 0.04 to 0.34; p < 0.001) and low SFA flow velocity (HR: 3.66; 2.09 to 6.44; p < 0.001) were again independent predictors of MAE as they had been for MALE. Chronic limb-threatening ischemia was additionally found to be an independent predictor of MAE (HR: 1.78; 1.00 to 3.19; p = 0.05).
Multivariate Cox regression analysis for major adverse events (MAE).
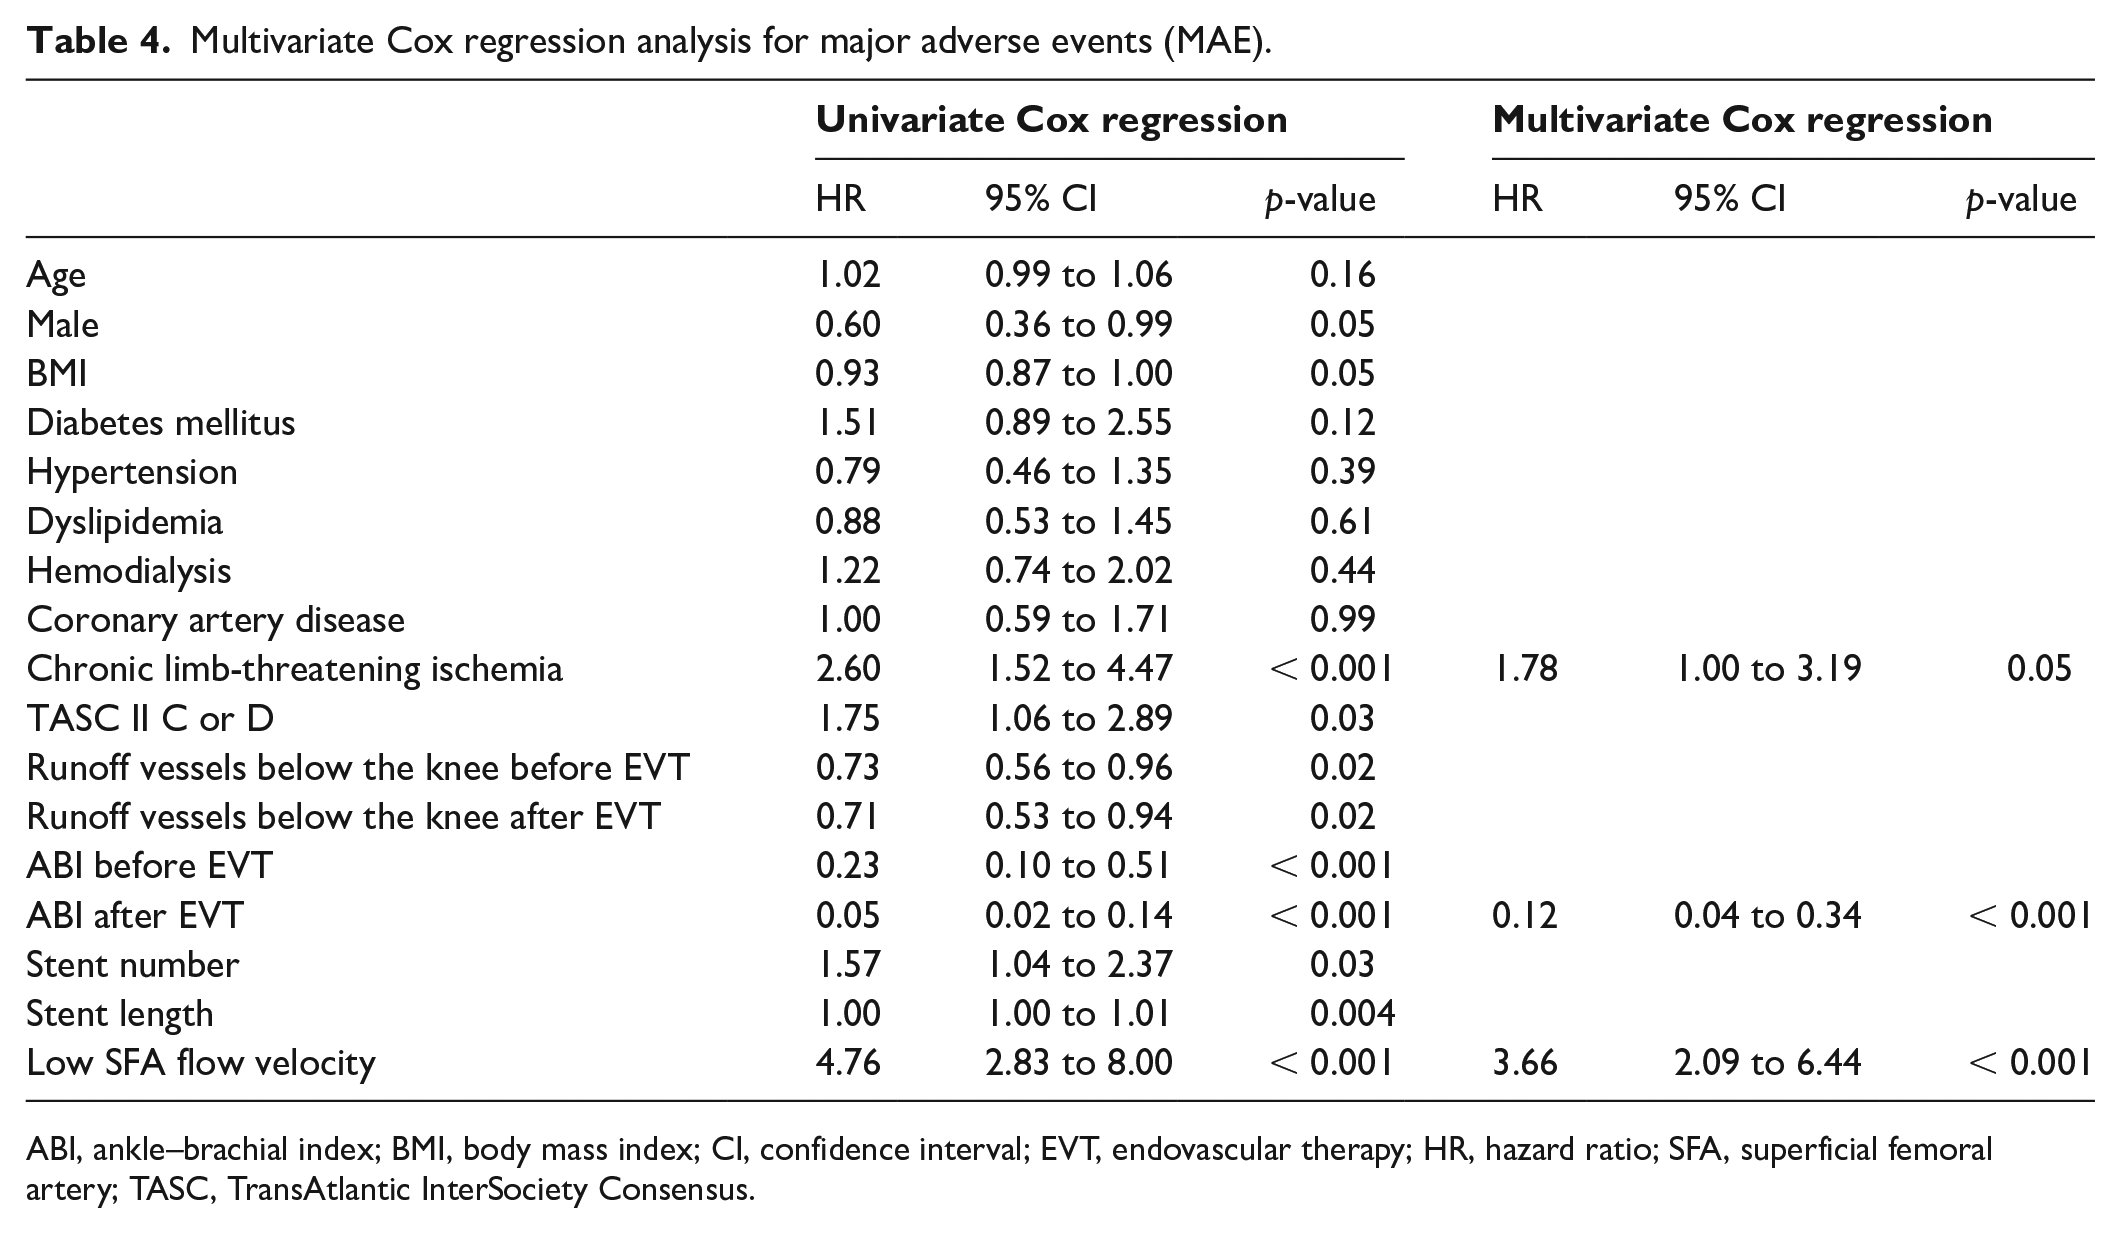
ABI, ankle–brachial index; BMI, body mass index; CI, confidence interval; EVT, endovascular therapy; HR, hazard ratio; SFA, superficial femoral artery; TASC, TransAtlantic InterSociety Consensus.
Discussion
Key results
Recent studies have reported that poor runoff vessels below the knee or poor ABI before EVT, and TASC D lesions, showed lower primary patency after EVT.18,19 The new and main finding of the current study is that low SFA flow velocity defined as the lowest tertile of SFA flow velocity after EVT is an independent predictor of MALE with a high HR of 4.4 alongside poor ABI, where, to reiterate, MALE was defined as the composite of major amputation and re-intervention.
Interpretation
Recent studies have reported multiple lesion characteristics and insufficient stent enlargement and edge dissection as being associated with unacceptable limb patency.18–21 All of these factors can cause low SFA flow velocity, which EVT is supposed to improve. When EVT is performed in patients with PAD, limb patency is affected by the endpoint of EVT. Use of imaging devices such as intravascular ultrasound can prevent insufficient stent enlargement and edge dissection. When stent edge dissection occurs, additional stent placement is considered depending on whether or not the dissection is limiting flow. Calculation of SFA flow velocity may be useful as an objective marker for making this decision. Likewise, SFA flow velocity may be effective for determining the EVT endpoint. Many patients with PAD undergoing EVT are found to have accompanying below the knee artery disease, whose indications for EVT are narrower. In such cases, SFA flow velocity may be useful for judging whether simultaneous intervention for below the knee artery lesion is warranted. Our method of measurement of SFA flow velocity is convenient for clinical situations because it can be measured easily while performing EVT, and does not require extra equipment such as catheters that measure flow velocity or ultrasound.
There are several reasons why SFA flow velocity after EVT with bare metal stents was associated with limb patency. A recent histopathological study suggested thromboembolic phenomena could be occurring in lower leg vessels of patients with chronic limb-threatening ischemia, although the source of thrombus was unknown. 24 Considering the results of this study, low SFA flow velocity may induce thrombus formation and cause thromboembolic phenomena. A recent randomized trial reported that low-dose rivaroxaban plus aspirin was associated with a significantly lower incidence of limb events than aspirin only. 25 This result is consistent with the suggestion that thromboembolic phenomena are associated with limb events. However, association between SFA flow velocity after EVT and antithrombotic therapy is unclear. Further research is required to determine whether antithrombotic therapy can improve limb events in patients with low SFA flow velocity after EVT.
In the coronary arteries, blood flow and microvascular resistance are closely associated.26,27 If this relationship applies similarly to lower limb arteries, SFA flow velocity could be associated with microvascular resistance of lower limb arteries. In pathological conditions such as a long-lasting stenosis of SFA, an increase in microvascular resistance may occur because the putative regulatory mechanism becomes progressively exhausted. 28 In addition, atherosclerosis induces vascular dysfunction such as nitric oxide reduction, vasodilation inhibition, smooth muscle proliferation increase, and angiogenesis demotion. 29 Recent studies reported that microvascular endothelial function in peripheral artery and coronary artery were correlated, 30 and peripheral artery dysfunction was associated with a risk of cardiovascular events in patients with coronary artery disease.31,32 Microvascular resistance likely cannot improve immediately after EVT considering that the changes have been induced over a long period of stenosis. EVT for femoropopliteal artery disease may not improve SFA flow velocity in patients with high resistance of lower limb arteries, and our results that risk of all-cause death was significantly higher in patients with low SFA flow velocity after EVT than patients with high SFA flow velocity after EVT may reflect this.
To summarize, the relationship between SFA flow velocity and adverse events we found could have two causes. One is underlying severe pathology such as high microvascular resistance that cannot be improved easily by EVT, and the other is less than optimal stenting techniques. Adverse events due to the latter can be remedied by improving technique, possibly with the adjunct use of SFA flow velocity measurements. Which of the two causes plays the larger role is something that will have to be determined by further studies.
Study limitations
This was a retrospective, observational, and single-center study, based on a small number of patients. Dual antiplatelet therapy was recommended for at least 1 month after EVT, but how long the recommendation was followed depended on patients and their outpatient doctors. We did not control for potential biases among the population such as presence of diseases that could reduce flow velocity, including heart failure and aortic stenosis, and types of lesions, although left ventricular ejection fraction, incidence of aortic stenosis, and calcified lesions did not differ statistically between the flow velocity groups. We excluded EVT using interwoven nitinol stents, stent grafts, or drug eluting stents from our study, so our results may not be generalizable to other kinds of stents, although we expect the relationship between SFA flow velocity and clinical outcome to hold. We note that all stents that were used in the current study are available internationally. We did not compare frame count based on SFA flow velocity measurements against measurements by established methods such as duplex ultrasound. With regard to generalizability, an advantage of the frame count method is that it makes use of equipment already at hand during EVT procedures, it is simple, and requires no training. It also gives an integrated measure of flow whereas the duplex technique gives localized velocities. Most labs perform angiography with low frame rates (2–4 frames/s) to minimize radiation dose, whereas we filmed once at 15 frames/s in order to use the frame count method, which required limited extra radiation. However, if employing the frame count method, extra care may be taken to limit the window of exposure. A major limitation of our study is that it does not provide insights into the mechanism by which low flow velocities lead to poor outcome. One way to differentiate between contributions of lesion features and EVT quality to clinical outcome would be to compute improvement in flow velocity by measuring SFA flow velocity before EVT as well as after.
Conclusion
SFA flow velocity after EVT for femoropopliteal artery lesions with bare metal stents is an independent predictor of limb patency. The frame count method for assessing arterial flow velocity is convenient and has potential for wide applications in EVT.
Footnotes
Declaration of conflicting interests
The authors declared no potential conflicts of interest with respect to the research, authorship, and/or publication of this article.
Funding
The authors received no financial support for the research, authorship, and/or publication of this article.