
Abstract
This study examined the potential correlation between pulmonary embolism (PE) attenuation on computed tomography pulmonary angiography (CTPA) and pulmonary artery hemodynamic response to catheter-directed thrombolysis (CDT) in 10 patients with submassive PE. Treatment parameters, PE attenuation, clot burden, computed tomography signs of right ventricle dysfunction and right ventricular systolic pressure at echocardiography were retrospectively analyzed to determine correlation with pulmonary artery pressure improvement using Spearman correlation. A single reader, blinded to the treatment results, measured PE attenuation of all patients. There was a significant positive correlation between PE attenuation and absolute pulmonary artery pressure improvement with a Spearman correlation of 0.741, p=0.014. When attenuation was greater than or equal to the median (44.5 HU, n=5), CDT was associated with significantly better pulmonary artery pressure improvement (p=0.037). Clot attenuation at CTPA may be a potential imaging biomarker for predicting pulmonary artery pressure improvement after CDT.
Introduction
Pulmonary embolism (PE) is the third most common cause of cardiovascular death following myocardial infarction and stroke. 1 Recent studies have shown cerebral artery clot attenuation in stroke patients has value for predicting treatment success with systemic thrombolysis and catheter-directed therapies.2–4 However, the utility of computed tomography (CT) attenuation for predicting PE response to catheter-directed thrombolysis (CDT) has not been studied. Therapies for submassive and massive PE include anticoagulation, systemic thrombolysis, CDT and surgical embolectomy. 5
Recent studies have shown that CDT may be an effective therapy for submassive and massive PE when available.6,7 Some of the proposed benefits of CDT over systemic thrombolysis include superior hemodynamic response, lower bleeding risk, improved right heart restoration, expedited clot dissolution and potentially better mortality outcomes. 8 More data are needed to guide patient selection for CDT versus alternative therapies. Imaging biomarkers on CT may have a role in predicting therapeutic success for different treatment modalities. The aim of this study was to determine if there exists a correlation between pulmonary embolism attenuation at CT pulmonary angiography (CTPA) and pulmonary artery hemodynamic response to CDT.
Materials and methods
Patient selection
Institutional review board approval was obtained for this retrospective single-institution study. All patients who had a CTPA scan and subsequently underwent CDT for submassive PE between November 2012 and March 2017 were included. Submassive PE was defined as PE in the setting of right ventricle (RV) dysfunction without hemodynamic instability. 9 In total, 19 patients were identified. Three patients were excluded because of concomitant use of mechanical fragmentation and six patients were excluded because pulmonary artery pressures were not recorded.
CT protocol
The CTPA scans were performed on a SOMATOM Definition Flash (Siemens, Munich, Germany) dual-source scanner with a single breath hold. Image acquisition parameters included a 1.2 pitch, 120 kVp, 20 mAs (quality reference), and 128 × 0.6 mm collimation. Images were reconstructed using the sinogram-affirmed iterative reconstruction technique with an iterative strength of 2, 1.5 mm slice thickness, 1.0 mm increment, with coverage from lung apices through the bottom of the lungs.
To determine PE attenuation, a region of interest (ROI) was drawn through the thromboembolus by a single reader blinded to the intervention results. To minimize the effects of volume averaging, the ROI was placed at least 2 mm from the vessel wall and 2 mm away from adjacent iodinated contrast within the pulmonary artery, in the largest portion of clot (Figure 1). Attenuation was reported in Hounsfield units (HU). In patients with bilateral PE, the highest density measurement was recorded.
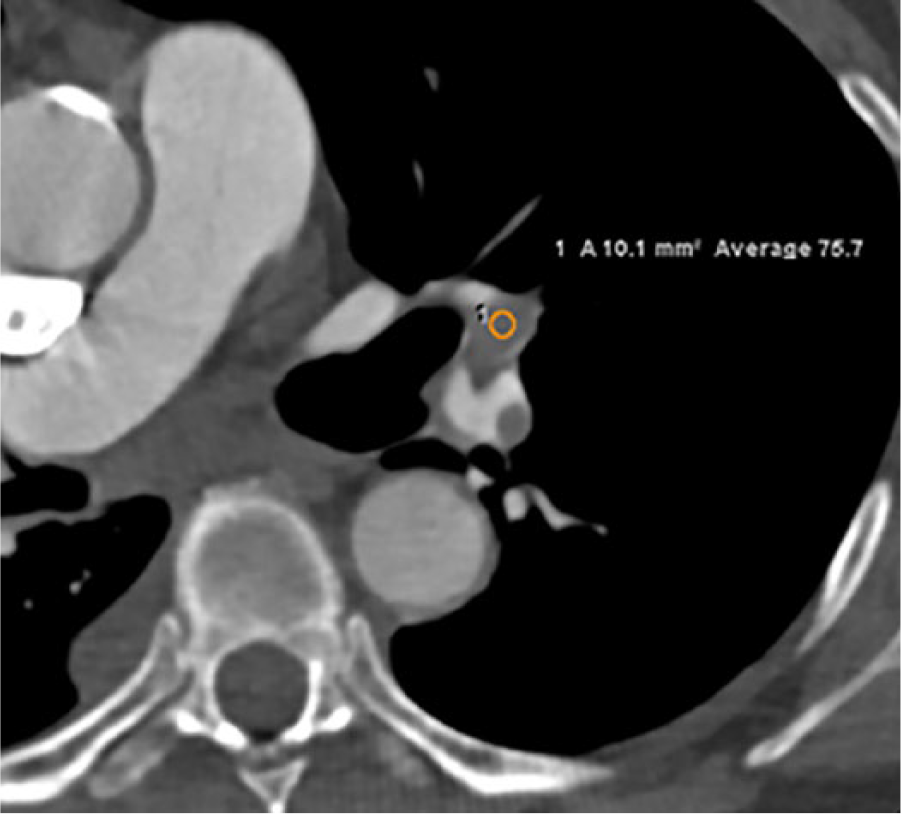
Representative image demonstrating the HU measurement technique. A 10-mm2 ROI (circle) was drawn over a left pulmonary artery embolus. Within the ROI, the calculated approximate average attenuation was 76 HU. HU, Hounsfield unit; ROI, region on interest.
Procedure
Interventions were performed by four attending interventional radiologists with 10–25 years of experience. Procedures were performed via right internal jugular vein or right common femoral vein access. A 5-French pigtail catheter was advanced into the pulmonary arteries and angiograms were performed. Mean pulmonary artery pressure measurements were obtained through the pigtail catheter. In patients with unilateral emboli, the catheter was advanced into the respective pulmonary artery adjacent to the embolus. In patients with bilateral pulmonary emboli, a second catheter was inserted and both catheters were advanced into the main pulmonary arteries adjacent to the clot, as previously described. 10 Infusion of tissue plasminogen activator (tPA) was then performed through the catheter at a rate of 0.5–1.5 mg/h. In two patients, the pigtail catheter was exchanged for an ultrasound-enhanced thrombolysis catheter (EKOS EndoWave Infusion Catheter System; EKOS Corp., Bothell, WA, USA), which was placed directly into the clot and through which tPA was infused. Prior to removing the catheters at the completion of thrombolysis, mean pulmonary artery pressures were again measured. All post-CDT pulmonary artery pressure measurements were obtained through pigtail catheters.
Statistical analysis
Statistical analysis was performed with SAS software, Version 9.4 (SAS Institute Inc., Cary, NC, USA). Spearman correlation was performed to measure correlation between pulmonary artery pressure change and potential predictors for CDT response, including clot attenuation, embolic burden, right ventricle: left ventricle (RV:LV) ratio and procedure parameters. Comparison of pulmonary artery pressure improvement based on clot attenuation above and below the median attenuation was performed with the two-tailed Mann–Whitney U test. Statistical significance was defined as p<0.05.
Results
Ten patients were included in this study for analysis. All patients had evidence of RV dysfunction, which was confirmed at transthoracic two-dimensional echocardiography. Baseline patient characteristics are provided in Table 1. The mean duration of symptoms prior to CDT was 46.9 ± 60.4 hours. The mean PE attenuation at CTPA was 46.9 ± 18.2 HU. Mean RV systolic pressure at echocardiography was 58.4 ± 14.1 mmHg. Mean N-terminal pro-brain natriuretic peptide was 2486.3 ± 1353.7 pg/mL. Mean troponin T was 0.17 ± 0.3 ng/mL. The mean RV:LV ratio at CTPA was 1.5 ± 0.4. Seven patients had contrast reflux into the inferior vena cava (IVC), a CT biomarker for right heart dysfunction.
Baseline patient characteristics.
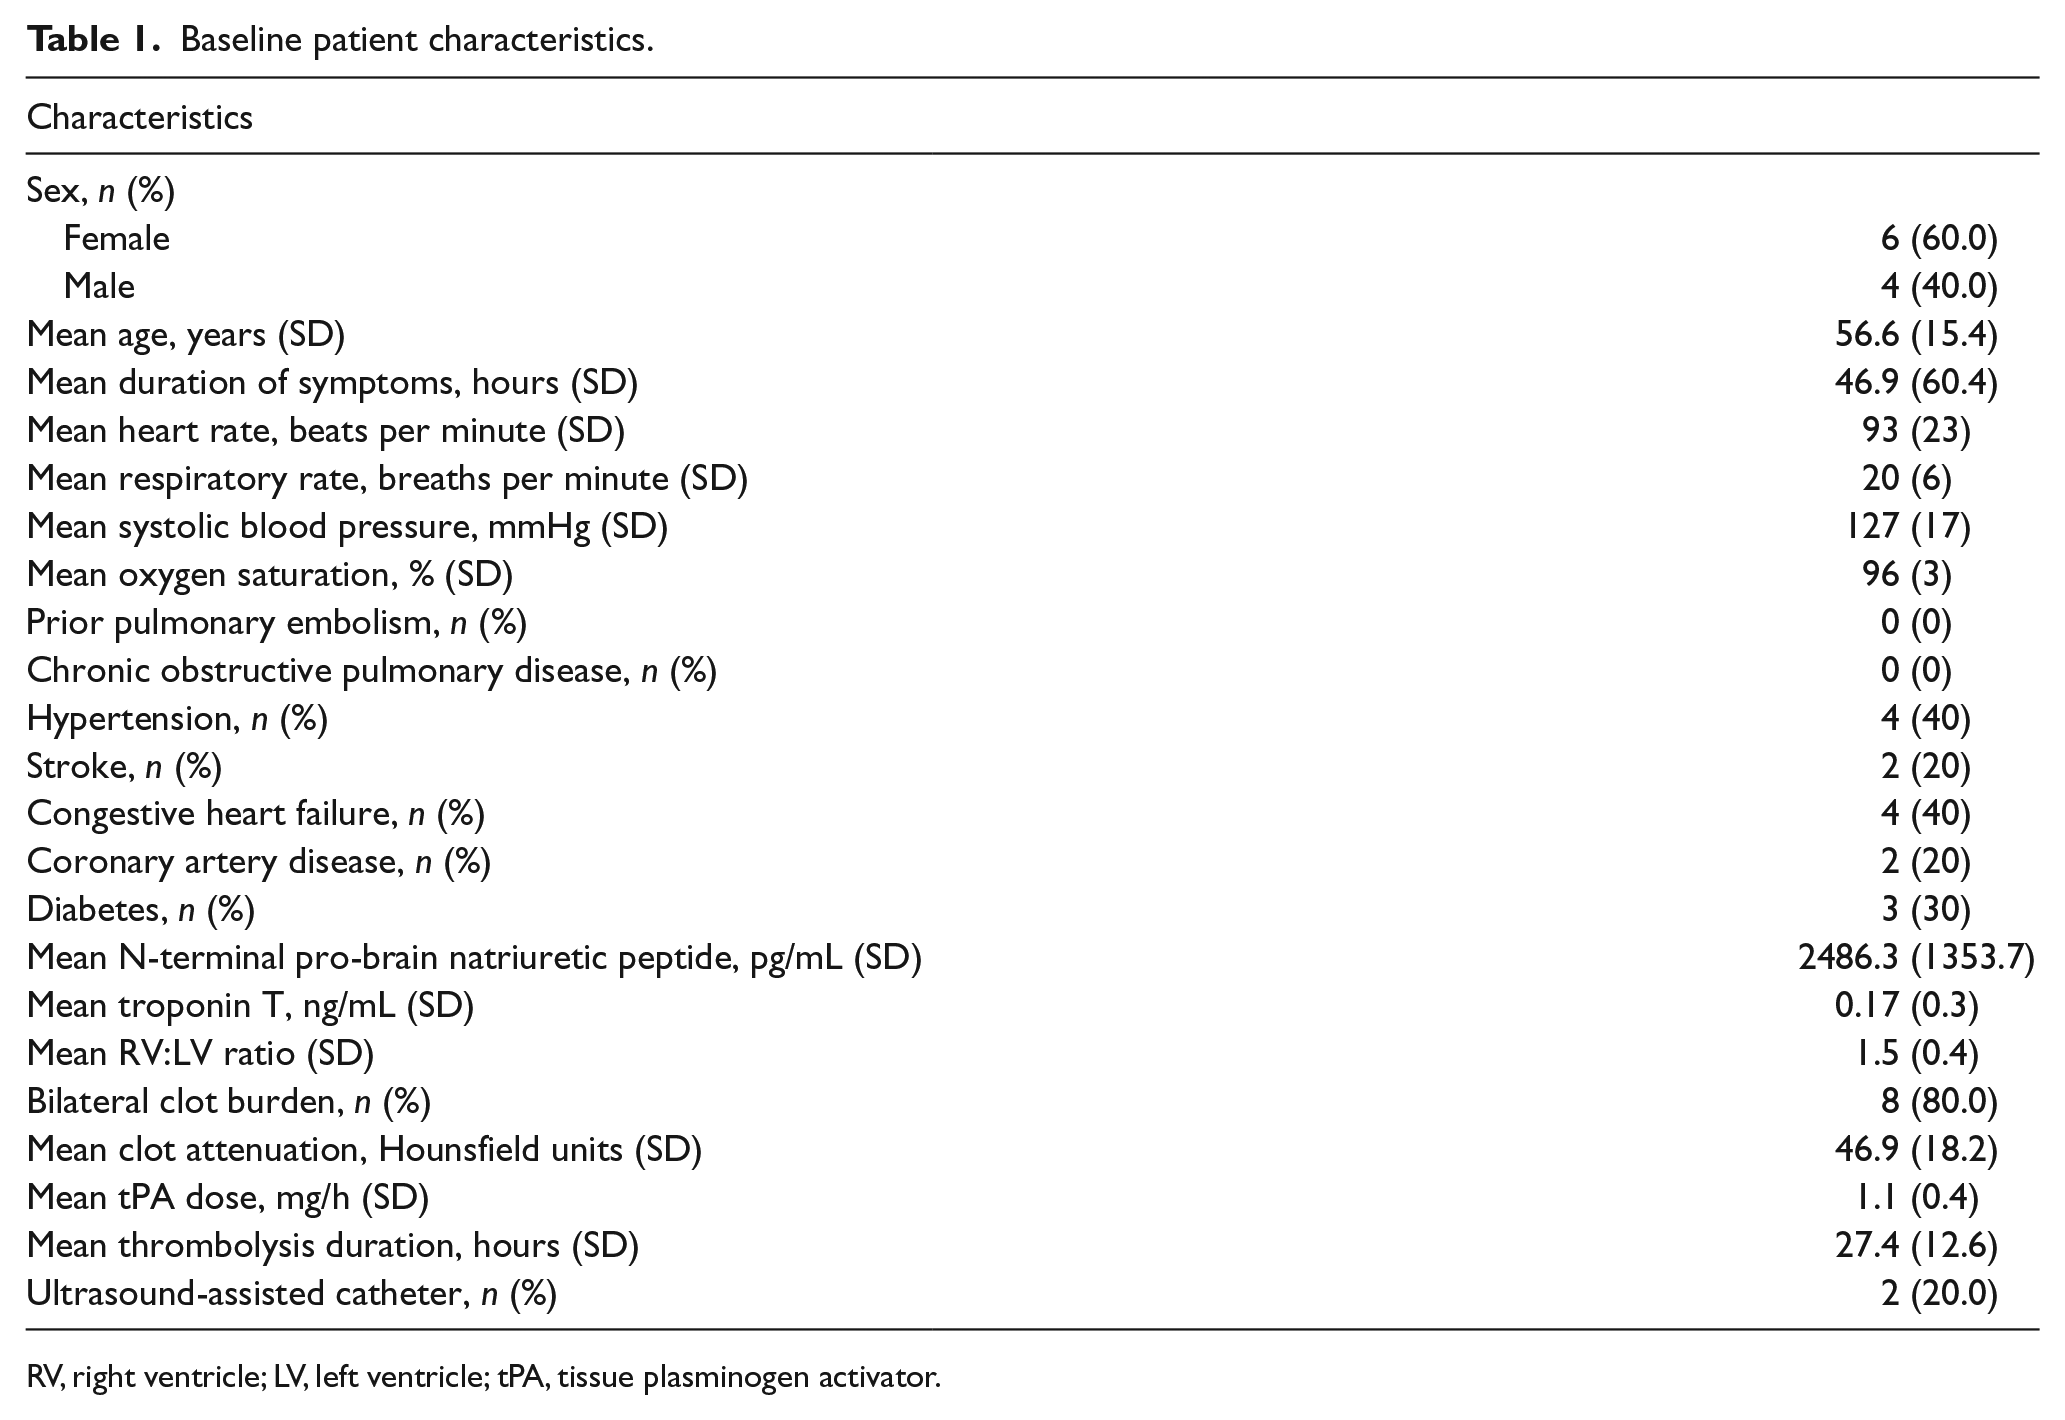
RV, right ventricle; LV, left ventricle; tPA, tissue plasminogen activator.
The duration of intervention and tPA dose were operator dependent. Mean thrombolysis time was 27.4 ± 12.6 hours and the mean tPA dose was 1.1 ± 0.4 mg/h. Mean preintervention pulmonary artery pressure was 34.5 ± 8.0 mmHg, which improved to 27.6 ± 6.1 mmHg after CDT.
Figure 2 demonstrates the relationship between PE attenuation and pulmonary artery pressure change after CDT. There was a significant positive correlation between PE attenuation and absolute pulmonary artery pressure response to CDT, with a Spearman correlation of 0.741, p=0.014. There was also a significant correlation between PE attenuation and percent improvement in pulmonary artery pressure, with a Spearman correlation of 0.736, p=0.015. When attenuation was ⩾ median (44.5 HU, n=5), CDT was associated with a significantly better pulmonary artery pressure improvement (10.2 ± 3.8 vs 3.6 ± 2.1 mmHg; p=0.037).
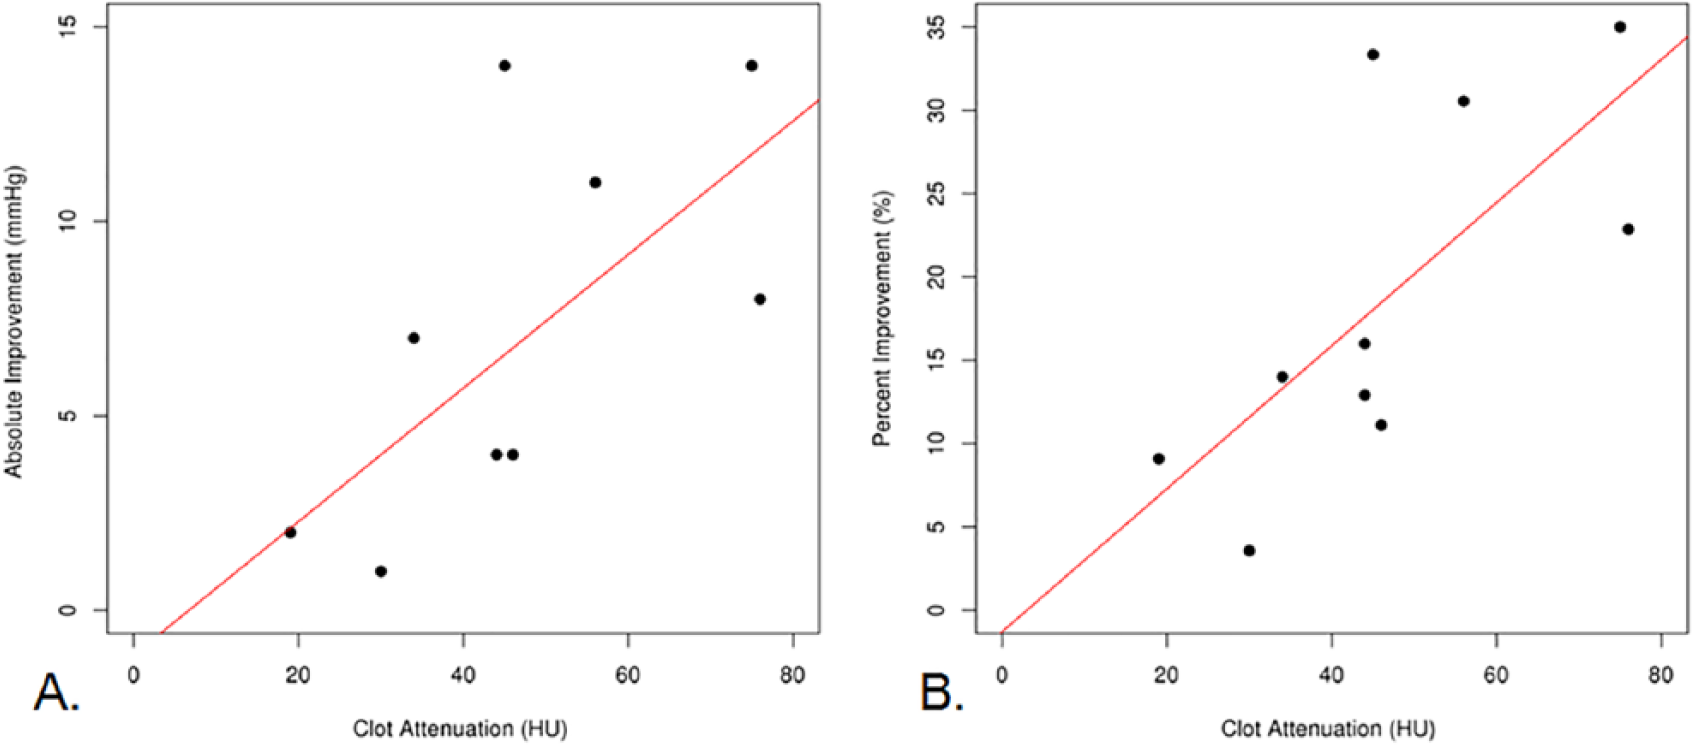
Linear regression analyses demonstrating correlation of pulmonary embolic attenuation with (A) absolute pulmonary artery pressure change (Spearman correlation 0.741, p=0.014) and (B) relative mean pulmonary artery pressure change (Spearman correlation 0.736, p=0.015) after catheter-directed thrombolysis. Two patients had clot attenuation of 44 HU with an absolute improvement pressure improvement of 4 mmHg.
Patient heart rate, respiratory rate, blood pressure and oxygen requirements before and after CDT were reviewed. Following CDT, the mean heart rate changed from 93 ± 23 beats per minute (bpm) to 82 ± 16 bpm, mean respiratory rate changed from 20 ± 6 breaths per minute to 17 ± 4 breaths per minute, and mean systolic blood pressure changed from 127 ± 17 mmHg to 131 ± 14 mmHg. Four patients required supplemental oxygen prior to CDT and the mean oxygen requirement in those patients averaged over 12 hours prior to intervention and 12 hours after intervention decreased from a mean of 4 L to 3 L (p=0.745).
As demonstrated in Table 2, the treatment parameters of thrombolysis duration and tPA dose were not found to correlate with pulmonary artery pressure response (p=0.160 and 0.373, respectively). Furthermore, the RV:LV ratio did not significantly correlate with CDT (p=0.973). No bleeding complications occurred. There was no patient mortality within 30 days of intervention.
Spearman correlation analysis of predictors for absolute pulmonary artery pressure change after catheter-directed thrombolysis.
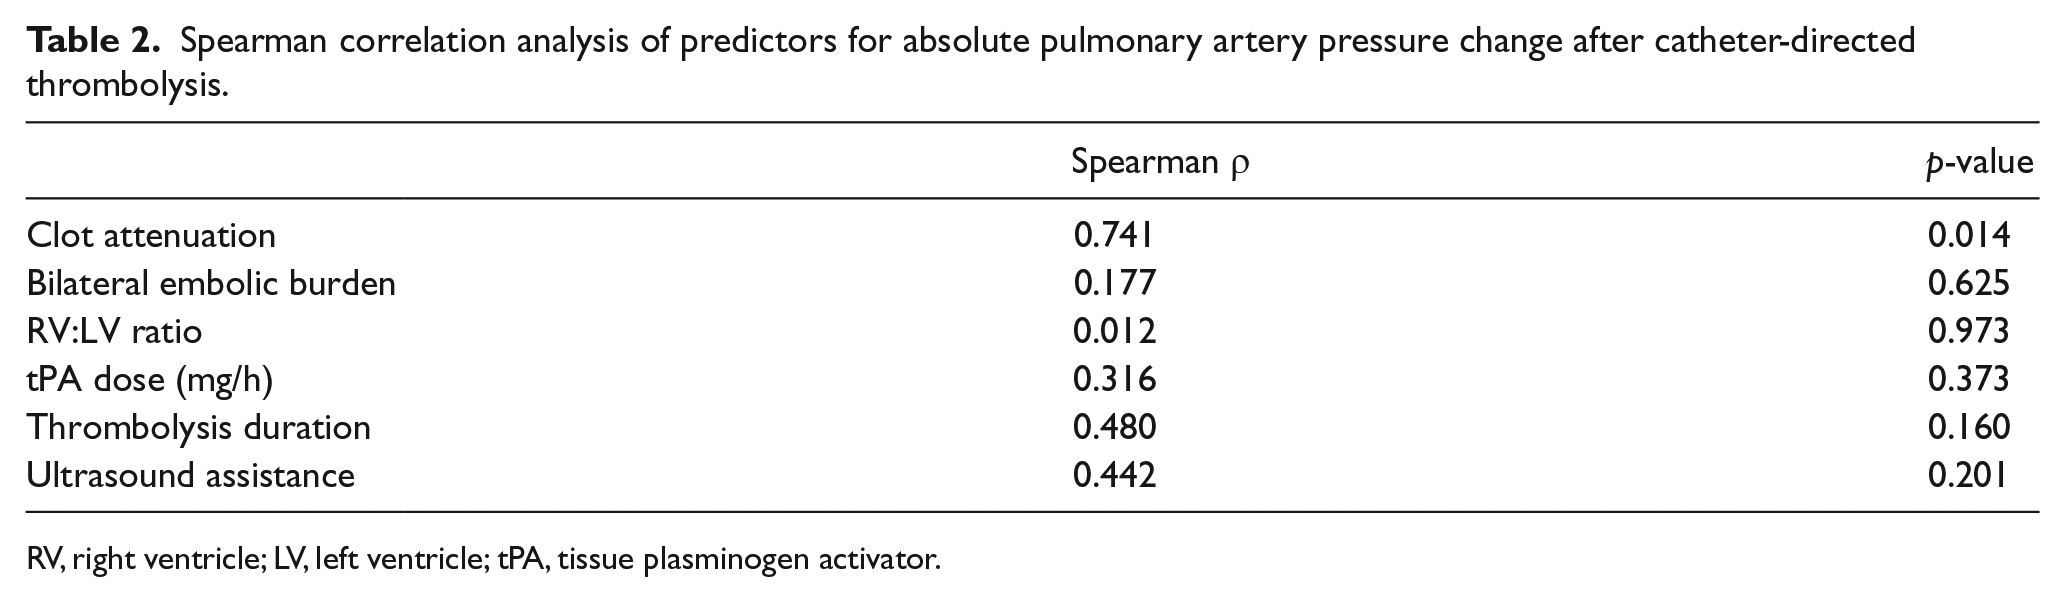
RV, right ventricle; LV, left ventricle; tPA, tissue plasminogen activator.
Discussion
Clot attenuation may be a potential qualitative imaging biomarker for predicting pulmonary artery hemodynamic improvement after CDT. These results were similar to those from the cerebrovascular literature, which report that denser clots have higher recanalization success in the settings of endovascular thrombolysis, mechanical thrombectomy and systemic thrombolysis.3,4 Patients in the present study with clot attenuation below the median 44.5 HU tended to experience less pulmonary artery pressure improvement. This median was similar to previously published data. Puig et al. reported a mean HU of 42.1 ± 4.1 for patients with unsuccessful recanalization versus 49.3 ± 7.1 for patients with successful recanalization of middle cerebral artery distribution occlusion. 2 Moftakhar et al. demonstrated patients with favorable thrombolysis in cerebral infarction (TICI) scores (⩾ 2) after mechanical thrombectomy had a mean HU of 51.0 ± 22.3 compared to 45.0 ± 13.0 among patients with TICI scores < 2. 4
Histologic blood clot analyses have demonstrated an association between clot composition and thrombolysis response. A spectrum of clot compositions exists with varying relative concentrations of red blood cells (RBCs), platelets and fibrin. 11 Since mechanical aspiration was not performed in this study, clot analysis was unavailable. It has been shown that platelet-rich clots respond less favorably to thrombolytic therapy compared to RBC-rich clots. 12 Clots with higher concentrations of RBCs also tend to have higher attenuation on CT compared to platelet-rich clots, which suggests that patients with high attenuation PE may experience more benefit from CDT.4,13 Subacute and chronic thrombus also tend to have lower attenuation compared to acute thrombus.14,15 The age of the PE is difficult to determine since it is unknown for how long the clot developed in the deep venous system prior to embolization. Nevertheless, subacute and chronic thrombi do not respond well to thrombolysis and this may be reflected by the lower CDT efficacy observed in low attenuation PE.
The Pulmonary Embolism Response to Fragmentation, Embolectomy and Catheter Thrombolysis (PERFECT), ULTrasound Accelerated ThrombolysIs of PulMonAry Embolism (ULTIMA), and SEATTLE II studies have demonstrated favorable hemodynamic response to ultrasound-assisted CDT, which, at present, is the only US Food and Drug Administration (FDA)-cleared device for percutaneous CDT for PE.16–18 The majority of patients in the present study were treated with pigtail catheters. However, a study by Graif et al. demonstrated no significant difference in pulmonary artery pressure change between patients who underwent CDT with ultrasound-assisted catheters versus conventional pigtail catheters. 10
Limitations
This study was limited due to its small sample size and retrospective design. As a result, changes in laboratory values, such as brain natriuretic peptide and troponin, and echocardiographic findings were unavailable. Variability in CDT time and tPA dose were potential confounding factors. Clinical follow-up was also limited in duration and by the lack of imaging after CDT. The technique of placing a pigtail catheter into the main pulmonary artery adjacent to, rather than within, the clot may have limited efficacy, as demonstrated in canine models by Schmitz-Rode et al. due to washout of the thrombolytic agent. 19 However, this technique has been shown to have similar efficacy to ultrasound-assisted infusion catheters placed into the clot in human studies. 10 Given the number of patients in this study, larger prospective investigation is needed to validate the findings herein.
Conclusion
Computed tomography offers valuable information beyond the identification of PE and associated RV dysfunction. Clot attenuation at CTPA may be an effective imaging biomarker for predicting pulmonary artery hemodynamic response to CDT. Larger prospective studies with attention to clinical improvement are needed.
Footnotes
Declaration of conflicting interests
The authors declared no potential conflicts of interest with respect to the research, authorship, and/or publication of this article.
Funding
The authors disclosed receipt of the following financial support for the research, authorship, and/or publication of this article: Dr Misra has R01 NIH funding (HL098967 and DK107870). This work was supported by National Institutes of Health grant HL098967 from the National Heart, Lung, and Blood Institute and DK107870, from the National Institue of Diabetes and Digestive and Kidney Diseases.