
Abstract
A diet high in trans-fatty acids (TFAs) is associated with a higher risk of cardiovascular disease (CVD) than a diet high in saturated fatty acids (SFAs), but the mechanisms remain unclear. We hypothesized that a beverage high in TFAs would cause a larger reduction in postprandial endothelial function and an increase in arterial stiffness, in part from greater reductions in insulin sensitivity, compared with a beverage high in SFAs. Eleven healthy adults (aged 47±5 years) ingested a warm test beverage (520 kcal, 56 g total fat, 5 g carbohydrate, 1 g protein) high in either TFAs or SFAs in a randomized cross-over study. Ingestion of the beverage high in TFAs (p<0.01) but not high in SFAs (p=0.49) decreased endothelial function (brachial artery flow-mediated dilation, mmΔ) at 3–4 hours (p<0.01 for time; p=0.034 for interaction), but did not alter aortic stiffness or carotid β-stiffness. The homeostasis model of insulin resistance (interaction p=0.062) tended to decrease after SFAs but not TFAs. A beverage high in TFAs but not SFAs results in a postprandial reduction in endothelial function and a trend for decreased insulin sensitivity, potentially explaining the higher risk of CVD with a diet high in TFAs.
Keywords
Introduction
A diet high in saturated fatty acids (SFAs) and trans-fatty acids (TFAs) is associated with increased atherosclerotic cardiovascular disease (CVD) risk, mediated in part from the development of dyslipidemia, endothelial dysfunction and/or insulin resistance.1–3 However, although SFAs and TFAs have similar physical properties, 4 their independent contribution to CVD risk may differ. Consistent with this, prospective studies suggest that a diet high in TFAs is associated with a higher CVD risk than a diet with a similar percentage of energy intake from SFAs despite both diets resulting in similar increases in low-density lipoprotein (LDL)-cholesterol.5,6 Moreover, in a large cohort of Finnish men, chronic TFA consumption was associated with an increased risk of coronary death in multivariate adjusted models in the absence of any association with intake of SFAs. 7 Thus, a diet high in TFAs appears to contribute to CVD risk independent of consumption of SFAs but the mechanisms remain unclear.
Given that individuals in developed countries spend a large proportion of the day in the postprandial state, mechanisms responsible for postprandial vascular dysfunction may also be critical in understanding the mechanisms by which diet contributes to the development of atherosclerotic CVD. In this regard, consumption of a high-fat, mixed meal (high in both SFAs and TFAs as well as carbohydrates) causes a transient postprandial endothelial dysfunction of the brachial artery within 3–4 hours,8–12 although several studies report no obvious reduction in endothelial function following a high-fat meal.13–15 However, these studies are often confounded by the use of mixed high-fat meals that contain both SFAs and TFAs, as well as variable amounts of carbohydrates, that likely explain these divergent results. Furthermore, data on whether a high-fat, mixed meal alters postprandial large elastic artery (aorta, carotid) stiffness are mixed, with studies reporting increases, decreases or no change in arterial stiffness.9,16–18 Unfortunately, some of these studies were confounded by changes in blood pressure as well as differing in methods for measuring stiffness; thus, it remains unclear whether a single high-fat meal alters postprandial large elastic artery stiffness.
A previous study reported that 4 weeks of a diet high in TFAs resulted in a reduction in endothelial function and high-density lipoprotein (HDL)-cholesterol compared with an isocaloric diet high in SFAs in the absence of differences in LDL-cholesterol or triglycerides. 19 In contrast, another study found that a single isocaloric meal containing ~80 g TFAs or SFAs did not decrease postprandial endothelial function despite a slightly larger increase in circulating triglycerides after the TFAs. 20 However, the meals contained significant carbohydrate and protein content and subjects were also allowed caffeinated coffee or tea, making determination of the effects of fat alone difficult. Furthermore, there are currently no data on the potential selective effects on postprandial arterial stiffness of a meal high in TFAs compared with SFAs.
Therefore, the purpose of the study was to determine the selective effects of a single beverage high in either TFAs or SFAs on postprandial endothelial function and arterial stiffness while limiting the confounding effects of carbohydrate and protein. We hypothesized that consuming a beverage high in TFAs (but low in carbohydrates and SFAs) would cause a larger reduction in endothelial function and increases in arterial stiffness compared with a beverage high in SFAs (and low in carbohydrates and TFAs).
Methods
Experimental design
We utilized a randomized, cross-over design to test our hypotheses. Healthy subjects (n=11) between ages 21–65 years were recruited from the community using mass emails and flyers (Table 1). All study procedures were approved by the University of Iowa Institutional Review Board (IRB), and all subjects read and signed an IRB-approved informed consent document. Exclusion criteria included: known cardiovascular, metabolic and pulmonary disease; smoking within the past year; abnormal findings on screening electrocardiogram (ECG); hormone replacement therapy within the past year. Following an initial screening visit at the University of Iowa Institute for Clinical and Translational Science Clinical Research Unit (CRU), subjects were given a food journal and instruction for recording food intake for the day prior to each experimental visit. Participants fasted for at least 8 hours prior to each study visit, avoided alcohol the day before, and withheld dietary supplements for 2 weeks. They returned to the CRU for baseline blood draw and vascular measurements, and were randomized to consume a warm beverage in 10 minutes consisting of one of two isocaloric high-fat beverages high in either TFAs or SFAs (Supplemental Table 1) after baseline measurements were obtained. Vascular measurements were repeated 3 hours post-ingestion. Blood draws were repeated at 3 and 4 hours post-ingestion. Because the vascular measurements began at 3 hours and required 30–45 minutes to complete. The three visits occurred within ~1 week of each other in men and postmenopausal women, and in the early follicular phase 1 month apart in premenopausal women, and at the same time of day to control for diurnal variation.
Subject characteristics (n=11).
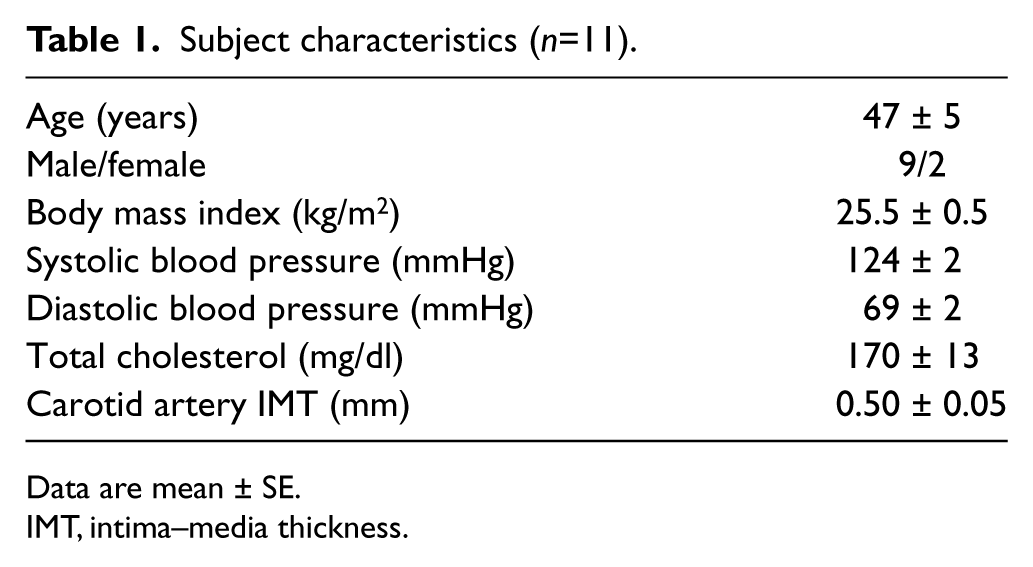
Data are mean ± SE.
IMT, intima–media thickness.
Test beverages
Test beverages were designed to be isocaloric fat loads (520 kcal, 56 g total fat, 5 g carbohydrate, 1 g protein), high in either TFAs (42% total fat – partially hydrogenated soybean oil) or SFAs (88% total fat– coconut oil) (Table 2 and Supplementary Table 2). Fat sources were selected so as to provide the maximal amount of SFAs or TFAs possible from one commonly available fat source per beverage. Both beverages were low in carbohydrate and protein in order to prevent a postprandial increase in circulating glucose and insulin that could potentially confound interpretation of vascular outcomes. The warm beverages consisted of sodium-free chicken bouillon powder, distilled water, soy lecithin, polysorbate 80 (Supplementary Table 1) and either coconut oil (high SFAs) or partially hydrogenated soybean oil (high TFAs, Supplementary Table 2). Fats were obtained in one lot, packaged, and analyzed by the supplier (Archer Daniels Midland Company, Decatur, IL, USA) for fatty acid composition (AOCS Official Method Ce 1h-05). Test beverages were prepared immediately before serving using the following process: the fat source was weighed to the nearest gram into an opaque, thermal beverage container and microwaved until melted. Emulsifiers Lecigran™ 1000P (Cargill, Inc., Decatur, IL) and T-MAZ® 80 (BASF Corporation, Florham Park, NJ) were added to the melted fat and blended with a hand-held mixer for 45 seconds. Sodium-free chicken bouillon powder (Hormel Foods LLC, Austin, MN) that had been rehydrated with 160°F (71.1°C). Distilled water was slowly added to the beverage container, blending continuously with the hand mixer and then blended for an additional 60 seconds. Total beverage volume was approximately 1.25 cups. The beverage container was capped and served to the subject with instructions to consume within 10 minutes. The beverage container was inspected and weighed after serving to verify consumption.
Nutrient composition of test beverages.
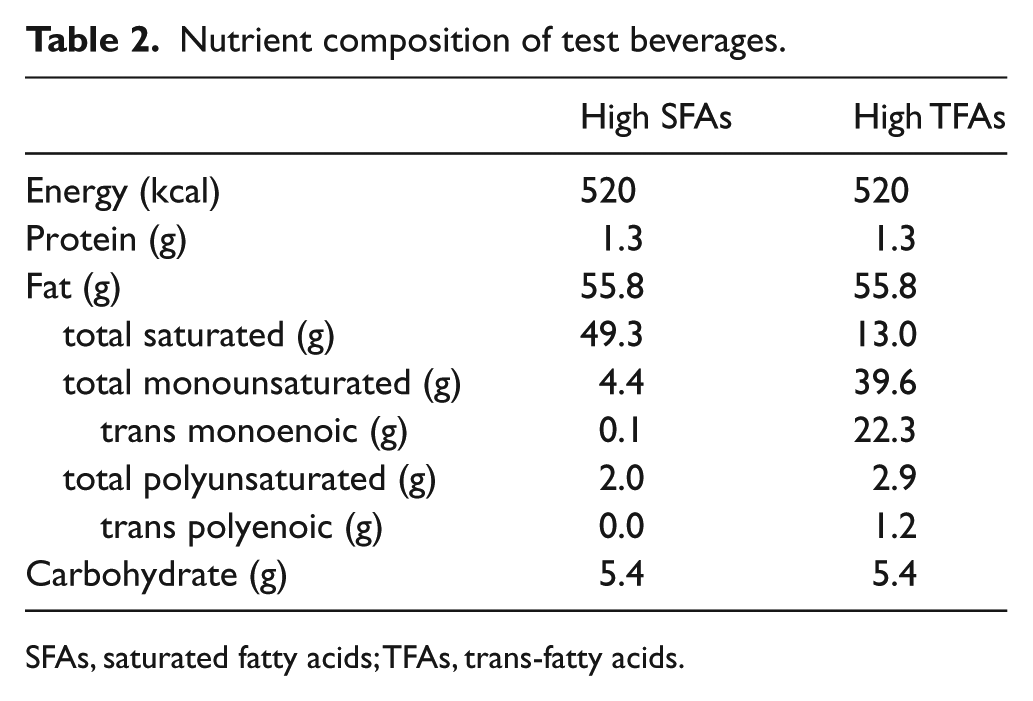
SFAs, saturated fatty acids; TFAs, trans-fatty acids.
Vascular endothelial function
Brachial artery flow-mediated dilation (FMD), an index of macrovascular endothelial function, was determined using a 12 MHz matrix linear transducer and ultrasound (Logiq 7; GE Healthcare, Milwaukee, WI) as previously described by our laboratory. 21 While supine, the subject positioned his/her arm comfortably on a side table at heart level, and a pediatric cuff was placed on the upper forearm. A segment of the brachial artery 2–6 cm proximal to the antecubital crease was selected for imaging and analysis, and the distance from the crease was recorded in order to select the same arterial segment for subsequent visits. Baseline diastolic ultrasound images and Doppler velocity of the artery were acquired in duplex mode (simultaneous B mode and pulsed Doppler). Reactive hyperemia of the brachial artery was produced by inflating a forearm blood pressure cuff distal to the antecubital crease to 250 mmHg for 5 minutes and then rapidly deflating the cuff. ECG-gated end-diastolic ultrasound images and pulsed Doppler of the brachial artery were obtained before and continuously for 2 minutes after cuff release. Diameters were analyzed off-line and peak dilation was determined as the highest diameter post-cuff deflation and expressed as the absolute change (mmΔ) and percentage change (%Δ) from baseline.
Shear rate (SR) was calculated as total hyperemic stimulus (area under the curve: AUC), as previously described, 22 by determining the cumulative sum of the SR from cuff deflation up to the peak diameter using the formula:
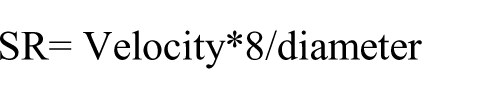
Where velocity = mean velocity, 8 is a constant used for wide Doppler sample volume, and diameter is the diameter of the artery during that 4–5 second bin. Peak SR was calculated using the velocity in the 4 seconds immediately following cuff release using the same formula. 21 FMD normalized to shear rate AUC was also calculated.
Blood pressure and aortic stiffness
After 10 minutes of supine rest, brachial artery blood pressure (BP) was assessed in triplicate using an automated cuff and auscultatory BP was recorded by an investigator using a built-in cuff microphone. Arterial tonometry of the brachial, radial, femoral and carotid artery was performed with a custom transducer and waveforms were signal-averaged and gated to the ECG R-wave (Noninvasive Hemodynamics Workstation; Cardiovascular Engineering, Inc., Norwood, MA, USA) as previously described. 23 Average systolic and diastolic BPs were used to calibrate the peak and trough of the signal-averaged BP waveform, and BP measurements were read by a single investigator. Carotid-femoral artery pulse wave velocity (PWV) and carotid-radial artery PWV were calculated as previously described. 23 Distances from suprasternal notch (SSN) to carotid was subtracted from SSN to respective pulse recording sites to correct for parallel transmission of the pressure pulse in the carotid and aorta. Corrected distances were divided by respective foot-to-foot time delays to calculate carotid-femoral PWV.
Carotid artery β-stiffness
The carotid artery was imaged using a 12 MHz matrix linear transducer inferior to the carotid bifurcation. Moving DICOM images were recorded, and systolic and diastolic diameters of a 0.5-cm portion of the artery were analyzed offline (Vascular Analysis Tools 5.5; Medical Imaging Applications, LLC, Coralville, IA, USA) and calibrated with carotid BP waveforms obtained during applanation tonometry measurements, as previously described. 24 Beta was calculated as: [ln(P1/P0)] / [(D1 − D0)/D0], where P1 = carotid systolic BP, P0 = carotid diastolic BP, D1 = carotid end-systolic diameter, and D0 = carotid end-diastolic diameter. 25 This image was also used to measure the intima-media thickness.
Blood metabolic analyses
Serum glucose, triglycerides, cholesterol, and insulin concentrations were measured by the University of Iowa Diagnostic Hospital Laboratory, Department of Pathology. A commercially available fluorescent assay kit was used to determine free fatty acid (FFA) serum concentrations (Kit# 700310; Cayman Chemical, Inc., Ann Arbor, MI, USA). The homeostatic model of insulin resistance (HOMA-IR) was calculated pre- and post-beverage as (insulin, mU/ml*glucose, mg/dl)/405. 26
Plasma nitrite/nitrate (NOx) analysis
Plasma samples were collected and stored at −80°C and then thawed, filtered, and diluted immediately prior to analysis. Total plasma NOx (nitrite + nitrate) was determined as a readout of nitric oxide (NO) bioavailability with a commercially available colorimetric assay kit (Kit# 780001; Cayman Chemical, Inc., Ann Arbor, MI, USA), performed according to the manufacturer’s instructions. Samples were measured in triplicate, and our coefficient of variation was <5% for these analyses.
Dietary data
Nutrient intake during the 24 hours prior to each study visit was determined from a food record kept by study participants. Participants were given a food scale to weigh foods, and were asked to avoid alcohol, fried foods, pizza, ice cream, chips and other high-fat foods at dinner and during the evening prior to testing. Nutrient intake was calculated using the Nutrition Data System for Research (NDSR) software version 2014 (Nutrition Coordinating Center, University of Minnesota, Minneapolis, MN, USA). Nitrate and nitrite intake were manually calculated using published data27–29 or values estimated from published data using standard procedures. 30
Statistics
Statistical analysis was performed using SPSS 21 (IBM SPSS Statistics, Armonk, NY, USA). Distribution of variables of interest was evaluated using Kolmogorov-Smirnov tests. Non-normally distributed variables were log-transformed before repeated measures analyses. Effect of time*beverage type was evaluated using a repeated measures (2 × 2) ANOVA. Post-hoc least-significant differences (LSD) tests were performed to test for differences between beverages if the interaction was significant, and post-hoc t-tests were performed to determine differences following the beverage within a group. Significance was set at alpha level <0.05.
Results
Subjects
Eleven subjects (M=9/F=2) completed all visits of the study. Subject characteristics are presented in Table 1.
Beverage consumption
Beverages were consumed by participants with no reports of adverse effects or complaints about palatability.
Blood pressure
There was no change in brachial mean arterial pressure (MAP), systolic BP, diastolic BP, or brachial pulse pressure pre- and post-beverage (p > 0.05 for all). There were no significant interactions for these measures between the two beverage conditions (Table 3).
Hemodynamic and metabolic variables at baseline (pre) and 3–4 hours postprandial (post) a beverage high in saturated fatty acids (SFAs) and trans-fatty acids (TFAs).
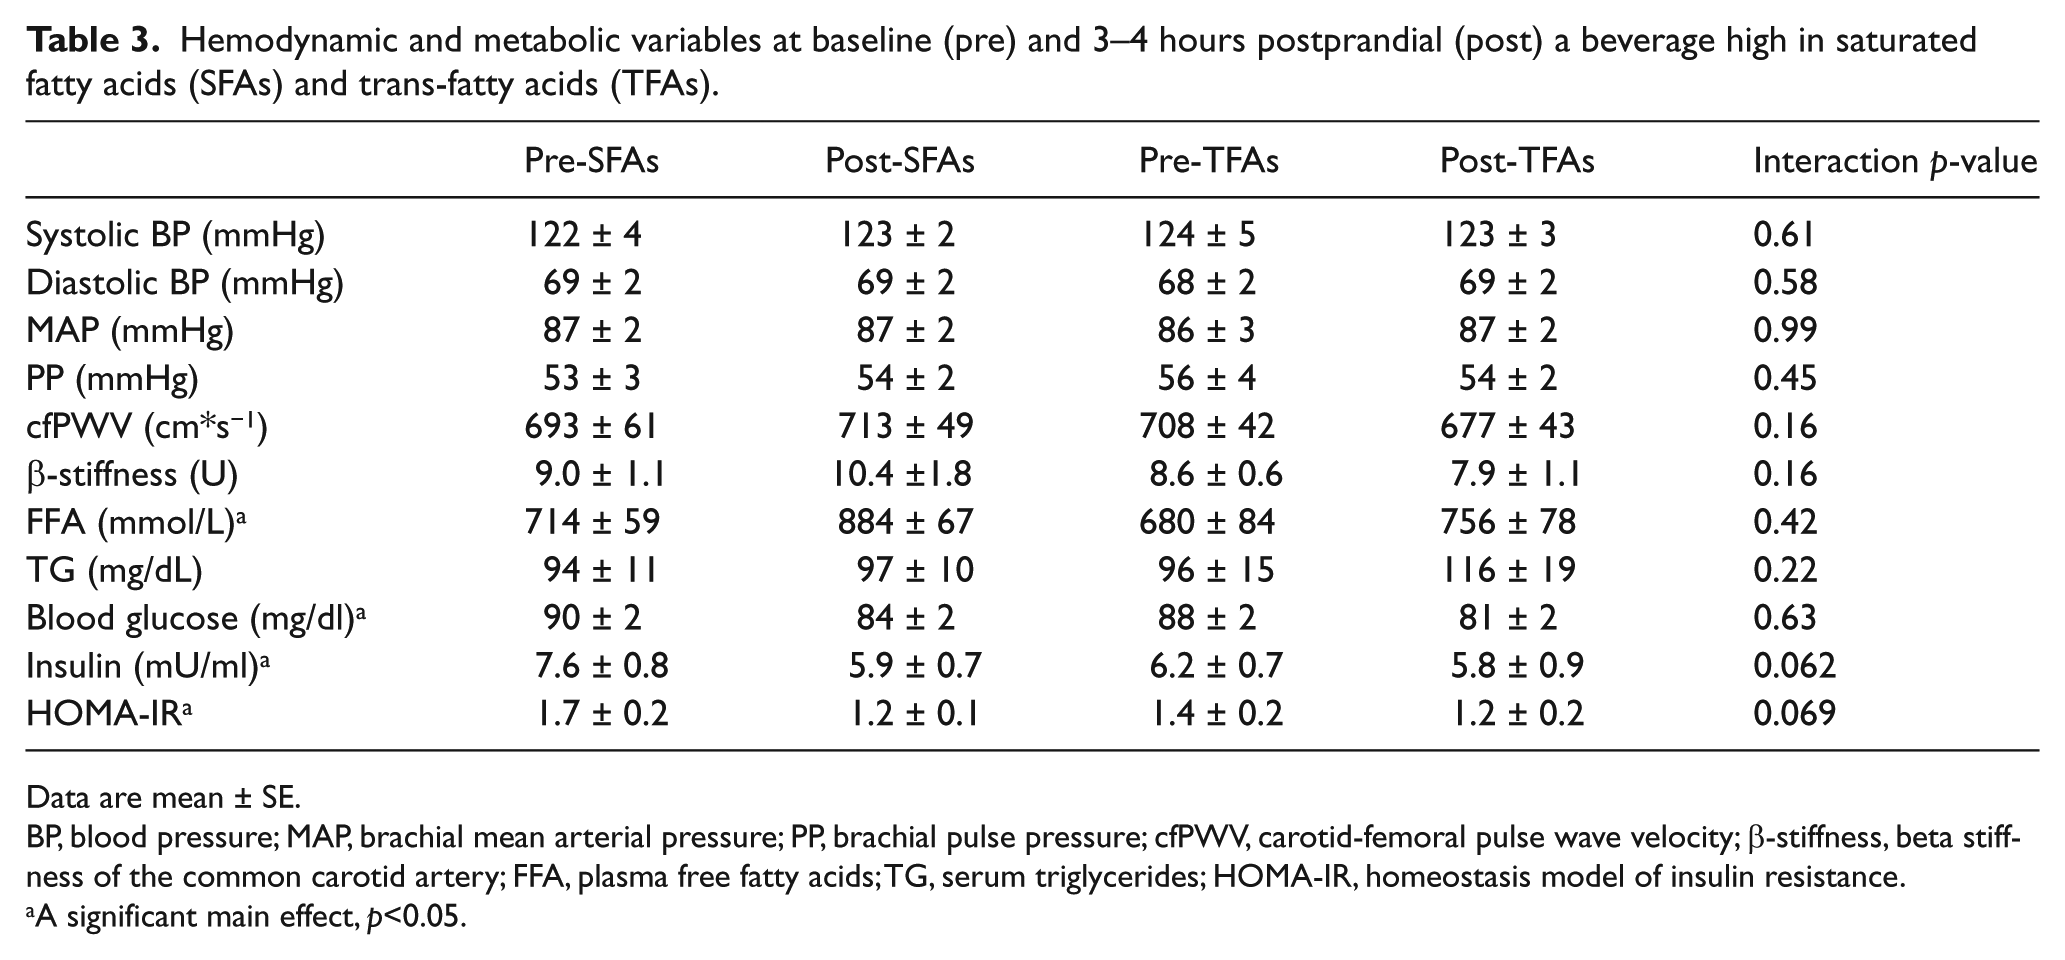
Data are mean ± SE.
BP, blood pressure; MAP, brachial mean arterial pressure; PP, brachial pulse pressure; cfPWV, carotid-femoral pulse wave velocity; β-stiffness, beta stiffness of the common carotid artery; FFA, plasma free fatty acids; TG, serum triglycerides; HOMA-IR, homeostasis model of insulin resistance.
A significant main effect, p<0.05.
Blood metabolic analyses
Postprandial glucose was reduced across groups (p<0.001) without an interaction effect (p=0.63; Table 3). Insulin was reduced in the whole cohort with a significant interaction effect between beverage types (p=0.004 for time and p=0.01 for interaction effects; Figure 2A). There was a strong trend for a reduction in insulin after the SFA beverage, but not after the TFA beverage (p=0.069 for interaction; Figure 2A). There was also a strong trend for a decrease in HOMA-IR after the SFA beverage (p<0.05 for both), but not the TFA beverage (p=0.062 for interaction effect; Figure 2B). Lastly, there was a significant increase in serum FFAs (p=0.03) following the beverages that was not different between beverage types (p=0.418 for interaction; Table 3). Triglycerides were unchanged post-beverage without an interaction effect (p=0.09 for both).
Aortic stiffness and carotid β-stiffness
Carotid-femoral PWV data were obtained in a subset of eight subjects in both beverage conditions. Carotid-femoral PWV was unchanged pre- and post-beverage without interaction effects (p=0.16 for all; Table 3). Carotid artery β-stiffness data were obtained in a subset of seven subjects in both beverage conditions. There was no change in carotid β-stiffness from pre- to post-beverage and no significant interaction effect between beverage types (p=0.64 for main effect of beverage and >0.05 for all; Table 3).
Brachial artery FMD
FMD data were obtained in all subjects in all conditions and are illustrated in Figures 1A and 1B. There was a significant reduction in absolute FMD (mmΔ) post-beverage across conditions (p<0.01 time-effect, with a significant interaction effect between beverage types, p=0.034; Figure 1A). The reduction in absolute FMD was significantly larger (p<0.05) following the high TFA (p<0.01) compared with the SFA beverage (p=0.49). There also was a significant decrease in relative FMD (%Δ) between pre- and post-beverage (p=0.014 for main effect), but the interaction effect did not reach significance (p=0.123 for time*beverage type effect; Figure 1B). Furthermore, there was no difference in baseline diameter or between AUC shear rate up to peak dilation or peak shear rate between conditions before or after the beverage (p>0.30 for all comparisons; Table 4).
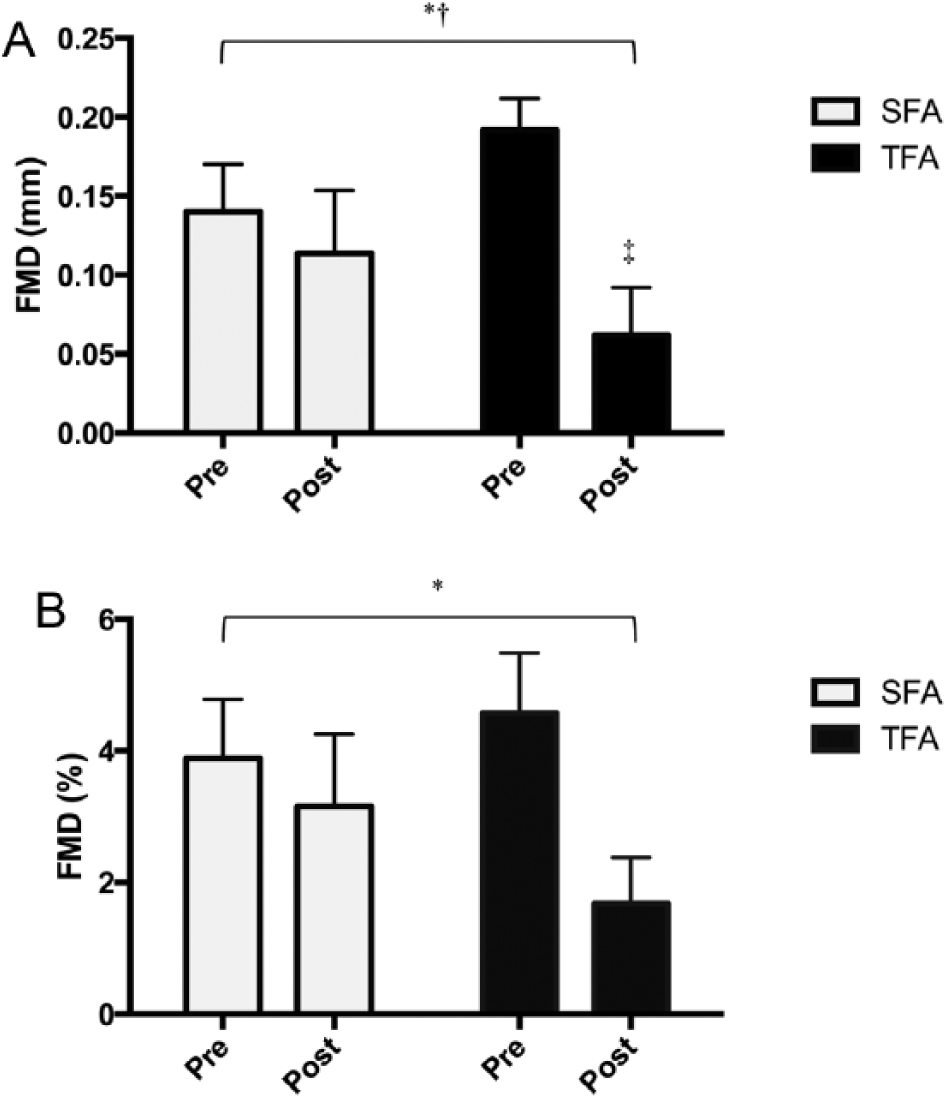
Brachial artery flow-mediated dilation (FMD) response at baseline (pre) and 3 hours after (post) beverage. (A) Absolute brachial artery FMD (mmΔ); (B) relative brachial artery FMD (%). *p<0.05 signifies a significant main effect; †p<0.05 indicates a significant interaction effect; ‡p<0.05 indicates a decrease from baseline within that beverage type. (TFAs, trans-fat beverage; SFAs, saturated fat beverage.)
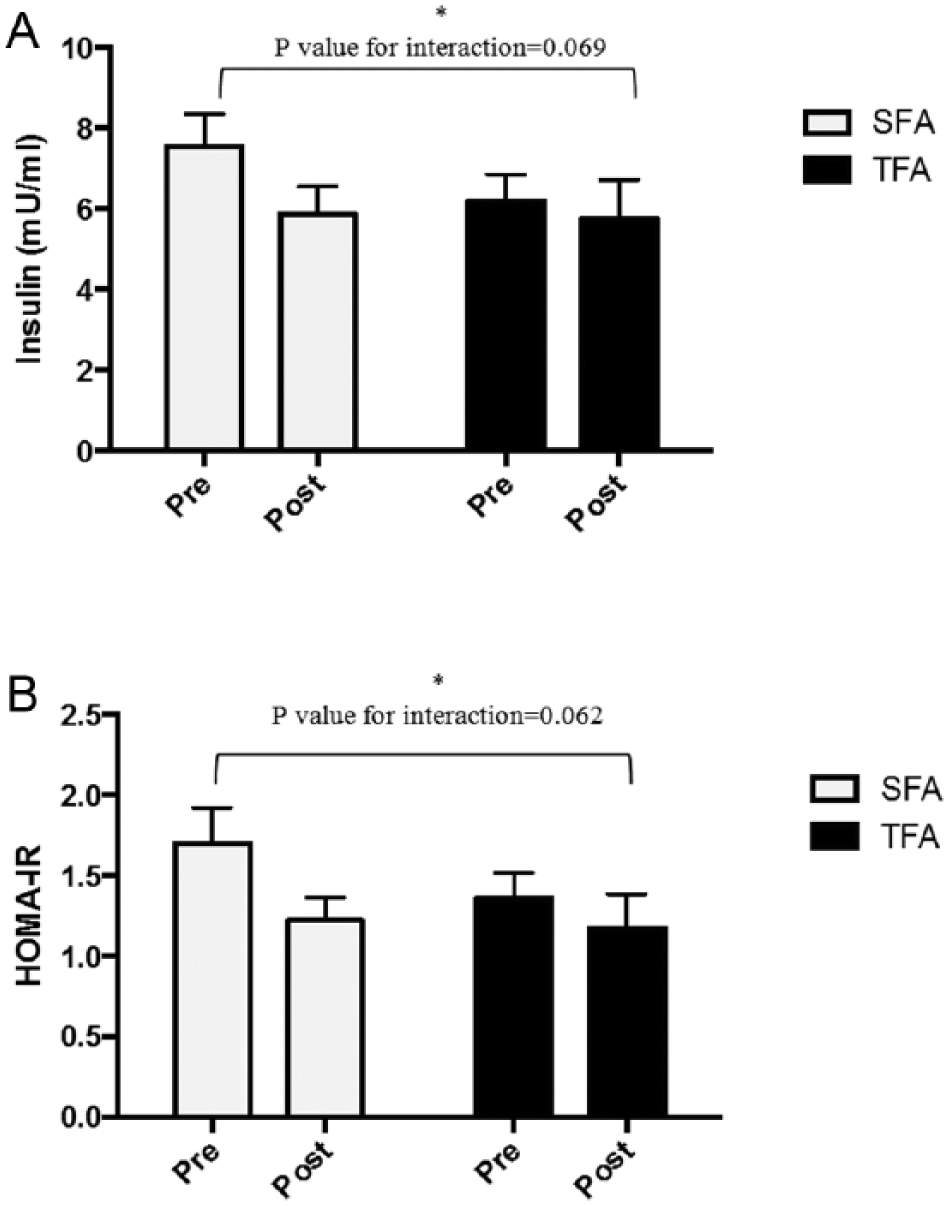
Plasma insulin concentrations and HOMA-IR at baseline (pre) and 3 hours after (post) beverage. (A) Plasma insulin concentrations; (B) HOMA-IR. *p<0.05 signifies a significant main effect. (HOMA-IR, homeostatic model of insulin resistance; TFAs, trans-fat beverage; SFAs, saturated fat beverage.)
Brachial artery and area under the curve shear rate variables.
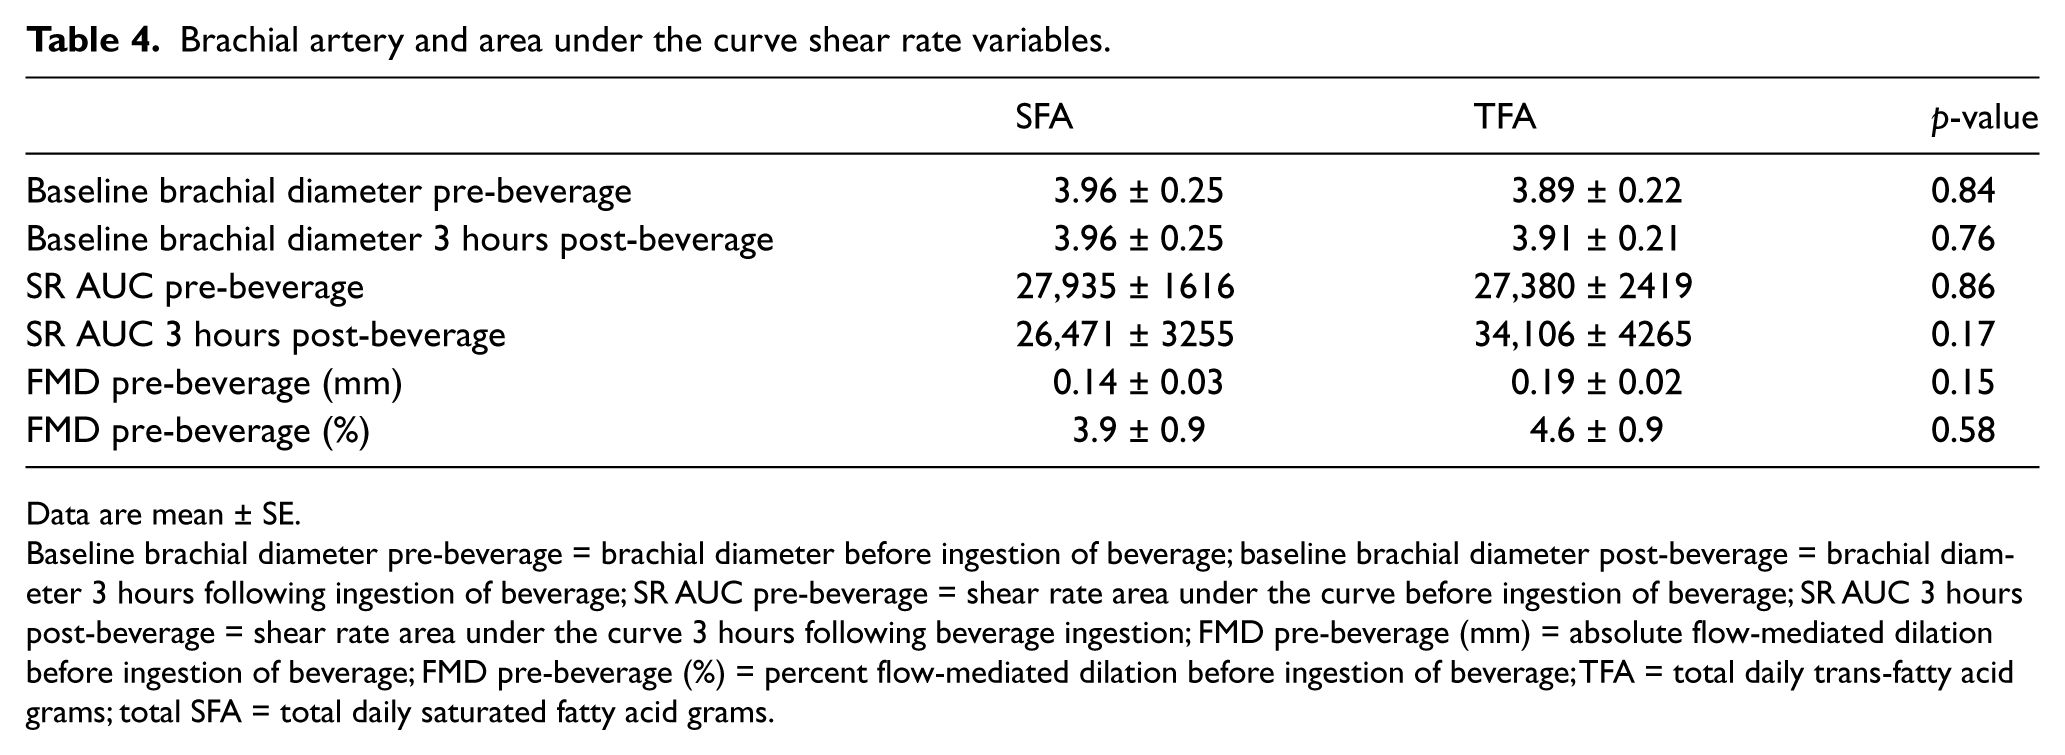
Data are mean ± SE.
Baseline brachial diameter pre-beverage = brachial diameter before ingestion of beverage; baseline brachial diameter post-beverage = brachial diameter 3 hours following ingestion of beverage; SR AUC pre-beverage = shear rate area under the curve before ingestion of beverage; SR AUC 3 hours post-beverage = shear rate area under the curve 3 hours following beverage ingestion; FMD pre-beverage (mm) = absolute flow-mediated dilation before ingestion of beverage; FMD pre-beverage (%) = percent flow-mediated dilation before ingestion of beverage; TFA = total daily trans-fatty acid grams; total SFA = total daily saturated fatty acid grams.
Plasma NOx
Plasma NOx was reduced in the entire cohort post-beverage (p=0.003), with NOx decreasing from 16 ± 5 to 13 ± 5 μM in the TFAs condition and 10 ± 2 to 9 ± 2 μM in the SFAs condition. There was no significant interaction effect (p=0.68) and the change in NOx was not significant between conditions (p=0.53).
24-Hour dietary record
There was no difference in the 24-hour record of total kilocalories, fat, carbohydrate, protein, SFAs, TFAs, nitrate and nitrite intake between conditions (p > 0.40 for all; Table 5). Nitrate and nitrite intake fell within previously reported ranges. 31
Dietary intake 24 hours prior to each experimental visit.
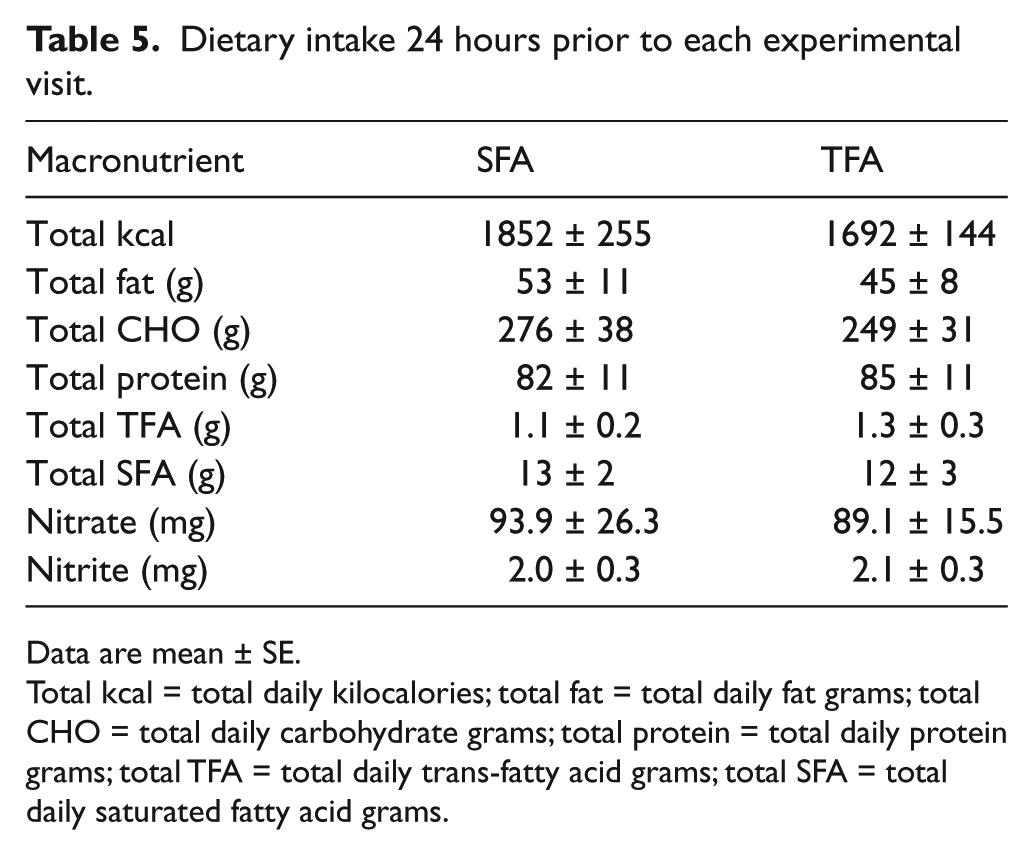
Data are mean ± SE.
Total kcal = total daily kilocalories; total fat = total daily fat grams; total CHO = total daily carbohydrate grams; total protein = total daily protein grams; total TFA = total daily trans-fatty acid grams; total SFA = total daily saturated fatty acid grams.
Discussion
The main finding of our study was that consumption of a single beverage high in TFAs but not SFAs resulted in a reduction in postprandial brachial artery endothelial function within 3–4 hours despite the absence of any group differences in changes in blood pressure or circulating lipids. We also found that insulin concentrations and HOMA-IR remained elevated 3–4 hours following the high TFA beverage despite a time-dependent reduction in glucose. In contrast, postprandial insulin and HOMA-IR tended to be reduced following the high SFA beverage over 3–4 hours, mirroring the expected time-dependent decrease in glucose given the lack of carbohydrate in the beverages. Furthermore, neither beverage – high in TFAs or SFAs – had any effect on postprandial aortic or carotid arterial stiffness. Taken together, these data indicate that the acute effects of a beverage high in TFAs, but not high in SFAs, have an immediate detrimental effect on vascular endothelial function in the absence of any effect on large elastic artery stiffness, perhaps in part from a reduction in insulin sensitivity from a beverage high in TFAs.
Our results are in agreement with a previous study by de Roos et al. (2001) 19 who reported that 4 weeks of an isocaloric high-fat diet that substituted high TFAs for SFAs resulted in a significant reduction in endothelial function and HDL-cholesterol in the absence of any changes in LDL-cholesterol and triglycerides. However, the reductions in HDL-cholesterol in their study did not significantly correlate with changes in endothelial function, and circulating insulin and glucose concentrations were not reported. Therefore, the reduction in endothelial function associated with high TFAs could not be directly attributed to alterations in insulin sensitivity or HDL-cholesterol. Our results differ with another study by de Roos et al. (2002) 20 who reported that a single meal high in either TFAs or SFAs did not significantly decrease postprandial endothelial function. The differences between this study and our data could be explained by the high carbohydrate and protein content in the test meals in their study (in the form of a milkshake and bread with preserves), and subjects were allowed caffeinated coffee or tea, which could have influenced vascular assessments. In contrast, our test beverages were very low in carbohydrates, protein and sodium but high in either SFAs or TFAs, thus allowing us to test the independent influence of SFAs or TFAs on vascular function.
Previous studies have demonstrated that a diet high in TFAs increases serum FFAs, and that high FFAs can lead to hyperinsulinemia.32–34 The reduced FMD and sustained insulin levels following the high-TFA beverage in our study do not appear to be caused by increased serum FFAs, because the increase in FFAs were not different between test beverages. However, the assay for FFAs cannot distinguish between SFAs and TFAs, so it is possible that high circulating TFAs have a direct effect on the vascular wall, but this could not be confirmed in our study. In addition, blood glucose was also uniformly reduced across both beverage conditions, so that the maintenance of baseline insulin levels following the high-TFA beverage was not caused simply by a concomitant maintenance of blood glucose. Consistent with this, fasting insulin concentrations are higher after a 4-week diet high in TFAs compared with monounsaturated fatty acids (MUFAs). 32 In contrast, there was no difference between diets high in TFAs and SFAs in insulin sensitivity after 5 weeks, 33 and another study reported a similar increase in insulin after 6 weeks of a diet high in both TFAs and SFAs compared with MUFAs. 34 Furthermore, increased plasma FFA concentrations following a high-fat meal cause skeletal muscle insulin resistance 35 and impaired insulin clearance. 36 Therefore, in our study it is possible that a high-TFA beverage, without the confounding effect of SFAs and carbohydrates, caused transient insulin resistance in peripheral tissues, requiring maintenance of insulin concentrations in order to lower circulating glucose over the 3–4-hour postprandial period compared with SFAs. Alternatively, the TFAs may have caused a reduction in insulin clearance by the liver or increased insulin secretion by pancreatic β-cells, but additional studies are needed to further test these hypotheses.
The mechanisms for the acute decrease in endothelial function after the high-TFA beverage but not the high-SFA beverage are unknown. Insulin normally causes activation of endothelial NO synthase through a well-characterized PI3K/Akt-mediated phosphorylation signaling cascade. 37 In contrast, insulin can also activate an ERK-1-mediated increase in the endothelin-1 (ET-1) expression in a setting of insulin resistance resulting in enhanced vasoconstrictor tone and endothelial dysfunction. 37 Indeed, experimental forearm hyperinsulinemia results in both elevation of ET-1 vasoconstrictor and NO vasodilator pathways, even in individuals with normal insulin sensitivity and lipid levels, with the NO vasodilator pathway dominating. 38 Thus, we speculated that, in the setting of a beverage high in TFAs, vascular NO production would be reduced. However, we did not find a difference in the effect of the beverage types on plasma NOx, suggesting that NO availability may not be the mechanism by which TFAs caused the reduction in endothelial function in our study. Thus, we speculate that ET-1 vasoconstrictor pathways in the setting of TFA-induced insulin resistance may have promoted the development of endothelial dysfunction, but further studies will be needed to confirm this possibility.
Lastly, postprandial oxidative stress and inflammation have also been reported to be a cause of the transient endothelial dysfunction after a high-fat meal. 39 Indeed, administration of antioxidants (vitamins C and E or omega-3 fatty acids) prevented acute endothelial dysfunction following a high-fat meal,9,40 and TFAs directly increase endothelial cell inflammation by increasing e-selectin, intercellular adhesion molecule 1 (ICAM-1) and vascular cell adhesion molecule 1 (VCAM-1), as well as increasing systemic inflammation.41,42 Therefore, it’s possible that acute TFA ingestion results in enhanced endothelial cell oxidative stress and inflammation contributing to the endothelial dysfunction, but this cannot be determined from the current study.
Limitations
Some limitations of our study should be noted. We have a relatively small sample size, but the randomized, cross-over, repeated-measures design minimizes inter-subject differences. However, a larger sample size may have resulted in significant changes in some of the interactions (e.g. insulin, HOMA-IR) that approached statistical significance. The fats were not pure sources of SFAs and TFAs, and the TFA beverage contained more MUFAs than the SFA beverage. We did not standardize the evening meal (consumed the night before testing), but subjects were asked to consume a low-fat meal the evening before, and the 24-hour dietary record revealed no significant differences in caloric or macronutrient intake among the subjects between visits. We used HOMA-IR as an estimate of insulin sensitivity, so our results should be confirmed using the ‘gold-standard’ hyperinsulinemic-euglycemic clamp. NOx was used as an indirect index of NO bioavailability, but this can be influenced by potential differences in dietary nitrate. Furthermore, we did not measure endothelium-independent dilation to sublingual nitroglycerin, and therefore it is possible that the TFAs altered the vascular smooth muscle function of the brachial artery.
Conclusion
A beverage high in TFAs but low in SFAs and carbohydrates resulted in an acute postprandial reduction in endothelial function in healthy adults. In contrast, neither high-fat beverage had any obvious effect on aortic stiffness measured by carotid-femoral PWV or carotid artery β-stiffness by high-resolution ultrasonography. Furthermore, whereas the high-SFA beverage demonstrated a trend for reductions in insulin concentrations and HOMA-IR 3–4 hours after consumption, insulin concentrations and HOMA-IR were maintained after the high-TFA beverage, suggesting a transient reduction in insulin sensitivity after the high-TFA beverage. These data support the idea that dietary TFAs more than SFAs selectively cause a postprandial endothelial dysfunction and blunt the normal temporal reductions in insulin concentrations associated with falling glucose concentrations in the carbohydrate-fasted state. While a diet high in either TFAs or SFAs is associated with increased CVD risk, our data provide potential insight into the long-term effects of a chronic high-TFA diet on cardiovascular and metabolic health in humans.
Footnotes
Acknowledgements
We thank the Archer Daniels Midland Company for providing, analyzing, and packaging the fats; Kaitlyn Hemesath, BA who assisted with test beverage development; and Greg Peak, BBA who prepared the test beverages.
Declaration of conflicting interests
The authors declared no potential conflicts of interest with respect to the research, authorship, and/or publication of this article.
Funding
The authors disclosed receipt of the following financial support for the research, authorship, and/or publication of this article: supported by National Institutes of Health grants 5T32 HL007638-30, 5T32 HL007121-37 and U54TR001356, and University of Iowa Institute for Clinical and Translational Science award 5KL2 RR24980-5.
References
Supplementary Material
Please find the following supplemental material available below.
For Open Access articles published under a Creative Commons License, all supplemental material carries the same license as the article it is associated with.
For non-Open Access articles published, all supplemental material carries a non-exclusive license, and permission requests for re-use of supplemental material or any part of supplemental material shall be sent directly to the copyright owner as specified in the copyright notice associated with the article.