
Abstract
Purpose
Low values of bioimpedance-derived phase angle (PA) have been associated with various adverse outcomes. We investigated the association of PA with cardiovascular markers in individuals with and without diabetes mellitus (DM).
Methods
PA was measured in 452 adults (without DM n = 153, T1DM n = 67, T2DM n = 232). Carotid intima-media thickness (IMT), renal resistive index (RRI), ankle-brachial index (ABI) and carotid-femoral Pulse Wave Velocity (cfPWV) were estimated. Furthermore, the levels of high-sensitive Troponin-T [hsTnT], N-terminal brain natriuretic peptide [NT-pro-BNP]) were measured.
Results
PA values were lower in DM independently of age, gender, and BMI (estimated marginal means 6.21, 5.83, 5.95 for controls, T1DM, T2DM p < .05), a finding which persisted after propensity score matching. PA correlated negatively with IMT (r = −0.181), RRI (r = −0.374), cfPWV (r = −0.358), hsTnT (r = −0.238) and NT-pro-BNP (r = −0.318) (all p < .001). In multivariable analysis, the associations with RRI, cfPWV, hsTnT and NT-pro-BNP remained unchanged. PA values 6.0–6.5° for males and 5.2–5.8° for females were predictive of commonly used cutoffs. The combination of ΑCC/AHA ASCVD Score with PA outperformed either factor in predicting cfPWV, RRI for males and hsTnT, BNP for both genders.
Conclusions
PA exhibits independent correlations with various parameters pertinent to cardiovascular risk and may be useful for cardiovascular assessment.
Keywords
Key Messages
• Although lower phase angle values have been associated with a variety of adverse outcomes, its utility for cardiovascular risk assessment has not been adequately investigated. • We ascertained significant and independent correlations between lower phase angle and adverse values of a variety of non-invasive markers of cardiovascular status among individuals with and without DM. • Combining the ΑCC/AHA ASCVD risk score with phase angle outperformed either factor alone in distinguishing between the upper and lower quartiles of carotid-femoral pulse wave velocity, renal resistive index, and high-sensitive Troponin-T. • Phase angle may be useful in cardiovascular risk assessment in individuals with and without diabetes mellitus.
Introduction
Cardiovascular disease (CVD) constitutes the leading cause of death worldwide and present a major morbidity and mortality burden, particularly among individuals with diabetes mellitus (DM). 1 Efforts on CVD prevention primarily focus on the early amelioration of modifiable risk factors, particularly in the primary CVD prevention among individuals at high-risk. The identification of high-risk groups is aided by the use of clinical scores such as the American College of Cardiology/American Heart Association Atherosclerotic Cardiovascular Disease (ACC/AHA ASCVD) risk score. 2 Furthermore, a number of non-invasively obtained risk assessment parameters, which have been independently associated with concomitant subclinical or incident CVD may add to the comprehensive assessment of cardiovascular risk. These include the measurement of aortic stiffness estimated by the carotid-femoral pulse wave velocity (cfPWV), 3 the carotid intima‐media thickness (IMT), 4 the ankle-brachial index (ABI) 5 and the renal resistive index (RRI) 6 estimated through doppler ultrasound of arcuate or intralobular renal arteries. Although their relationship with the risk of cardiovascular disease may be not conclusively linear, cutoff values beyond which a high risk is conferred have been proposed and are commonly implemented in clinical research and practice.3,6,7 These modalities, however, are usually not available in the common levels of clinical care, their estimation may be time-consuming, and their performance is often operator-dependent.
Furthermore, circulating cardiac biomarkers, most prominently cardiac troponins and B-type Natriuretic Peptide are commonly used in clinical practice in the diagnosis of myocardial ischemia and heart failure respectively, but also possess a strong prognostic value regarding future heart failure- and CVD-related events, especially among individuals with DM. 8
The phase angle (PA) is included in the parameters obtained through a routine bioelectrical impedance (BIA) analysis. It is derived through the relationship between whole-body reactance and resistance expressed as an angle, and is calculated as its arctangent [(Reactance/Resistance)x180°/p]. It is a surrogate positive measure of body cellularity, indirectly reflecting muscle mass and cell membrane integrity, being also affected by total body water content and its distribution between the intra- and extracellular compartments. Age, gender and the body mass index (BMI) constitute the major clinical determinants of PA. Lower values are noted with advancing age and among females, while an inverse U-shaped relationship exists with BMI, with a positive correlation at lower values which becomes negative in the higher BMI extremes. 9 Regarding the effects of glycemic status on PA, individuals with type 1 and 2 DM exhibit lower PA values compared to glucose tolerant individuals of similar BMI, age and gender distribution.10,11
Lower PA values have been associated with physical frailty, as well as a considerable variety of adverse outcomes, including mortality, in diverse clinical situations. Evidence on the association with cardiovascular outcomes or markers is to date scarce, although the available published literature points towards an inverse relationship between PA and cardiovascular risk,12–14 which could render BIA-derived PA a candidate modality for cardiovascular assessment. The aim of the present study is to investigate the association of PA with markers that are known to correlate with the risk of cardiovascular manifestations (IMT, cfPWV, ABI, RRI) and circulating cardiac biomarkers (high-sensitive cardiac Troponin-T [hsTnT], N-terminal prohormone of brain natriuretic peptide [NT-pro-BNP]), in order to assess the potential utility of PA to identify individuals at high CVD risk.
Subjects, materials and methods
Study sample
This is a cross-sectional analysis of baseline patient data from the Heidelberg Study of Diabetes and its Complications (HEIST-DiC). The study was conducted according to the principles of the Declaration of Helsinki and the study protocol has been approved by the Heidelberg University Hospital’s ethics committee and registered in the https://clinicaltrials.gov database (registration number NCT03022721). Main inclusion and exclusion criteria are presented in Figure 1 and in the supplementary material. Written informed consent was obtained from all participants. All 452 patients (151 without DM, 68 with type 1 DM, 233 with type 2 DM) with available data on bioimpedance-derived PA values at baseline were included in the analysis (Figure 1). Absence of DM was confirmed through glucose values at 0’ and 120’ during a 75-g oral glucose tolerance test and HbA1c<6.5%. Among tested parameters, the number of values available for analysis were as follows: IMT n = 433, ABI n = 439, cfPWV = 432, RRI = 391, BNP = 409, hsTnT n = 371. Study flow chart of the study presenting inclusion and exclusion criteria, excluded patients, and the final number of included patients.
Data collection
Investigations took place during a morning visit in fasting state between 08:00 and 10:00 a.m. Demographics and medical history were collected using standardized questionnaires. Bioelectrical impendence analysis was carried out using a BIACORPUS RX 4004M (MEDICAL Healthcare GmbH, Karlsruhe, Germany) device and PA values were automatically reported during the measurement (CV 0.5%). A detailed overview of the rest study-related procedures and laboratory measurements is included in the supplementary material.
Statistical analysis
The statistical package SPSS version 25.0 was used for the analysis. Normality of continuous variables was assessed using the Kolmogorov-Smirnov test. Categorical variables are presented as absolute number, % and continuous data as mean ± standard deviation or median [25, 75 interquartile range] unless otherwise stated. Categorical variables between groups were compared using the chi-squared test. Regarding continuous variables, depending on the normality of their distribution, the student’s t test or Mann-Whitney U-test were used for comparisons between two groups and one-way analysis of variance or Kruskal-Wallis H-test for comparisons across more than two groups and post-hoc comparisons between group pairs were used. Where needed, the estimated marginal means were calculated using linear models to compare mean values after adjusting for confounders. As a measure of correlation between PA and continuous variables, the Pearson correlation coefficient was calculated. To ascertain the independency of observed associations, three multivariable linear regression (for continuous dependent variables) and binary logistic regression analysis (for dichotomous dependent variables) were used. The first was adjusted for glycemic status, established CVD and factors known to shape PA values (age, gender, BMI). In the second, variables related to cardiovascular risk (DM duration, arterial hypertension, smoking, waist circumference, HbA1c, estimated glomerular filtration rate-eGFR, total/non-HDL-cholesterol) were additionally included. The third model was further adjusted for antidiabetic medications and pharmaceutical agents pertinent to cardiovascular risk modification (statins, angiotensin converting enzyme inhibitors and angiotensin receptor antagonists -ACEi/ARB). Whenever interaction terms were included in multivariable models, the centered mean values of continuous variables were used after subtracting sample means from measured values, so as to avoid multicollinearity. All statistical tests were two-sided and p values <0.05 were considered statistically significant and Bonferroni correction for multiple comparisons was applied.
Results
Group characteristics
Comparative presentation of characteristics of the three studied groups.

§Adjusted for Age, gender, BMI, Smoking, Arterial Hypertension, BMI, Waist circumference, cholesterol, HDL, eGFR-MDRD, Statin and ACEi/ARB use. Values are means ± standard error. *,**,***: for p < .05, .01, 0.001 versus control group; $,$$,$$$: for p < .05, .01, 0.001 versus Type 1 DM. ACEi: Angiotensin Converting Enzyme inhibitor; ABI: Ankle-Brachial Index; ARB: Angiotensin Receptor Blocker; cfPWV: carotid-femoral Pulse Wave Velocity; DPP4i: Dipeptyl-Peptidase-4 inhibitor; GLP1RA: Glucagon-Like Peptide-1 Receptor Agonist; IMT: Intima-Media-Thickness; NT-pro-BNP: N-terminal prohormone of brain natriuretic peptide; PPARγi: Peroxisome Proliferator Activated Receptor Gamma inhibitor; RRI: Renal Resistive Index.
PA values were different across the three groups, chiefly driven by a 5.4% higher value in controls compared to type 2 DM patients (p = .001). Apart from the inherently different HbA1c levels, the three groups differed regarding multiple factors that may have an impact on PA values and cardiovascular risk, such as age, gender, BMI, waist circumference and total cholesterol. Nonetheless, after adjusting for factors that differed across the groups, the reduction of PA values in both DM subgroups compared to controls remained significant (Table 1). This finding was also replicated after propensity score matching for age, gender and BMI between each DM subgroup and controls, with PA values remaining significantly lower among participants with DM of both types (Supplementary table 1).
After dividing the subset of individuals with DM (n = 299 or 66.6%) into quartiles of ascending HbA1c values (mean HbA1c 5.92 ± 0.33%, 6.68 ± 0.21%, 7.50 ± 0.18%, 9.00 ± 1.18%), there were no differences in PA across HbA1c quartiles (p = .150), even after adjusting for age, gender, BMI and DM type (p = .259).
All CV factors except for NT-pro-BNP differed among the subgroups, mainly owing to differences between type 2 DM and the other two groups. ABI was lower in both DM groups compared to the non-DM group (Table 1).
Association between PA and cardiovascular parameters
Univariable and multivariable linear regression between tested cardiovascular indices and Phase Angle.

Model 1: adjusted for Age, Gender, BMI, known CVD, Diabetes status (T1DM, T2DM).
Model 2: Model 1 + Cardiovascular risk factors (arterial hypertension, waist circumference, Diabetes duration, Smoking, Cholesterol and non-HDL-cholesterol, eGFR, HbA1c).
Model 3: Model 2 + diabetes medication + statin + ACEi/ARB.
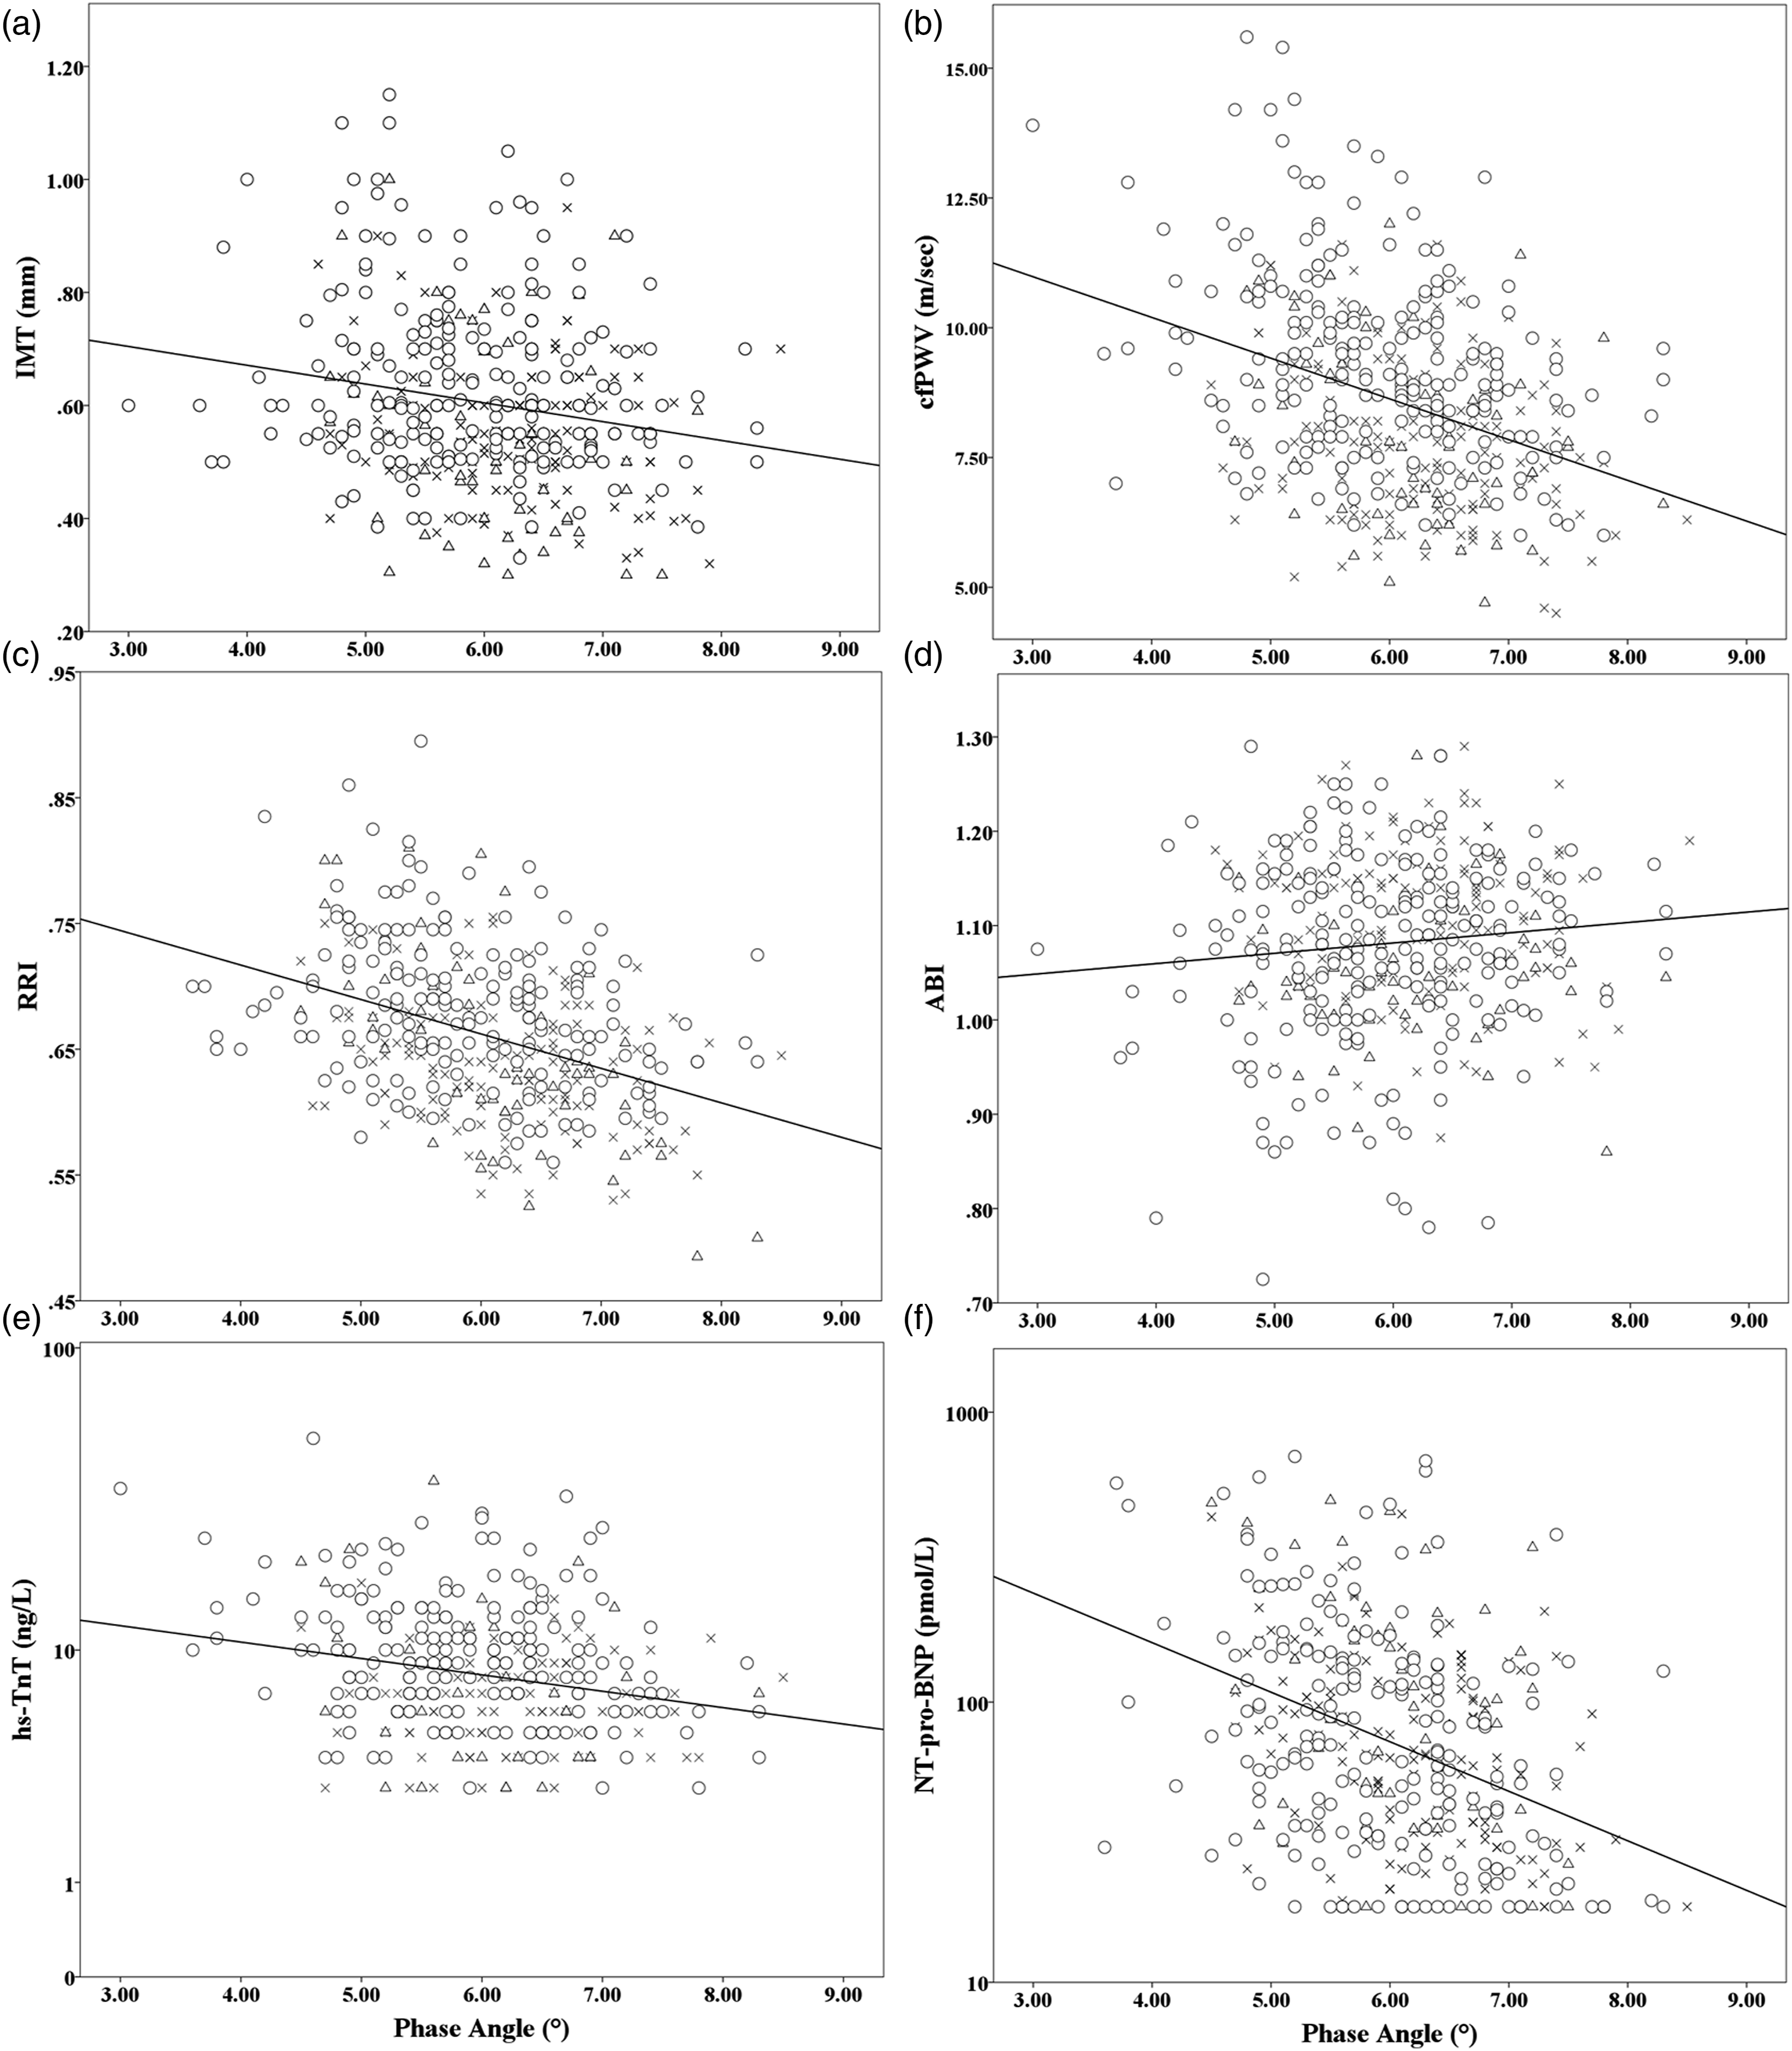
Correlation between Phase Angle and values of (a): Intima-Media thickness (r = −0.181, p < .001), (b):carotid-femoral Pulse Wave Velocity (r = −0.358, p < .001), (c): Renal Resistive Index (r = −0.374, p < .001), (d):Ankle-brachial index (r = 0.102, p = .033), (e):high-sensitive Troponin-T (r = −0.238, p < .001), (f):N-terminal pro-BNP (r = −0.318, p < .001). ✖, △, and ⃝ denote individuals without, type 1 and type 2 DM, respectively.
In multivariable regression, at any adjustment level, the association between PA and IMT values was attenuated in multivariable models. The correlation between ABI and PA was strengthened in the more fitted models although it remained marginally non-significant (p = .055). All other tested parameters remained in general significantly and independently associated with PA.
The effects of PA*Gender, PA*CVD and PA*DM interaction terms were additionally examined. No significant effects of the PA*Gender interaction were noted as regards any tested parameter (data not shown). The PA*CVD term was a predictor of ABI values only in all adjusted models (beta = 0.183, p < .001, beta = 0.198, p = .004 and beta = 0.188, p = .006 for models 1, 2 and 3, respectively. The interaction with DM status was found to have a negative effect on hsTnT only (beta = −0.218, p = .017, beta = −0.176, p = .051 and beta = −0.189, p = .034 for the three models, respectively), which may signify a more pronounced inverse relationship between hsTnT and PA among those with DM.
In a further sensitivity analysis, PA values were found to differ between upper and lower quartiles of cardiovascular factors in univariable analysis (Supplementary table 2). Associations with cfPWV, NT-pro-BNP and hsTnT remained highly significant in all adjusted models, while no effects were noted in the adjusted models regarding IMT. PA was a significant predictor of the odds between the 1st and 4th quartiles of RRI only in the first adjusted model, the association with ABI was more pronounced in the fully adjusted model, without reaching statistical significance (OR 1.54, 95% c.i. 0.94–2.53).
An identical analysis was conducted within the subgroup of participants with type 2 DM and yielded consistent results (Supplementary Tables 3 and 4).
Diagnostic properties of PA with respect to CVD parameters
Areas under the curve of the receiver-operating characteristic (ROC) curves (AUC ROC) according to gender, for the ability of Phase Angle to predict critical values of the tested cardiovascular indices.

J: Youden’s Index (sensitivity + specificity–1).
aThere were only three females with an ABI <0.9 in the study sample.
There were several gender-specific differences noted, with PA showing no significant discrimination ability for IMT <0.9 mm for males, ABI >0.9 and hsTnT <14 ng/L for females as well as ABI >0.9 for both genders. PA performed best in predicting IMT <0.9 mm (AUC ROC 0.780) and BNP <300 ng/L (AUC ROC 0.780) among females and cfPWV <10 m/sec (AUC ROC 0.787) among males. Optimal PA cutoff values based on Youden’s index showed a degree of variation among different parameters, generally ranging between 6.0 and 6.5° for males and 5.2-5.8° for females. CfPWV, RRI, NT-pro-BNP and ABI showed independent additive effects in predicting the PA cutoff of 6.5° for males and 5.8° for females and their combination improved the AUC of the corresponding ROC curve compared to each factor alone (Supp Figure 1).
Relationship with the ΑCC/AHA ASCVD risk score
Τhe sample was stratified in 10-years ΑCC/AHA ASCVD risk categories (<7.5%: low/borderline risk, 7.5%–19.9%: intermediate risk, ≥20%: high risk). There were significant descending trends of PA values across the categories, for both genders (for males 6.90 ± 0.60 vs 6.59 ± 0.75 vs 5.88 ± 0.85 respectively, for females 5.86 ± 0.65 vs 5.80 ± 0.74 vs 5.31 ± 0.76 respectively, p for trend <0.001). The ORs of PA for predicting a low versus high ASCVD risk score were 6.89 (3.53–13.44, p < .001) for males and 3.18 (1.80–5.63, p < .001) for females. The corresponding ROC AUCs were 0.834 (0.772–0.895) and 0.712 (0.616–0.808) respectively, while optimal PA cutoffs were 6.4° (78.0% sensitivity, 75.6% specificity, Youden’s index 0.54) and 5.4° (73.5% sensitivity, 65.1% specificity, Youden’s index 0.39), respectively. In logistic regression models for distinction between upper and lower quartiles of tested CVD factors, the combinations of PA and ASCVD risk score showed independent additive effects in predicting upper-lower quartiles of cfPWV and RRI for males, as well as Troponin and BNP for both genders and improved the AUCs of the respective ROCs compared to PA or ASCVD risk score alone (Suppl Figure 3).
Discussion
The presented results highlight the potential value of bioelectrical impendence-derived PA as a marker of cardiovascular risk. In our sample, PA values showed a strong negative correlation with markers that are associated with an adverse cardiovascular profile, namely higher IMT, cfPWV, RRI, NT-pro-BNP and hsTnT as well as lower ABI values. Apart from IMT, the observed associations remained significant after taking into consideration multiple confounders, including factors that are known to strongly influence PA measurements established CVD as well as cardiovascular risk factors. Our cohort consisted mostly of patients with DM (n = 301 or 66.6% in total) and the observed associations were largely independent of diabetes status, duration as well as antidiabetic therapy. In analysis between lowest-highest quartiles, PA was shown to most strongly associate with cfPWV, hsTnT and NT-pro-BNP. The predictive value of PA assessed by ROC-AUCs was in general moderate to good and varied according to gender, with PA being best predictive of cfPWV, hsTnT and BNP among males and IMT and NT-pro-BNP among females. The differential value of PA on predicting the two assessed NT-pro-BNP cutoffs between genders may be partly attributable to differences in the levels and prognostic value between sexes. 18
The statistically significant interaction between established CVD and PA with respect to ABI values may imply that lower PA is associated with lower ABI values chiefly among those with established CVD. Lower ABI values have been shown to confer a greater risk for CVD events and death also within the subgroup of patients with already clinically apparent CVD. 19 Taken together, these observations could render PA a candidate parameter of value for risk assessment even among those with established CVD. Apart from a negative effect of PA*DM status on hsTnT concentration, no further interaction effects were ascertained, which indicates that the bulk of the observed associations are not principally driven by gender, established CVD and presence of DM.
In line with previous publications,10,11 we observed considerable fluctuations of PA according to glycemic status. Although a comparative evaluation of PA values was not within the scope of the present study, the three studied subgroups differed significantly with respect to a number of key parameters that could partly account for the observed trends of PA (Table 1). Nonetheless, after statistical adjustment for a considerable number of potential confounders as well as analysis following propensity score matching for age, gender and BMI, PA values were found to be significantly lower in the DM subgroups than controls and similar between DM types (Table 1, suppl Table 1). The fact that PA was comparable across ascending HbA1c quartiles among those with DM, could imply that other DM-associated factors rather than hyperglycemia exert a significant impact on the physiological components that contribute to shape PA. The increased oxidative stress and chronic low-grade inflammation which are frequently encountered in DM could be speculated to drive this observation through their detrimental effects on cell membranes and muscle mass.20,21 Both oxidative stress and low-grade inflammation have been previously shown to relate to lower PA values. 22
There is to date scarce data on the relationship between PA values and CVD risk or incident CVD. Two studies have cross-sectionally investigated the association of PA values with cardiovascular scores; An Saad et al demonstrated a marginally significant negative correlation of PA with the global cardiovascular risk score among individuals aged >60 years for both genders. 14 Likewise, Portugal et al. ascertained higher PA measurements among individuals classified as low risk than those at elevated risk via either the Framingham General Cardiovascular or ACC/AHA ASCVD risk scores. 13 Furthermore, in a cohort of 2601 individuals followed up over 24 years, Langer et al. ascertained lower baseline PA values among women with incident CVD than those without. The risk was most pronounced among those in the 5th PA percentile (HR vs 50th percentile 1.33). No predictive value was found among men. 12 There was evidence of a threshold PA of <6.6° for both genders, which is considerably higher than the values observed to predict adverse CVD parameters within the subset of females in our study, but remarkably similar to that among males.
Similar to the observations by An Saad et al. and Langer et al., a positive relationship between PA and ASCVD risk score for both genders was also noted in the present study. Furthermore, we ascertained independent additive effects between PA and ASCVD risk score in discriminating between the upper and lower quartiles of cfPWV, RRI for males and hsTnT, NT-pro-BNP for both genders; it may hence be hypothesized, that PA may allow for a more precise estimation of CVD risk when used in combination with the ASCVD risk score. Another novel aspect of the presented results lies in both the use of multiple different indices representing different aspects of cardiovascular disease and the extensive statistical modelling used, accounting for a variety of relevant factors which may confound the observed relationships. Although the studied markers exhibit validated associations with cardiovascular risk assessed cross-sectionally or longitudinally, a considerable variety of different physiological forces contribute to shape their respective values. Accordingly, a number of different mechanisms can be speculated to drive the observed associations between PA and cardiovascular factors. This is further supported by the slight variation of PA cutoffs that optimally predict critical values of the tested factors (Table 3). PA may be viewed as a surrogate of cellular membrane status, 9 and this may explain its association with hsTnT concentrations, which may rise as a result of impaired myocardial cell membrane integrity. 23 Changes in membrane status may also in part mediate the connection between PA and aortic stiffness as indexed by cfPWV, since the latter is influenced by vascular smooth cell stiffness which may in turn relate to membrane-affine cytoskeletal components, as has been demonstrated in rat models. 24 Alternatively, a reduction in skeletal muscle mass can be proposed to link lower PA values with increasing cfPWV. 25 The total body water status as well as extracellular-to-intracellular volume ratio are determinants of both PA 9 and BNP 26 values and could constitute a direct link for the strong inverse correlation between PA and NT-pro-BNP that was demonstrated in our study. Likewise, the association between PA and RRI may reflect increased systemic vascular resistance in the frame of decreased effective intravascular and expanded extracellular volume. 27 An alternative interpretation could implicate the relationship between impaired microcirculation and sarcopenia as another link between PA and RRI. 28 Lower extremity peripheral arterial disease which reflects upon lower ABI values is associated with loss muscle mass loss and sarcopenia, 29 which could expectedly lead to lower PA values. Overall, it is likely that a fraction of the relationship between PA and the tested cardiovascular surrogates may be mediated by the nutritional status reflected upon muscle mass and sarcopenia, although the precise contribution of these factors on the observed associations cannot be accurately estimated.
A correlation between PA and IMT was noted solely in univariable analysis and was abolished in multivariable models. This implies that the association between PA and IMT may be mediated by clinical and demographic factors such as age, gender, BMI and glycemic status, which is in line with previous observations acknowledging these parameters as decisive determinants of IMT. 30
Overall, the observed associations between PA and a variety of indices implicated in CVD risk, as well as the multifaceted pathophysiological background which may drive these observations, underpin the potential utility of PA as a tool in the assessment of cardiovascular status. It could be hence proposed that, together with established risk factors, PA could be a useful tool in identifying individuals at high CVD risk. Accordingly, PA could bear the potential of constituting a cheap, non-invasive, reproducible, readily available, and examiner-independent adjunctive CVD risk-modifying factor. The strong and independent inverse association of PA with NT-pro-BNP in our study adds to the existing observations of descending PA in heart failure of increasing clinical stages, and in unstable or decompensated patients; furthermore, PA tends to normalize after successful decongestive treatment. Furthermore, existing evidence, though scarce, has linked lower PA values with increased mortality in this population. The observed differences in PA values across these conditions are substantially greater than measurement variations due to technical issues. 31 This indicates that, in combination with other biomarkers, PA may be useful in the evaluation of congestion status among patients with heart failure. Issues that require further clarification towards this notion include gender-driven differences of PA in mediating CVD risk, standardization between different devices, and the accumulation of prospective data regarding hard cardiovascular endpoints from larger cohorts.
The present study has certain limitations. The utilization of surrogate markers as indicators of cardiovascular status may render our results rather further hypothesis-generating than directly applicable in clinical practice. Besides the robust and independent correlations between PA and NT-pro-BNP, we lacked data on ultrasound estimations of left ventricular ejection fraction and corresponding stratification of heart failure subtypes, in order to further corroborate our findings. Doppler-based RRI and IMT evaluations inherently exhibit a degree of rater bias; nonetheless, measurements were made by experienced examiners following identical standard operating procedures conforming to international standards, with satisfactory intra- and inter-rater reliability (see also the supplementary material).
In conclusion, PA may be a useful parameter for CV risk assessment among individuals with and without DM and future studies, preferably of a prospective nature should aim to solidify this presumed relationship and concretely establish corresponding cut-offs for use in clinical practice. Furthermore, being a global marker of adverse outcomes, a further investigation into the relevance of the lower PA values among DM patients may be warranted beyond the strict frame of diabetes-associated complications.
Supplemental Material
Supplemental Material - Utility of bioelectrical phase angle for cardiovascular risk assessment among individuals with and without diabetes mellitus
Supplemental Material for Utility of bioelectrical phase angle for cardiovascular risk assessment among individuals with and without diabetes mellitus by Dimitrios Tsilingiris, Lukas Schimpfle, Ζoltan Κender, Alba Sulaj, Ekaterina von Rauchhaupt, Stephan Herzig, Julia Szendroedi, and Stefan Kopf in Diabetes & Vascular Disease Research
Footnotes
Declaration of conflicting interests
The author(s) declared no potential conflicts of interest with respect to the research, authorship, and/or publication of this article.
Funding
The author(s) disclosed receipt of the following financial support for the research, authorship, and/or publication of this article: This research received funding from the German research foundation (SFB 1118).
Supplemental Material
Supplemental material for this article is available online.
References
Supplementary Material
Please find the following supplemental material available below.
For Open Access articles published under a Creative Commons License, all supplemental material carries the same license as the article it is associated with.
For non-Open Access articles published, all supplemental material carries a non-exclusive license, and permission requests for re-use of supplemental material or any part of supplemental material shall be sent directly to the copyright owner as specified in the copyright notice associated with the article.