
Abstract
Background:
In phase 3 trials, ozanimod reduced brain atrophy and improved cognitive processing speed compared with interferon β-1a (IFN) in participants with relapsing multiple sclerosis (RMS).
Objectives:
To assess long-term brain volume changes and associations with clinical/cognitive outcomes during an open-label extension ([OLE] DAYBREAK [NCT02576717]).
Methods:
Completers of phase 3 “parent” trials were eligible to receive ozanimod 0.92 mg in DAYBREAK. Whole brain, thalamic, and cortical gray matter volumes (WBV, TV, and CGMV, respectively) were analyzed annually.
Results:
Participants receiving continuous ozanimod had sustained, low rates of WBV loss through OLE month (M)60 (annualized least-squares mean percent change from parent baseline: RADIANCE, −0.27; SUNBEAM, −0.35). Compared with participants switched from IFN, these participants had lower reductions in WBV (parent baseline through OLE M48 [RADIANCE] and OLE M60 [SUNBEAM]). Larger baseline brain volumes were associated with numerically better Symbol Digit Modalities Test scores and lower 3-month confirmed disability progression (CDP) incidence. Annualized TV atrophy ⩽1.0% was associated with lower 3-month CDP.
Conclusion:
This study confirms the sustained efficacy of ozanimod in reducing brain atrophy rates for up to 7 years. Brain volume preservation was associated with faster cognitive processing speed and slower physical disability progression.
Keywords
Introduction
Multiple sclerosis (MS) is a chronic inflammatory and neurodegenerative disorder characterized by demyelinating lesions in the brain that lead to physical and cognitive disability.1–3 A low rate of brain atrophy occurs with normal aging in healthy individuals (typically 0.1%–0.3% per year); 4 brain atrophy occurs at a faster rate in untreated people with multiple sclerosis (PwMS) (0.5%–1.35% per year).5,6 Importantly, this accelerated brain atrophy begins early in the course of the disease, often before diagnosis.6,7 Brain atrophy shows similar rates in people with relapsing MS and in those with disability progression independent of relapse activity. 8 A cutoff of 0.4% for the annualized rate of whole brain atrophy is used to identify PwMS with abnormally high levels of brain atrophy.5,9 This cutoff was used in the definition of the composite outcome “no evidence of disease activity.” 10
Deep gray matter volume (DGMV), which includes the thalamus, putamen, globus pallidus, caudate, and amygdala, declines faster than cortical gray matter volume (CGMV) in relapsing multiple sclerosis (RMS). 11 The thalamus in particular shows the fastest decline in volume.8,12 Although DGMV and CGMV atrophy are both associated with greater disability (as assessed by Expanded Disability Status Scale [EDSS]), 11 only DGMV atrophy was shown to predict disability progression. 13 Specifically, the risk of disability progression over 5 years increased by 2.4-fold for each unit decrease in baseline thalamic volume (TV). 13 A prospective longitudinal study (average follow-up of 5 years) similarly reported that declines in TV significantly correlated with worsening disability as measured by the EDSS, Timed 25-Foot Walk, and 9-Hole Peg Test. 14 However, a cutoff value for the annualized rate of thalamic atrophy associated with greater disability progression in MS has not been identified.
Impaired cognitive processing speed, as assessed by the Symbol Digit Modalities Test (SDMT), is the earliest cognitive deficit that develops in MS.15,16 Cognitive impairment is associated with reduced performance of normal, daily activities, and thus can greatly impact quality of life in PwMS. 17 PwMS with cognitive impairment have an increased risk of developing secondary progressive MS, and have increased mortality rates, compared with those who do not have cognitive impairment. 18 Lower SDMT scores at the time of RMS diagnosis are associated with a greater likelihood of worsening disability in a 10-year longitudinal study. 19 Brain atrophy, especially thalamic atrophy, is associated with declining cognitive performance in people with RMS. 20 When controlling for age, thalamic atrophy predicts SDMT decline in PwMS. 21
Ozanimod, a sphingosine 1-phosphate 1 and 5 receptor modulator, is approved in multiple countries for the treatment of adults with either RMS or moderately to severely active ulcerative colitis.22,23 In pivotal phase 3 trials (SUNBEAM and RADIANCE), ozanimod reduced whole brain volume (WBV) loss and improved cognitive processing speed (SUNBEAM; as assessed with the SDMT) compared with interferon β-1a (IFN).24,25 This article reports changes in WBV, CGMV, and TV over 5 years in SUNBEAM and RADIANCE participants who enrolled in the open-label extension trial (OLE) DAYBREAK. Associations between baseline volumes or atrophy rates and disability progression or worsening of cognitive performance over time are reported.
Methods
Study design
RADIANCE 24 (ClinicalTrials.gov, NCT02047734; EudraCT, 2012-002714-40) and SUNBEAM 25 (ClinicalTrials.gov, NCT02294058; EudraCT, 2014-002320-27) were multicenter, randomized, double-blind, double-dummy, active-controlled, parallel-group phase 3 trials of participants with RMS treated with once-daily oral ozanimod 0.92 mg or 0.46 mg, or once-weekly intramuscular IFN β-1a 30 µg. In RADIANCE, participants were treated over 24 months, and in SUNBEAM, participants were treated for at least 12 months (until the last participant had been treated for 12 months). DAYBREAK 26 (ClinicalTrials.gov ID: NCT02576717; EudraCT: 2015-002500-91) was a phase 3 OLE trial in which participants who had completed a previous phase 1, 2, or 3 ozanimod “parent” trial could enroll and receive ozanimod 0.92 mg. Only participants from the phase 3 RADIANCE and SUNBEAM trials who entered DAYBREAK were included in this analysis, and data from 5 years of follow-up in the OLE are reported. All study protocols were approved by the institutional review board or ethics committee at each site. Protocols conformed to Good Clinical Practice Guidelines and the principles of the Declaration of Helsinki. All participants provided written informed consent and reconsented on entry to the DAYBREAK extension.
Participants
Participants in RADIANCE and SUNBEAM were aged 18-55 years, had brain magnetic resonance imaging (MRI) lesions consistent with MS, and an EDSS score of 0-5.0. Participants had a relapsing course of MS; participants with primary progressive MS at screening were excluded.
Procedures
Treatments
In RADIANCE and SUNBEAM, ozanimod and oral placebo treatments began with an initial 7-day dose escalation. Participants in the ozanimod groups received ozanimod 0.23 mg on days 1–4, ozanimod 0.46 mg on days 5–7, and then their assigned dose (either 0.46 mg or 0.92 mg) starting on day 8. Upon entering DAYBREAK, all participants underwent the 7-day dose escalation described above to maintain blinding of the phase 3 parent trial.
MRI data acquisition and quantification
During RADIANCE, MRI scans were performed at screening, month 12, and month 24. During SUNBEAM, they were performed at screening, month 6, and month 12. The last MRI from the parent trial served as the “baseline” MRI for DAYBREAK (a new baseline MRI was performed if the last MRI was ⩾6 months before entry into DAYBREAK). During DAYBREAK, MRIs were performed every 12 months and at termination; MRI scans were analyzed if they occurred within 44 days of each scheduled MRI visit. Details on the MRI acquisition protocol are provided in Supplemental Material.
SDMT
In the SDMT, various symbols are substituted for digits, and participants must match the appropriate symbol to the paired numerical digit using a key. 27 Scoring is based on the number of correct responses given in 90 seconds, with higher scores indicating faster processing; a score change of ⩾4 points is considered clinically meaningful. 27 The percentage of participants whose scores showed improvement (⩾4-point increase), worsening (⩾4-point decrease), or remained stable (<4-point change) was calculated. In SUNBEAM, the SDMT (written and oral versions), a component of the Multiple Sclerosis Functional Composite (MSFC) score, was assessed at baseline, month 6, and month 12. SDMT data were not available from RADIANCE, as RADIANCE used the Paced Auditory Serial Addition Test as a component of the MSFC instead of the SDMT. In DAYBREAK, SDMT (written and oral versions) was assessed every 12 months.
Three-month confirmed disability progression
In the parent trials, EDSS was assessed at screening and every 3 months until study termination. In DAYBREAK, EDSS was assessed at baseline, every 3 months for 3 years, and then every 6 months, upon suspected relapse, and at study termination. Confirmed disability progression (CDP) was defined as ⩾1-point increase from baseline on the EDSS score, confirmed after a 3-month period (but not during a relapse). The date of the initial visit at which the minimum 1-point increase in EDSS was noted was defined as the date of progression onset.
Statistical analyses
All statistical methods are provided in Supplemental Methods.
Results
Participant disposition and baseline characteristics
Of participants enrolled in the phase 3 parent trials (RADIANCE, N = 1320; SUNBEAM, N = 1346), 2256 (84.6%) enrolled in the OLE (RADIANCE, n = 1053; SUNBEAM, n = 1203) and received at least 1 dose of ozanimod 0.92 mg. Demographics and disease characteristics at parent-trial baseline were generally similar across the studies and treatment groups (Table 1).
Baseline demographics and disease characteristics at parent-trial baseline.
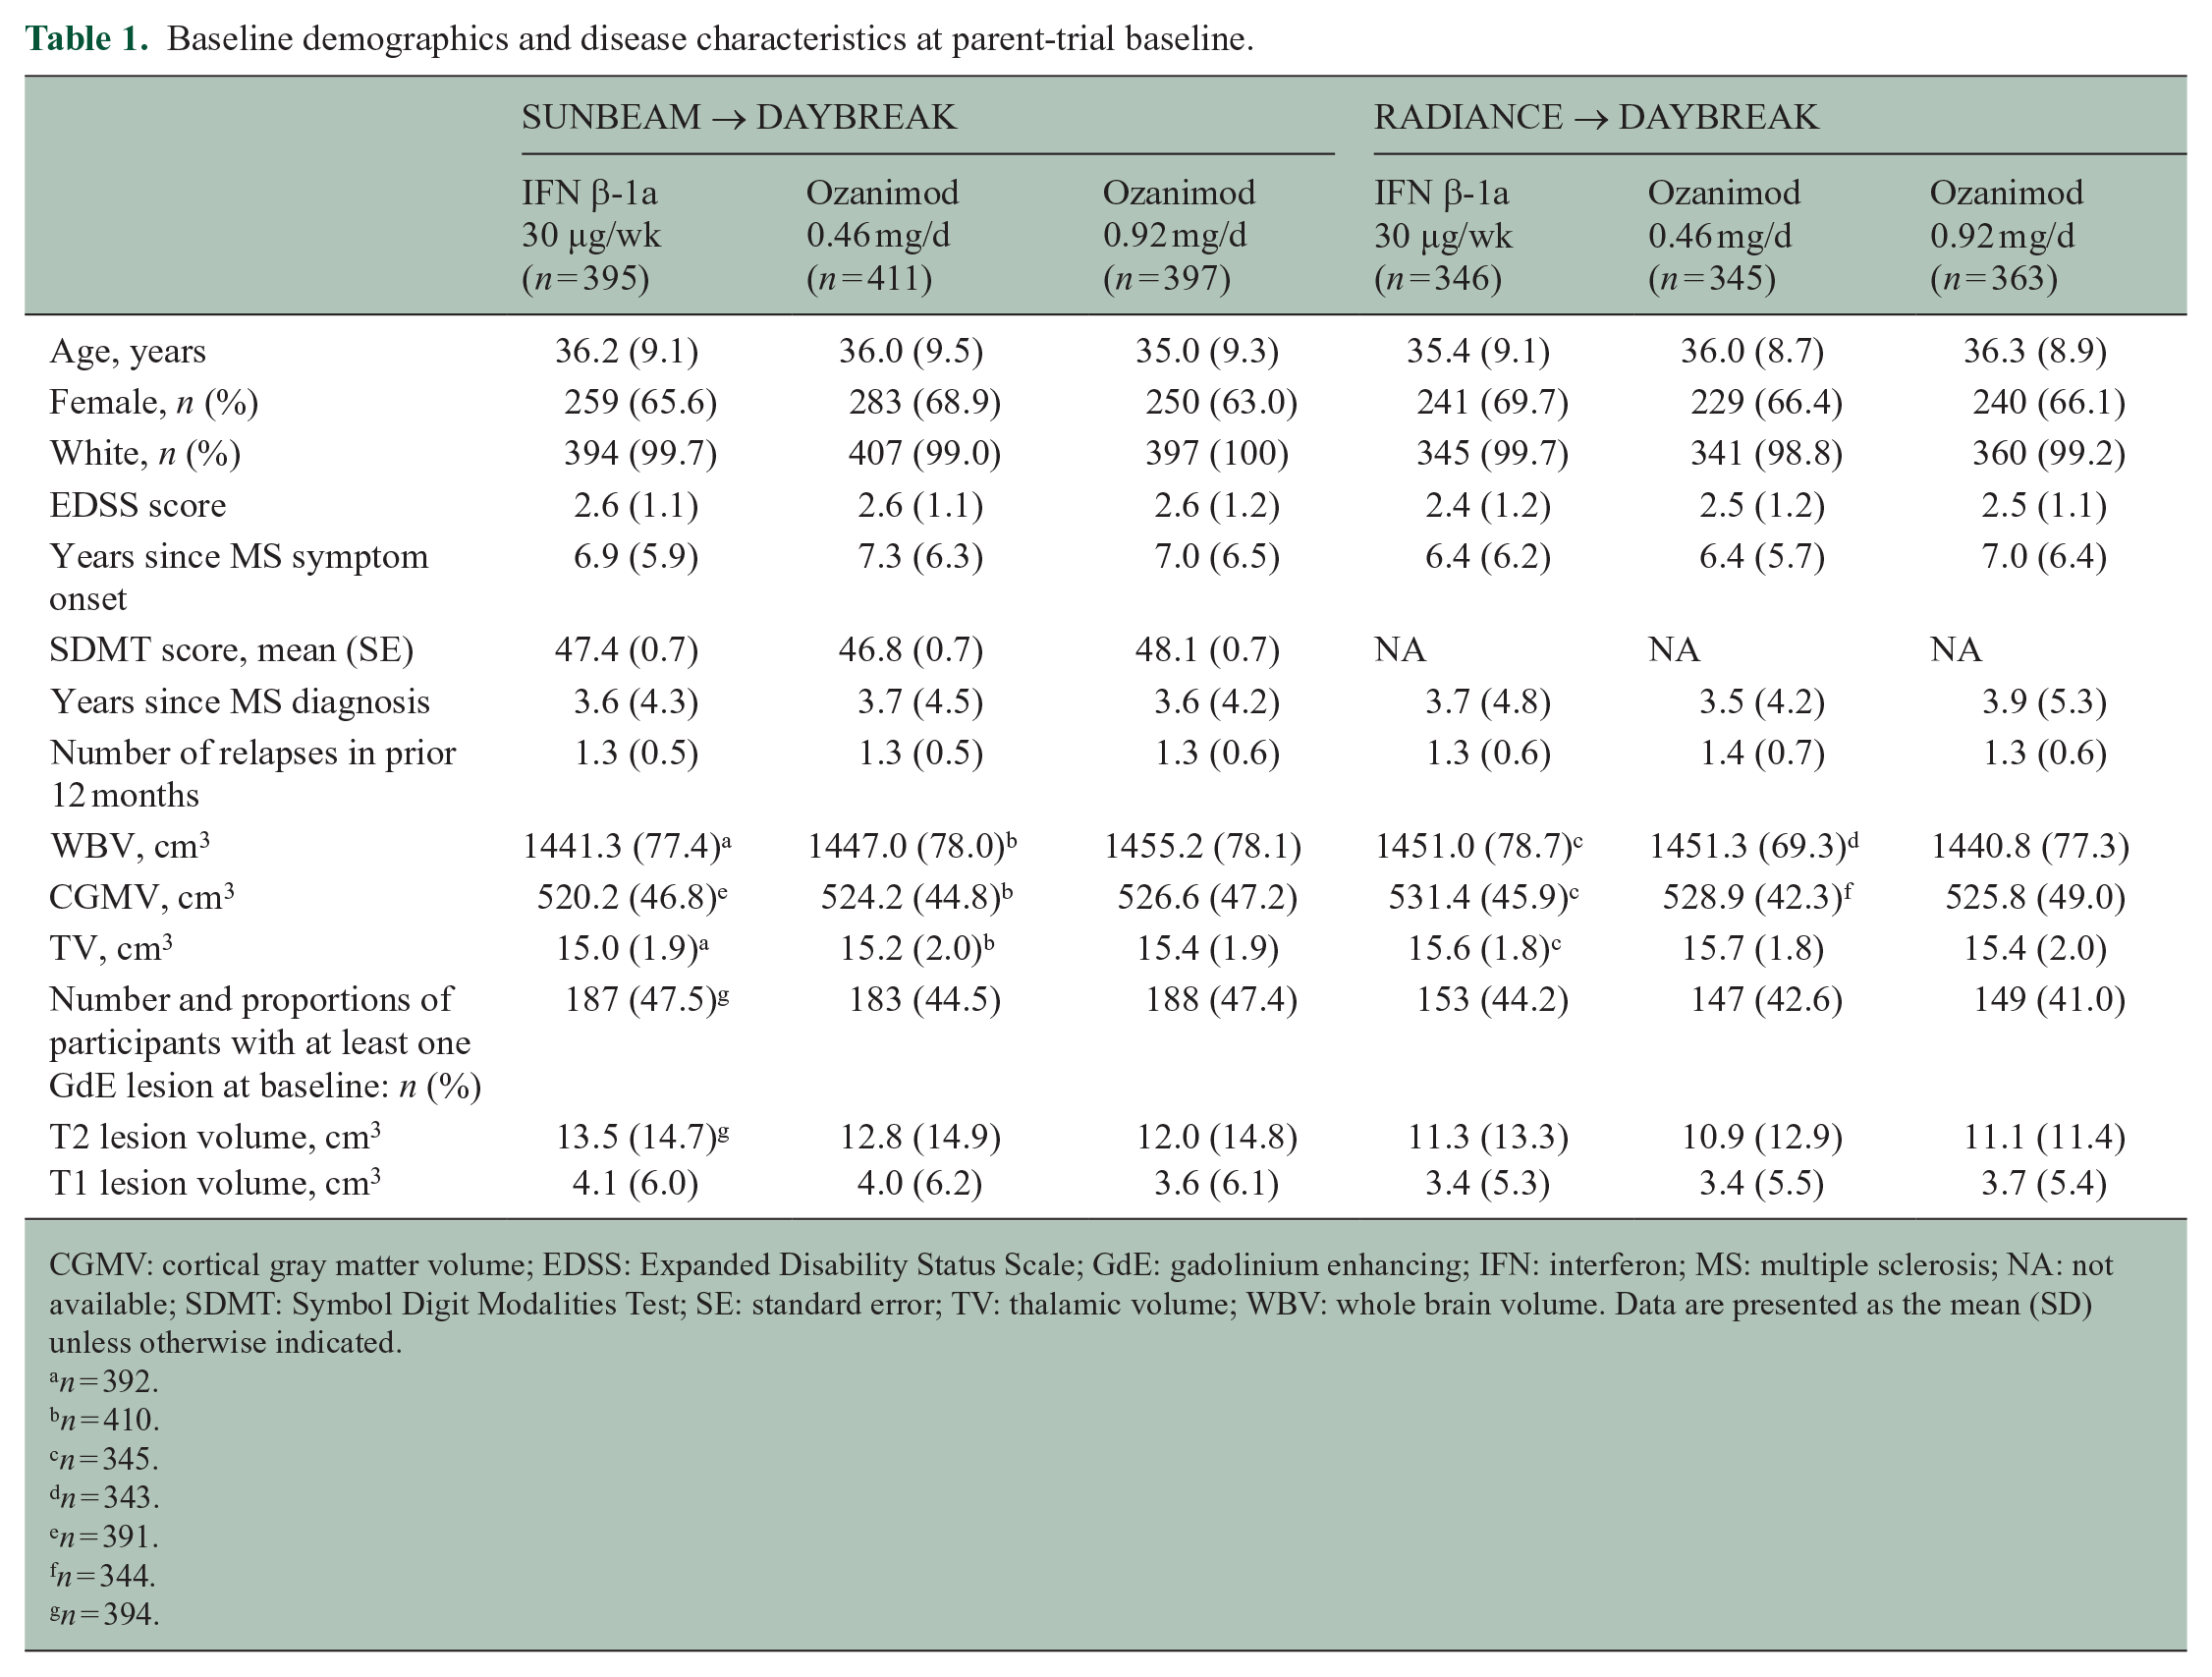
CGMV: cortical gray matter volume; EDSS: Expanded Disability Status Scale; GdE: gadolinium enhancing; IFN: interferon; MS: multiple sclerosis; NA: not available; SDMT: Symbol Digit Modalities Test; SE: standard error; TV: thalamic volume; WBV: whole brain volume. Data are presented as the mean (SD) unless otherwise indicated.
n = 392.
n = 410.
n = 345.
n = 343.
n = 391.
n = 344.
n = 394.
Brain atrophy over time
At the end of the phase 3 trials (RADIANCE, month 24; SUNBEAM, month 12), the rates of brain volume loss in participants taking ozanimod 0.92 mg were lower than those in participants taking IFN (Figure 1(a)–(c)). WBV loss was 23.48% lower (least squares mean percent [LSM%] change from baseline, −0.75% vs. −0.98%, respectively) for RADIANCE and 32.85% lower (LSM% change from baseline, −0.46% vs. −0.69%, respectively) for SUNBEAM; LSM differences (95% confidence interval [CI]) in LSM% changes were significant (RADIANCE: 0.23% [0.12, 0.35], p < 0.0001; SUNBEAM: 0.23% [0.13, 0.32], p < 0.0001). TV loss was 23.43% lower (−1.63% vs. −2.13%, respectively) for RADIANCE and 37.18% lower (−1.20% vs. −1.90%, respectively) for SUNBEAM; LSM differences were significant (RADIANCE: 0.50% [0.19, 0.81], p = 0.0015; SUNBEAM: 0.71% [0.45, 0.96], p < 0.0001). CGMV loss was 57.11% lower (−0.54% vs. −1.26%, respectively) for RADIANCE and 84.02% (−0.17% vs. −1.05%, respectively) for SUNBEAM; LSM differences were significant (RADIANCE: 0.72% [0.58, 0.86], p < 0.0001; SUNBEAM: 0.88% [0.75, 1.02], p < 0.0001).
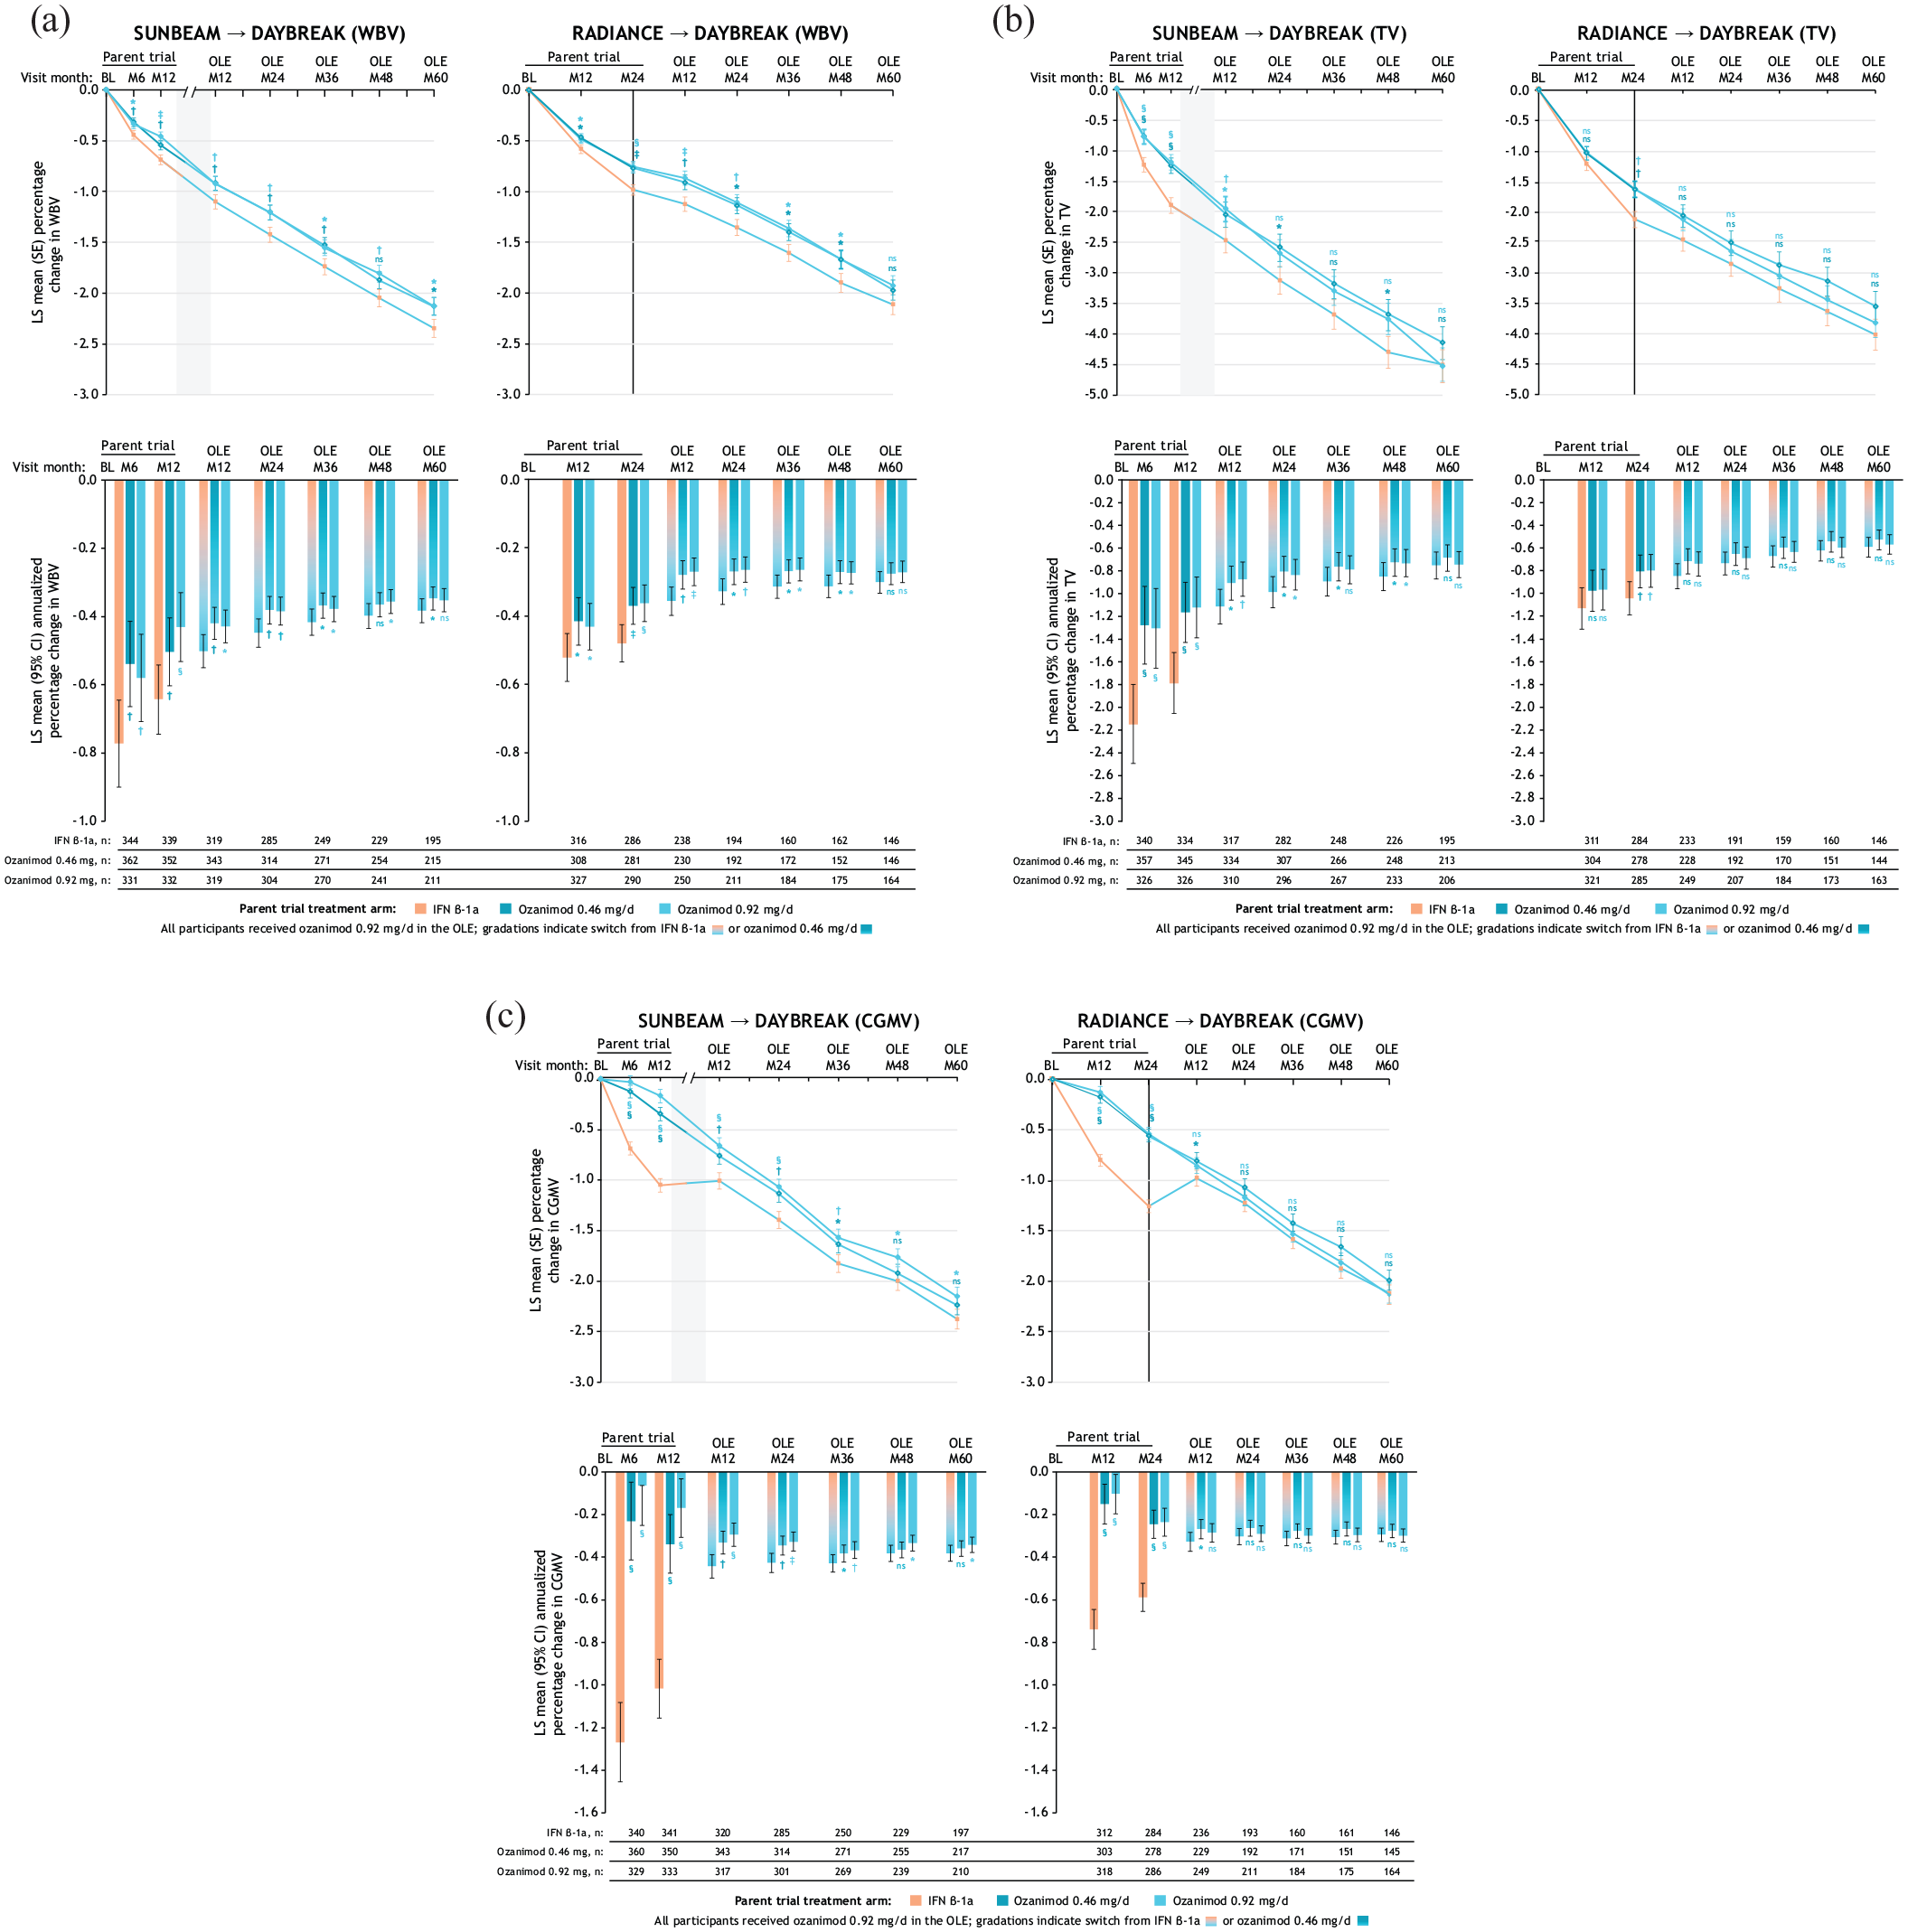
LS mean percentage change and annualized percentage change in whole brain volume (a), thalamic volume (b), and cortical gray matter volume (c) loss over time relative to parent-trial baseline.
In the OLE (DAYBREAK), participants who took continuous ozanimod 0.92 mg from the beginning of the phase 3 trials had low rates of WBV loss that were sustained through OLE month 60. Annualized LSM% change [95% CI] progressively decreased from parent baseline: RADIANCE, OLE month 60, −0.27 [−0.30, −0.24]; SUNBEAM, OLE month 60, −0.35 [−0.39, −0.32] (Figure 1(a)). Rates of TV and CGMV loss also remained low through OLE month 60 (Figure 1(b) and (c)). The LSM% changes (standard error [SE]) from parent-trial baseline to OLE month 60 in WBV, TV, and CGMV, respectively, for participants who took continuous ozanimod 0.92 mg were −2.13 [0.09], −4.54 [0.27], and −2.15 [0.10] for SUNBEAM and −1.92 [0.10], −3.83 [0.24], and −2.13 [0.10] for RADIANCE. Compared with participants who switched to ozanimod 0.92 mg from IFN, participants who took continuous ozanimod 0.92 mg had significantly lower LSM% reductions in WBV from parent baseline through OLE month 48 (RADIANCE; p < 0.05) and OLE month 60 (SUNBEAM; p < 0.05) (Figure 1(a)). Participants who took continuous ozanimod 0.92 mg also had significantly lower LSM% reductions in CGMV at OLE month 60 (SUNBEAM; p < 0.05) versus those who switched from IFN (Figure 1(c)). LSM% reductions in TV loss showed no differences between these groups after OLE month 12 (Figure 1(b)).
In participants from RADIANCE, switching from IFN to ozanimod 0.92 mg reduced rates of WBV loss (annualized LSM% change from parent baseline to RADIANCE month 24 and OLE baseline to OLE month 24: −0.48 and −0.19, respectively); a similar pattern was observed in participants from SUNBEAM (annualized LSM% change from parent baseline to SUNBEAM month 12 and OLE baseline to OLE month 12: −0.64 and −0.39, respectively) and for annualized LSM% change in TV (Figure 1(a) and (b); Supplemental Figure 1(a) and (b)). High rates of CGMV loss were observed with IFN in phase 3 trials (annualized LSM% [95% CI] change at month 12 relative to SUNBEAM baseline: −1.02 [−1.16, −0.88], and at month 24 relative to RADIANCE baseline: −0.59 [−0.66, −0.52]) (Figure 1(c)), but this trend reversed 12 months after switching to ozanimod in the OLE (annualized LSM% [95% CI] increase relative to OLE baseline: SUNBEAM, 0.10 [0.01, 0.18]; RADIANCE, 0.20 [0.10, 0.31]), with low annualized CGMV loss observed thereafter (Supplemental Figure 1(c)).
Brain atrophy and SDMT
Based on tertile analysis, participants with high baseline TV had greater SDMT scores at OLE month 60 than those with low baseline TV (mean [95% CI] for IFN and continuous ozanimod SUNBEAM treatment groups, respectively: high baseline TV, 55.7 [53.2, 58.3] and 55.6 [53.1, 58.1]; low baseline TV, 42.1 [39.4, 44.8] and 41.2 [38.4, 44.0]) (Figure 2(a)). A similar pattern of response was seen in participants with high or low baseline WBV (mean [95% CI] for IFN and continuous ozanimod SUNBEAM treatment groups, respectively: high baseline WBV, 55.3 [52.5, 58.1] and 54.9 [52.5, 57.4]; low baseline WBV, 42.7 [40.1, 45.4] and 41.9 [38.7, 45.2]) (Supplemental Figure 2(a)). During the OLE, participants with high parent baseline TV were numerically more likely to achieve clinically meaningful SDMT score improvement from parent baseline compared with participants with low parent baseline TV. At OLE month 60, the percentages of participants with worsened SDMT scores in high versus low baseline TV groups were 19.6% and 30.7%, respectively (percentage point difference [95% CI], −11.1 [−22.7, 0.5]) in the IFN group, and 26.3% and 26.0% (−0.4 [−11.3, 12.0]) in the continuous ozanimod group (Figure 2(b) and (c)). At OLE month 60, the percentages of participants with improved SDMT scores in high versus low baseline TV groups were 44.3% and 36.0%, respectively (percentage point difference 8.4 [95% CI: −4.9, 21.6]) in the group who switched from IFN, and 43.0% and 35.6% (percentage point difference 7.4 [95% CI −5.5, 20.3]) in the continuous ozanimod group (Figure 2(b) and (c)). A similar pattern of response was seen in participants with high or low baseline WBV (Supplemental Figure 2(b) and (c)).
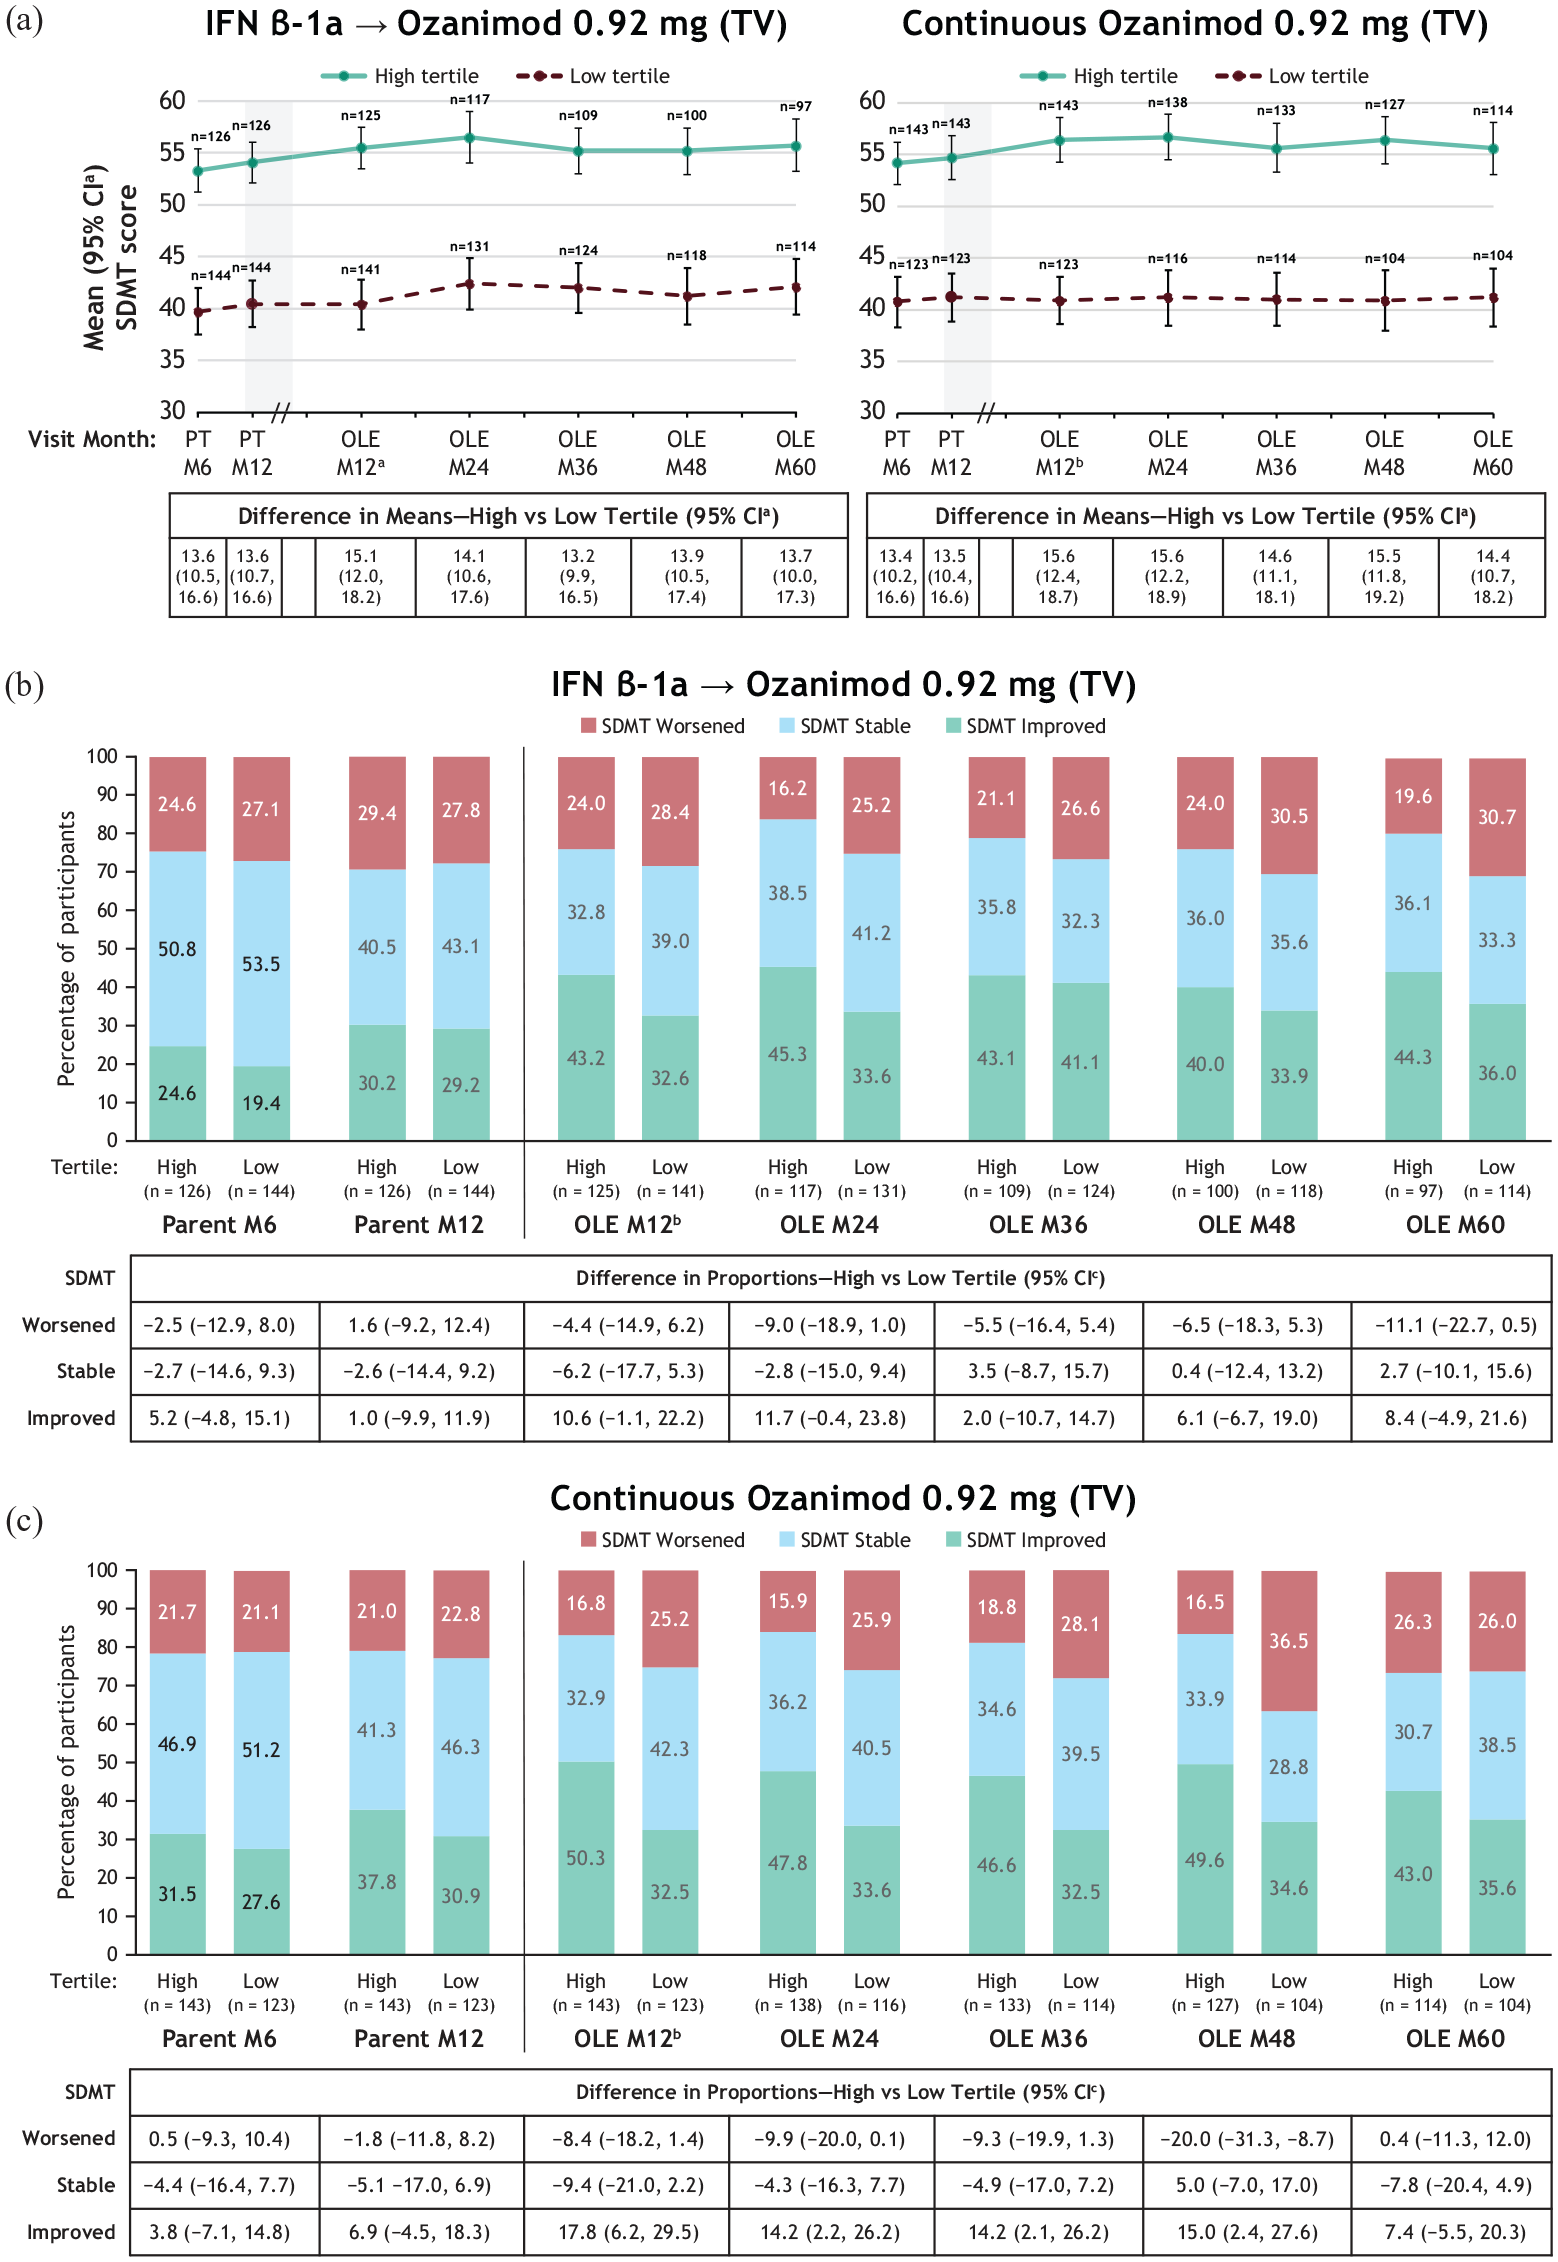
SDMT mean scores (a) and categories of SDMT score change in participants treated with IFN β-1a (b) and ozanimod 0.92 mg (c) by TV baseline tertile in SUNBEAM.
Brain atrophy and 3-month CDP
Low baseline TV was associated with numerically higher percentages of 3-month CDP compared with high baseline TV (Figure 3(a)). For participants originally treated with IFN, the differences in 3-month CDP percentages between high and low TV groups were 10.9 and 14.4 (SUNBEAM and RADIANCE, respectively); for participants treated with continuous ozanimod, the differences were 5.0 and 14.8. The hazard ratios (95% CI) for 3-month CDP in high versus low baseline TV tertiles in SUNBEAM and RADIANCE were 0.61 (0.33, 1.12) and 0.64 (0.40, 1.03) for participants who switched from IFN, respectively, and 0.80 (0.44, 1.45) and 0.61 (0.38, 1.0) for continuous ozanimod. A similar pattern was seen with baseline WBV tertiles (Supplemental Figure 3(a)). Survival analyses of 3-month CDP over time for participants with low and high baseline TV are shown in Figure 4(a) and (b).
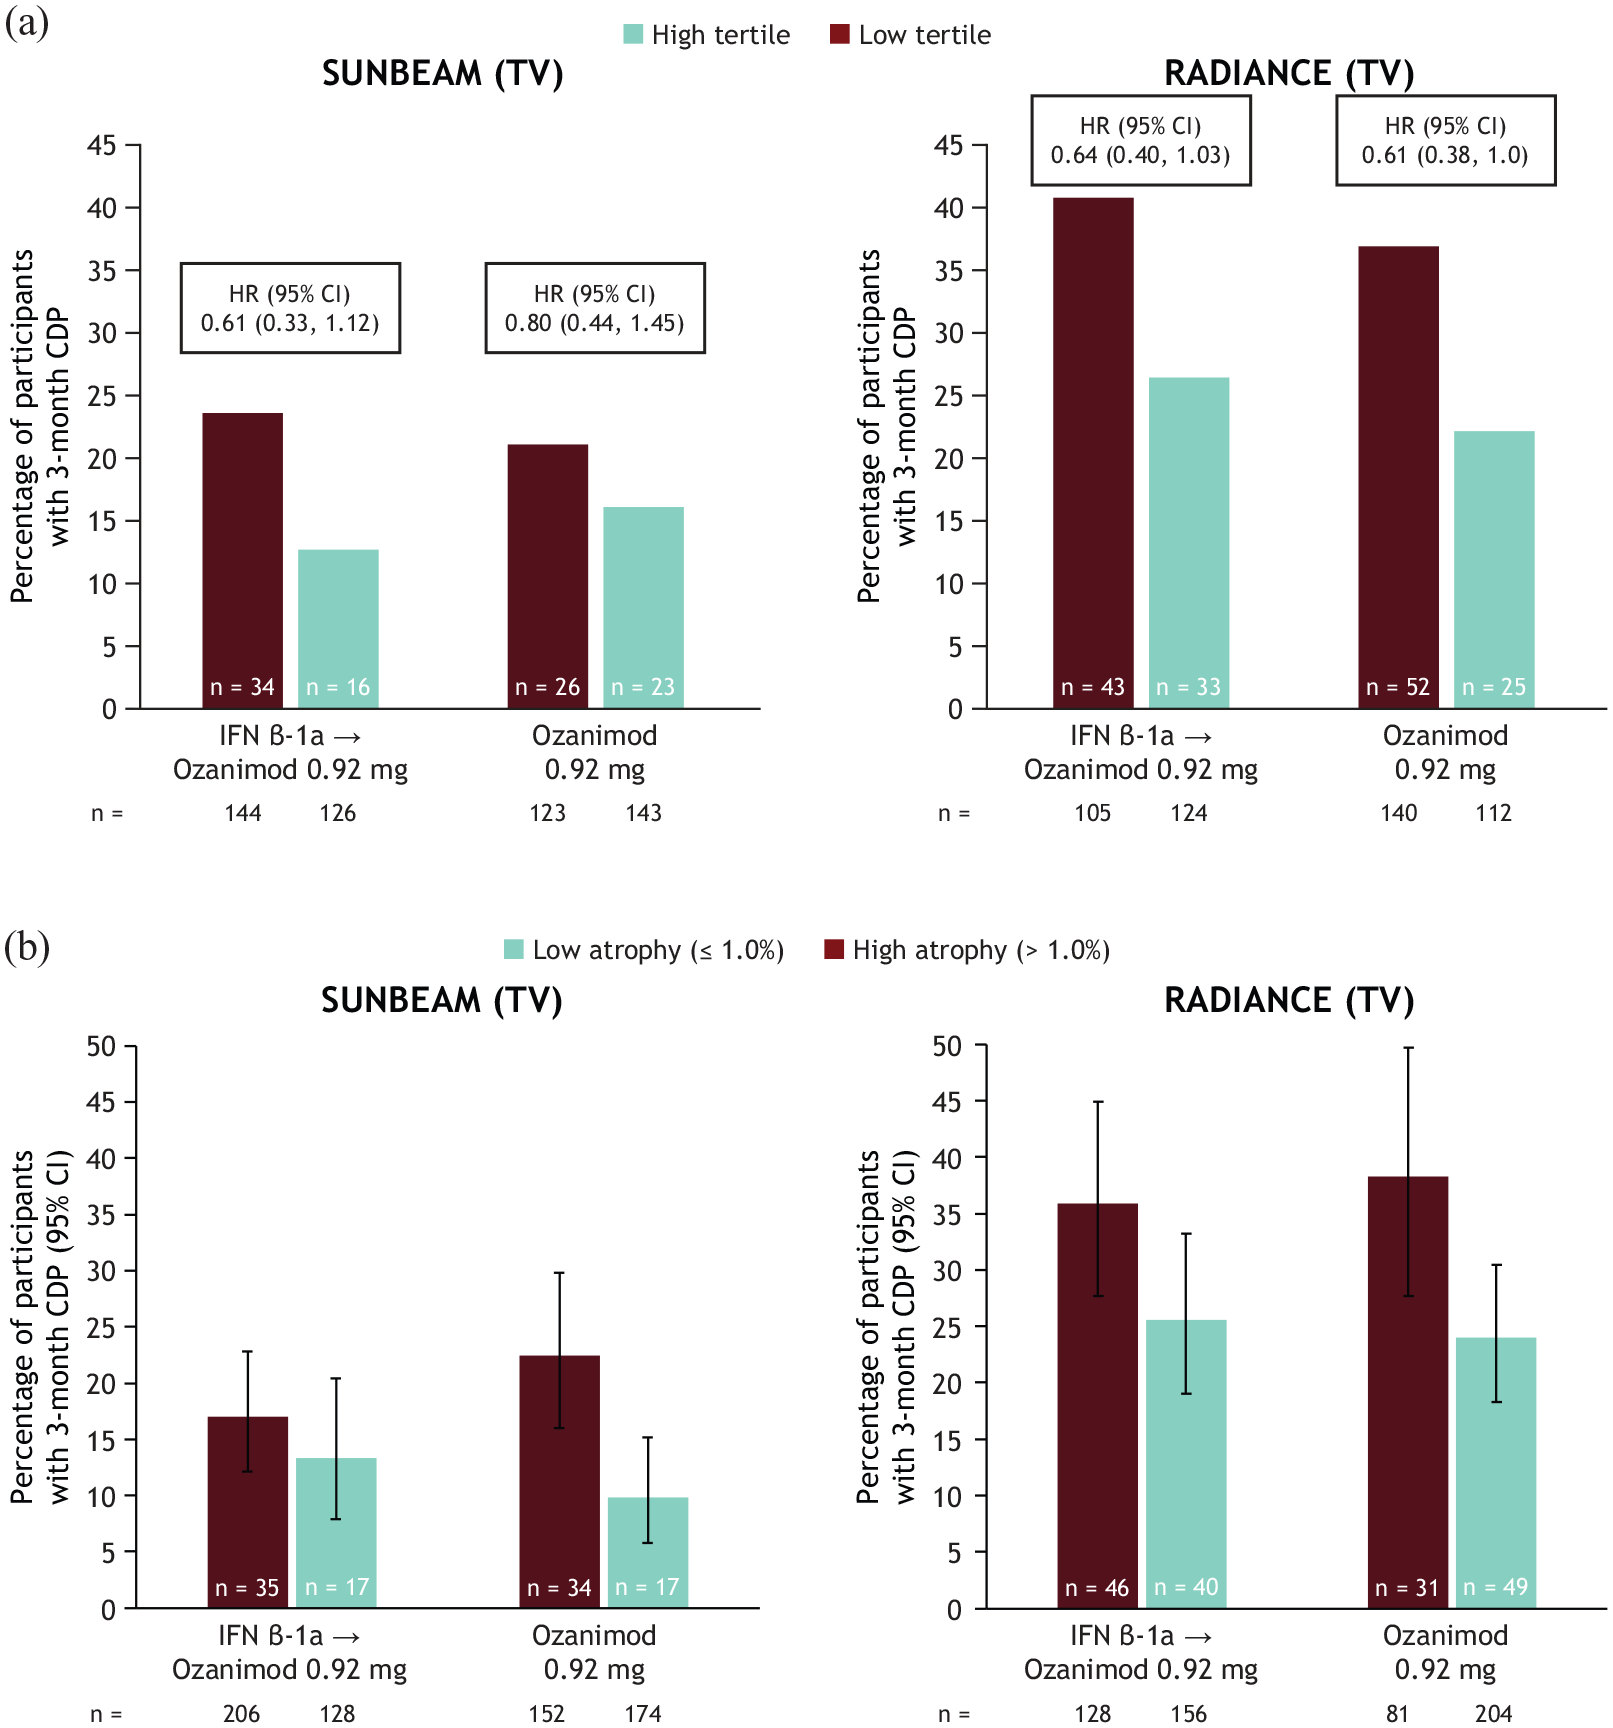
Proportions of participants with 3-month CDPa by baseline thalamic volume tertiles (a) and by thalamic atrophy (⩽1.0%) rates at the end of parent trialb (b).
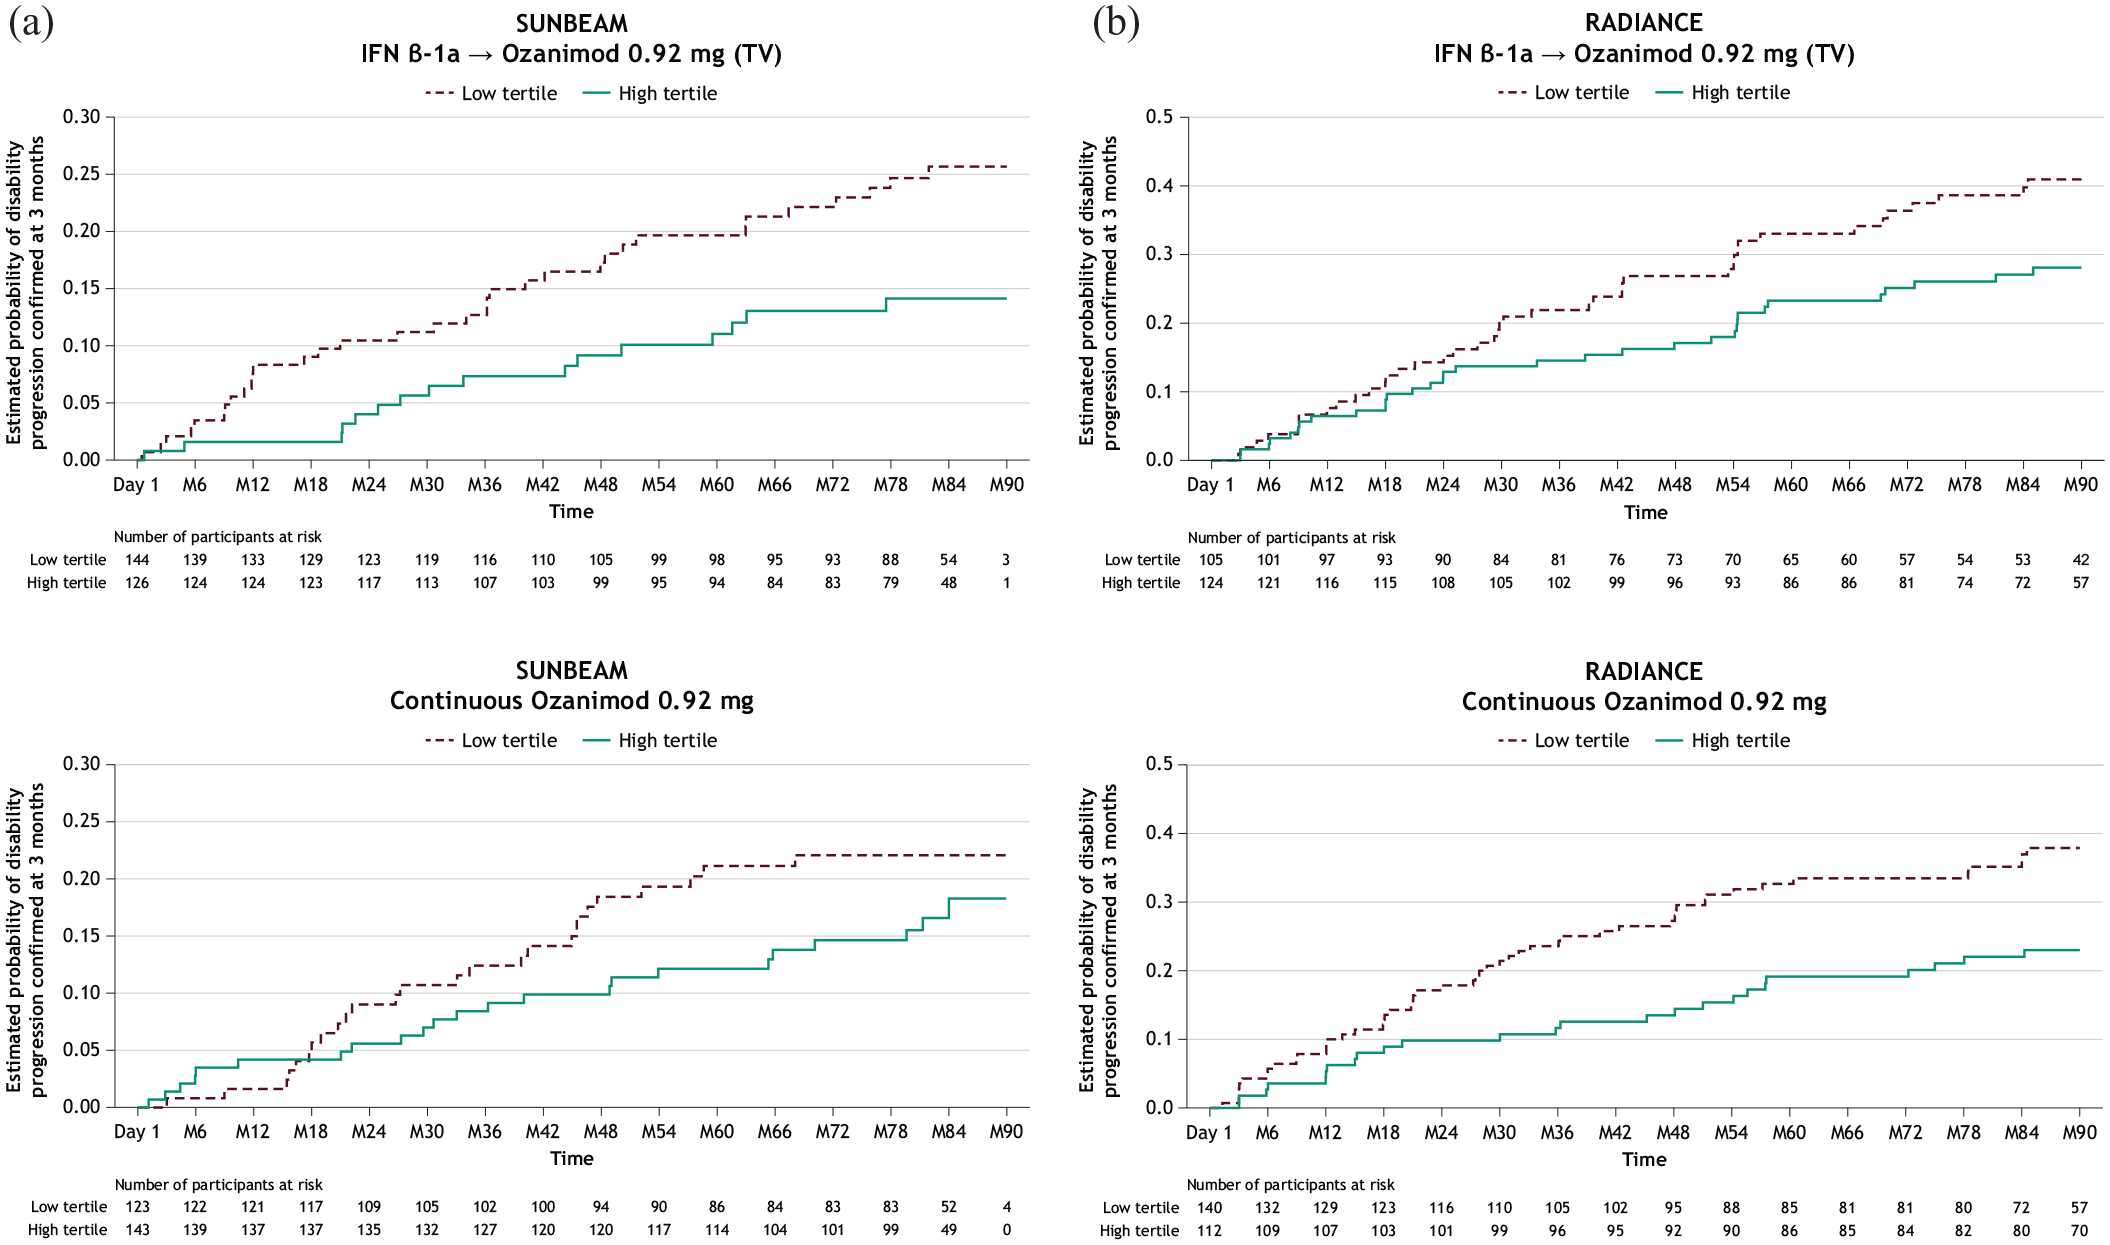
Kaplan-Meier curves of 3-month CDPa by baseline thalamic volume tertile (low vs. high) in participants treated with IFN β-1a or ozanimod 0.92 mg in SUNBEAM (a) and RADIANCE (b).
Participants with a low annualized rate of thalamic atrophy (⩽1.0%) by the end of the double-blind periods were numerically less likely to have a 3-month CDP than those with a high thalamic atrophy rate (Figure 3(b)). For participants who were originally treated with IFN, the differences in 3-month CDP percentages between high and low TV atrophy groups were 3.7 and 10.3 (SUNBEAM and RADIANCE, respectively); for participants treated with continuous ozanimod, the differences were 12.6 and 14.3. A similar pattern was again seen when examining 3-month CDP rates in those with high and low WBV atrophy rates (Supplemental Figure 3(b)).
Predictors of 3-month CDP
Greater TV z-score at baseline was associated with lower risk of 3-month CDP in participants treated with IFN in SUNBEAM and RADIANCE and in those continuously treated with ozanimod from RADIANCE (hazard ratio (HR) [95% CI] for IFN and continuous ozanimod treatment groups, respectively: SUNBEAM, 0.721 [0.573, 0.908], p = 0.0053 and 0.813 [0.642, 1.028], p = 0.0835; RADIANCE, 0.749 [0.615, 0.912], p = 0.0041 and 0.745 [0.618, 0.898], p = 0.0020) (Figure 5(a) and (b)). A similar trend was also observed for WBV (Figure 5(a) and (b)).
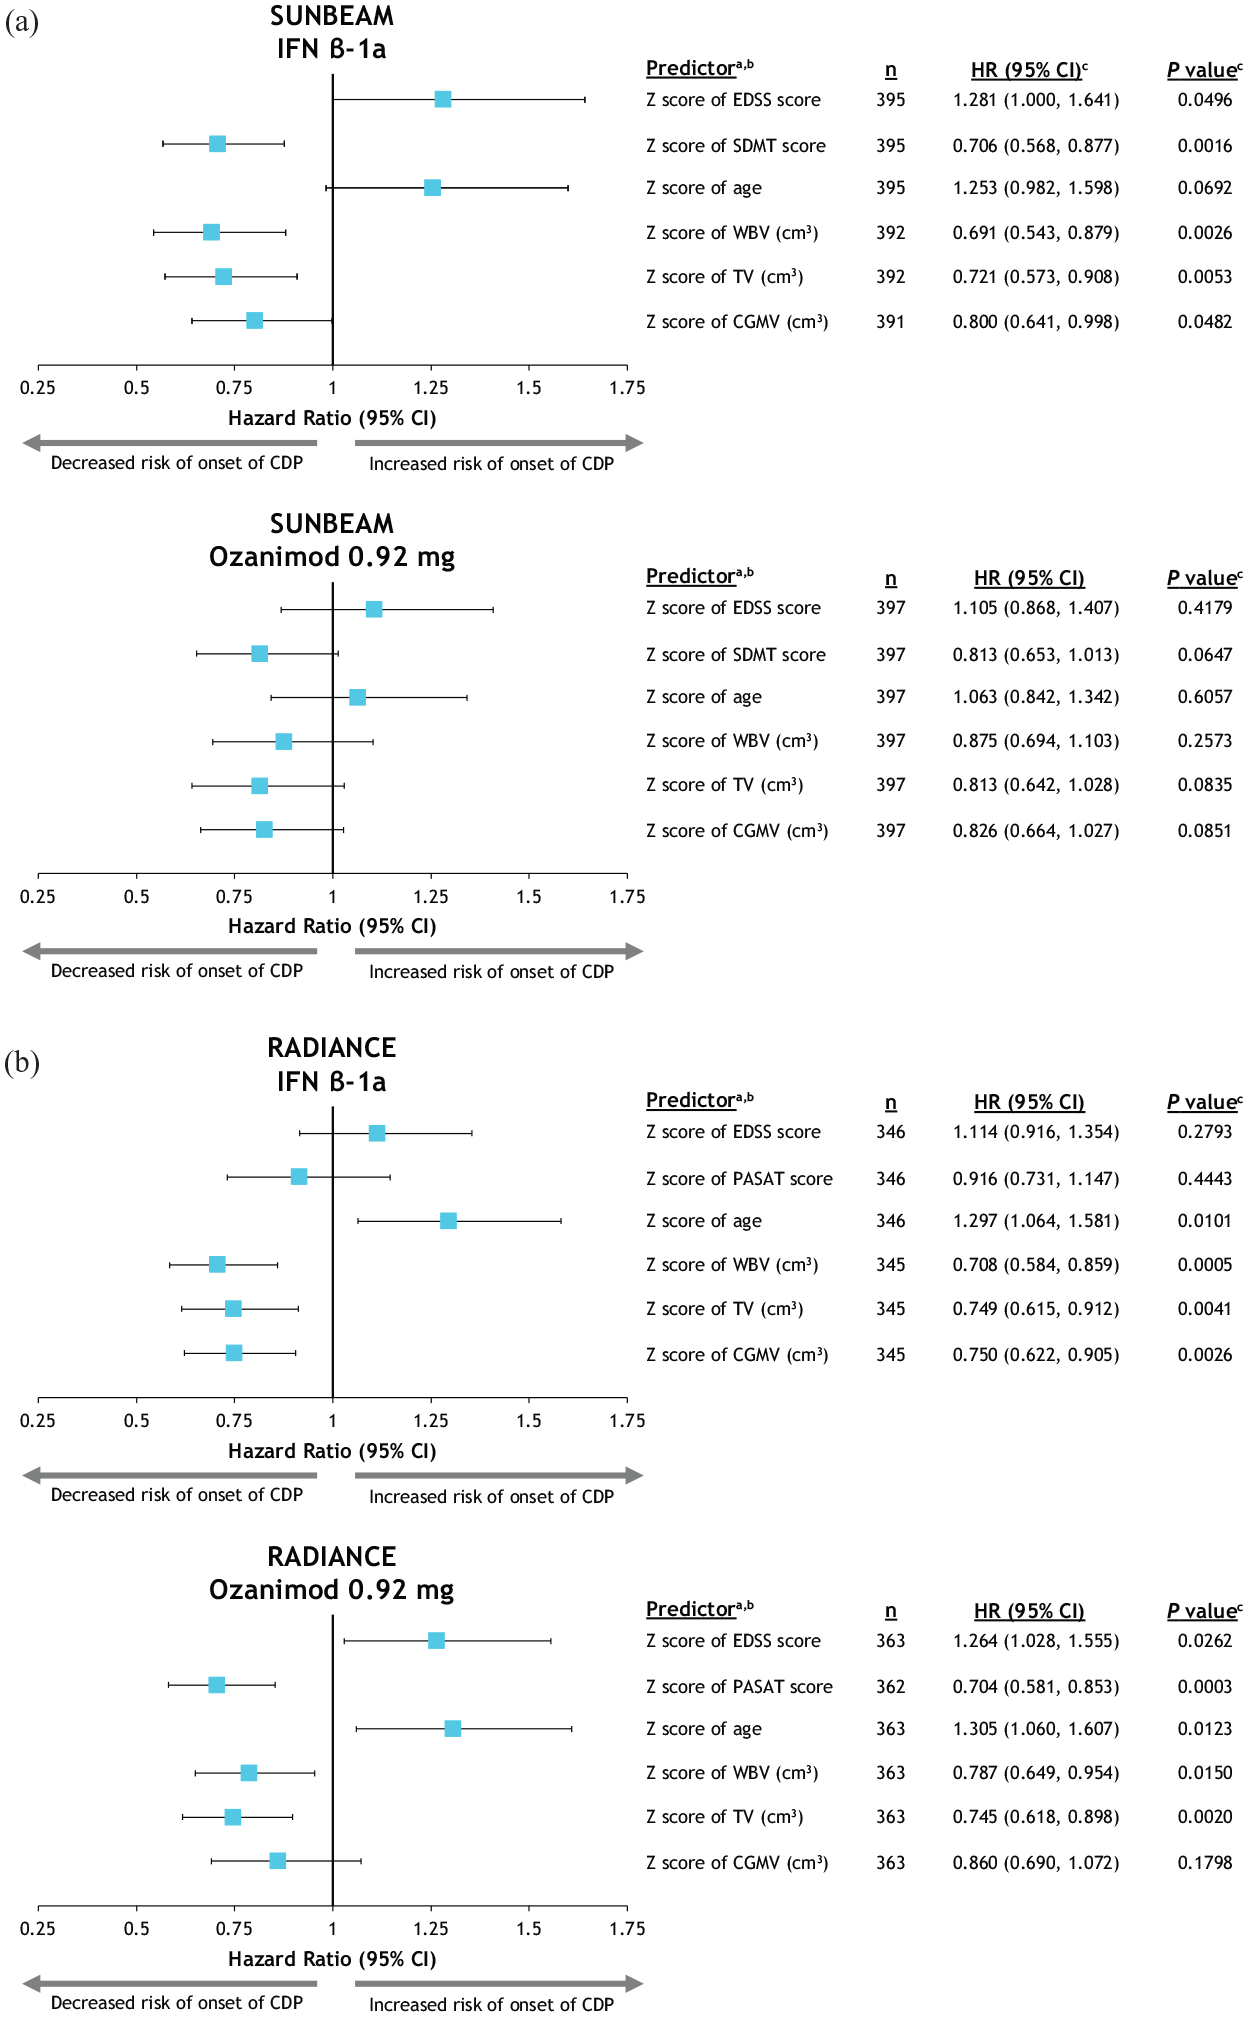
Predictors of 3-month CDP in participants treated with IFN β-1a or ozanimod 0.92 mg in SUNBEAM (a) and RADIANCE (b).
Discussion
This study confirms that the reduction of WBV, TV, and CGMV atrophy rates with ozanimod treatment observed during the phase 3 parent trials was sustained for up to 7 years in participants with RMS. Participants treated with IFN during phase 3 parent trials had significantly reduced brain atrophy rates after switching to ozanimod in the OLE. However, early treatment with ozanimod resulted in significantly lower atrophy rates over up to 5 years compared with those first treated with IFN who later switched to ozanimod. Participants with high baseline TV had a numerically higher likelihood of SDMT improvement over time than participants with low baseline TV. Participants with greater baseline TV and those with an annual thalamic atrophy rate ⩽1.0% during the phase 3 parent trials were less likely to have 3-month CDP than those with lower baseline TV or high rates of thalamic atrophy. Similar results were observed with WBV. Both baseline volumes and atrophy rates observed over time can thus be valuable biomarkers in predicting disability progression or cognitive performance in PwMS.
The annualized atrophy rates of participants treated with continuous ozanimod 0.92 mg for the longest duration (2 years in RADIANCE plus 5 years in OLE; LSM% [SE], WBV −0.27 [0.02], CGMV −0.30 [0.02], TV −0.57 [0.04]) were similar to those previously reported from healthy controls (mean [standard deviation], WBV −0.23 [0.12], CGMV −0.28 [0.32], TV −0.48 [0.10]). 12 Participants treated with IFN had significantly higher brain atrophy rates during the parent trials than those who took either dose of ozanimod; however, these atrophy rates significantly attenuated once these participants switched to ozanimod. Beyond OLE month 12, the brain atrophy rates were nearly similar among participants previously taking IFN and participants continuously treated with ozanimod, suggesting an onset of action for the reduction of brain atrophy within 12 months after initiating ozanimod treatment. Despite a significant reduction in atrophy rates during the OLE, participants who took IFN had a significantly greater annualized percentage loss relative to phase 3 baseline in WBV (and in CGMV and TV for those from SUNBEAM) for 4–5 years into the OLE compared with those who had taken ozanimod since the beginning of the phase 3 trials. This finding supports the value of early treatment with ozanimod in the reduction of brain atrophy.
In the present study, participants in the top tertile of baseline TV showed improved SDMT scores (⩾4 points) over 5 years compared with participants in the bottom TV tertile. These findings are consistent with previous reports of the association between TV and SDMT performance. 21 SDMT scores over time in participants with low baseline TV (based on tertile analysis) were below the cutoff score of 44 indicating impairment. 28
Previous studies have highlighted the thalamus as having a greater atrophy rate in PwMS than other brain regions8,12 and have established strong associations between thalamic atrophy and worsening disability and cognitive functioning.13,21 In this study, TV and WBV were consistent predictors of disability progression. In agreement with previous findings, 1 other factors such as disability scores, cognitive scores, and other neuroradiological factors were also associated with disability progression. However, establishing a cutoff value for annualized thalamic atrophy rate may represent a novel clinical opportunity for monitoring disease evolution and treatment efficacy in PwMS. Due to its smaller size, TV may be less subject to MRI artifacts such as patient movements, geometric distortions, or MR intensity inhomogeneities than WBV, but its quantification remains challenging due to unclearly defined margins. The thalamus is proportionally more affected by degeneration than WBV due to its susceptibility to both primary degeneration and trans-synaptic degeneration resulting from axonal transection in lesions.29–31 The quantification of both WBV and TV may therefore provide valuable complementary information for monitoring disease evolution and treatment efficacy in PwMS. Here, we propose that an annualized thalamic atrophy cutoff of 1.0% is clinically meaningful based on the range of rates observed in our trial population, from 0.7% to 1.3%. In this study, participants with RMS with an annualized thalamic atrophy rate ⩽1.0% were less likely to have 3-month CDP than those with a rate >1.0%. These results were consistent with the proposed whole brain atrophy cutoff value of 0.4%. Additional validation efforts using data from other cohorts and different quantification methods are warranted to confirm an optimal thalamic atrophy cutoff value. Three-month CDP, while offering heightened sensitivity in detecting changes in disability progression, may also introduce variability due to the shorter assessment period when compared with 6-month CDP. 32 This increased sensitivity can lead to earlier identification of disability progression, but it may also capture transient fluctuations that do not reflect sustained disability changes.
In conclusion, these data support the sustained efficacy of ozanimod treatment on reducing brain atrophy in PwMS over a long follow-up period and further show the relationship of brain volumes with cognitive performance and disability progression.
Supplemental Material
sj-docx-1-msj-10.1177_13524585251355842 – Supplemental material for Brain atrophy and associations with long-term disability and cognitive function in participants with relapsing multiple sclerosis treated with ozanimod: Results from phase 3 and open-label extension trials
Supplemental material, sj-docx-1-msj-10.1177_13524585251355842 for Brain atrophy and associations with long-term disability and cognitive function in participants with relapsing multiple sclerosis treated with ozanimod: Results from phase 3 and open-label extension trials by Jeffrey A Cohen, Douglas L Arnold, John DeLuca, Hans-Peter Hartung, Ludwig Kappos, Giancarlo Comi, Krzysztof Selmaj, Lawrence Steinman, Amit Bar-Or, Xavier Montalban, Eva K Havrdová, James K Sheffield, Chahin Pachai, Chun-Yen Cheng, Jon V Riolo and Bruce AC Cree in Multiple Sclerosis Journal
Footnotes
Acknowledgements
Writing, editorial, and submission assistance was provided by Noud van Helmond, MD, PhD, Emily Bruggeman, PhD, Jessica Brunquell, PhD, and Cristina Silvestre of Peloton Advantage, LLC, an OPEN Health company, and was funded by Bristol Myers Squibb. The authors thank Zhaohui Liu, PhD, who assisted with data analysis. The authors also thank the participants, their families, and trial investigators for their contributions.
Authors’ Note
Some data from this manuscript were previously presented at the 40th Congress of the European Committee for Treatment and Research in Multiple Sclerosis (ECTRIMS), September 18–20, 2024, in Copenhagen, Denmark.
Declaration of Conflicting Interests
The author(s) declared the following potential conflicts of interest with respect to the research, authorship, and/or publication of this article: J.A.C.: personal compensation for consulting for Astoria, Atara, Biogen, Bristol Myers Squibb, Convelo, and Viatris. D.L.A.: consulting fees from Biogen, Biohaven, Bristol Myers Squibb, Eli Lilly, EMD Serono, Find Therapeutics, Frequency Therapeutics, GlaxoSmithKline, Idorsia Pharmaceuticals, Kiniksa Pharmaceuticals, Merck, Novartis, Race to Erase MS, Roche, Sanofi-Aventis, Shionogi, and Xfacto Communications and equity interest in NeuroRx. J.D.: personal compensation for consulting from Biogen, Bristol Myers Squibb, Janssen Pharmaceuticals, and Novartis; speaker for Biogen, Consortium of MS Centers, and EMD Serono; and grant funding from Biogen, Bristol Myers Squibb, Canadian MS Society, Consortium of MS Centers, EMD Serono, Genentech, National Institutes of Health, and National MS Society. H.-P.H.: personal fees for consulting, serving on steering committees, and speaking from Bayer Healthcare, Biogen, Celgene, GeNeuro, Genzyme, MedImmune, Merck, Novartis, Octapharma, Roche, Sanofi, and TG Therapeutics. L.K.: received no personal compensation. His institutions (University Hospital Basel/Stiftung Neuroimmunology and Neuroscience Basel) received payments for steering committee, advisory and data safety monitoring board participation, consultancy services, and educational activities from Bayer, Biogen, Bristol Myers Squibb, Celltrion, Clene Nanomedicine, EMD Serono Research and Development, Galapagos, Genentech, Immunic, Janssen, Kiniksa Pharmaceuticals, Laboratoires Juvise Pharmaceuticals, Merck Healthcare, Merck Sharp & Dohme, Minoryx Therapeutics, Neurostatus-UHB, Novartis, Roche, Sanofi, Shionogi, Wellmera, and Zai Lab and research support from Novartis, Roche, and Innosuisse. G.C.: compensation for consulting and/or speaking activities from Almirall, Biogen, Celgene, EXCEMED, Forward Pharma, Genzyme, Merck, Novartis, Roche, Sanofi, and Teva. K.S.: consulting for Biogen, Celgene, Genzyme, Merck, Novartis, Ono Pharma, Roche, Synthon, and Teva. L.S.: consulted for AbbVie, Atreca, Bristol Myers Squibb, EMD Serono, Novartis, Pasithea, Teva, TG Therapeutics, and 180 Life Sciences and research support from Atara and Bristol Myers Squibb. A.B.-O.: personal fees for advisory board participation and/or consulting from Abata, Accure, Atara Biotherapeutics, Biogen, BMS/Celgene/Receptos, GlaxoSmithKline, Gossamer, Horizon Therapeutics, Immunic, Janssen/Actelion, MedImmune, Merck/EMD Serono, Novartis, Roche/Genentech, Sangamo, Sanofi-Genzyme, and Viracta and grant support to the University of Pennsylvania from Biogen, Merck/EMD Serono, Novartis, and Roche/Genentech. X.M.: Professor Montalban’s institution has received compensation for lecture honoraria and travel expenses, participation in scientific meetings, clinical trial steering committee membership, or clinical advisory board participation in recent years from AbbVie, Actelion, Alexion, AstraZeneca, Autolus, Bial PD, Biogen, Bristol Myers Squibb/Celgene, EMD Serono, Genzyme, Hoffmann-La Roche, Immunic Therapeutics, Indivi, Janssen Pharmaceuticals, Juvisé Pharmaceutical, Lilly, MedDay, Medscape, Merck, Merz Therapeutics, Mylan-Viatris, Nervgen, Neuraxpharm, Novartis, Peervoice, Rewind Therapeutics, Samsung-Biosys, Sandoz, Sanofi-Genzyme, Teva Pharmaceuticals, TG Therapeutics, Zenas Biopharma, Excemed, ECTRIMS, MSIF, and NMSS or any of their affiliates. E.K.H.: honoraria/research support from Biogen, Merck Serono, Novartis, Roche, and Teva; has served as a member of advisory boards for Actelion, Biogen, Celgene, Merck Serono, Novartis, and Sanofi-Genzyme; and support from the Czech Ministry of Education—project Cooperatio LF1, research area Neuroscience, and the project National Institute for Neurological Research (Program EXCELES, ID project No LX22NPO5107)—funded by the European Union-Next Generation EU. J.K.S.: former employee of Bristol Myers Squibb. C.P., C.Y.C., and J.V.R.: employees and/or shareholders of Bristol Myers Squibb. B.A.C.C.: personal compensation for consulting from Alexion, Atara, Autobahn, Avotres, Biogen, Boston Pharma, EMD Serono, Gossamer Bio, Hexal/Sandoz, Horizon, Immunic AG, Kyverna, Neuron23, Novartis, Sanofi, Siemens, and TG Therapeutics and research support from Genentech and Kyverna.
Funding
The author(s) disclosed receipt of the following financial support for the research, authorship, and/or publication of this article: This study was sponsored by Bristol Myers Squibb.
Supplemental material
Supplemental material for this article is available online.
References
Supplementary Material
Please find the following supplemental material available below.
For Open Access articles published under a Creative Commons License, all supplemental material carries the same license as the article it is associated with.
For non-Open Access articles published, all supplemental material carries a non-exclusive license, and permission requests for re-use of supplemental material or any part of supplemental material shall be sent directly to the copyright owner as specified in the copyright notice associated with the article.