
Abstract
Introduction:
Agreement and correlation of arterial blood gases (ABGs) and venous blood gases (VBGs) at near normal values are well described but have not been well validated at extremes of values. We evaluated the agreement and correlation of ABG and VBG at extremes of values and assessed the utility of VBG as a screening tool.
Methods:
We performed a retrospective, observational study of ABG and VBG collected at the same time. Statistical analysis included Bland-Altman plot analysis, Pearson correlations, and sensitivity/specificity tests. For limits of agreement (LOA), we set a threshold of ±0.10 units for pH and ±2.4 mm Hg for partial pressure of carbon dioxide (pCO2). A threshold of 80% sensitivity was considered appropriate for VBG to be used as a screening tool for abnormal ABG values.
Results:
There were 1684, 1744, and 1769 paired pH, pCO2, and HCO3¯ results, respectively. Mean difference (MD) for arterial and venous pH was 0.017 (95% confidence interval [CI]: 0.014-0.020; 95% LOA: −0.11 to 0.15), and Pearson correlation was 0.78 (P < .0001). At venous pH <7.35, MD was 0.025 (95% CI: 0.019-0.030; 95% LOA: −0.12 to 0.17). Sensitivity of venous pH <7.35 identifying arterial pH <7.35 was 85.0%. MD for arterial and venous pCO2 was −2.5 (95% CI: −2.9 to −2.0; 95% LOA: −21.7 to 16.8), and Pearson correlation was 0.70 (P < .0001). At venous pCO2 >45 mm Hg, MD was −4.1 (95% CI: −4.9 to −3.3; 95% LOA: −25.7 to 17.5). Sensitivity of venous pCO2 >45 mm Hg identifying arterial pCO2 >45 mm Hg was 67.6%. MD for arterial and venous HCO3¯ was −0.3 (95% CI: −0.4 to −0.2; 95% LOA: −4.8 to 4.2), and Pearson correlation was 0.90 (P < .0001).
Conclusions:
Venous blood gases cannot reliably replace ABGs due to poor agreement in acidemia and hypercarbia. Venous blood gases can be used as a screening tool for acidemia but are unsuitable for hypercarbia.
Introduction
Blood gas analysis is an important part of the evaluation of patients with severe respiratory and metabolic derangements. Arterial blood gas (ABG) analysis is the gold standard for assessing acid-base and ventilation status but can be technically difficult, increase patient discomfort, require an additional needle stick, and may result in complications
1
with rates up to 11.3%.
2
Venous blood gas (VBG) sampling for acid-base and gas exchange assessment may avoid several of the issues noted for ABGs and can be part of the initial venous blood draw. Thus, previous studies have looked at the agreement and correlation between ABG and VBG results and evaluated whether a VBG could replace ABG. However, most of these studies are limited to specific patient populations such as trauma,3,4 diabetic ketoacidosis,5–7 and chronic obstructive pulmonary disease.8,9 Only a few studies have looked at a diverse population that presented to the emergency department (ED)10,11 or intensive care unit (ICU).11,12 Although these studies found good agreement and correlation between ABG analysis and VBG analysis when including all values for pH, pCO2, and
To investigate further, we evaluated the agreement and correlation between ABG values and VBG values in a clinically diverse group of patients at a 4-hospital health system. We then stratified the values for each of the variables to evaluate for continued agreement and correlation, particularly at abnormal values. We then evaluated the sensitivity and specificity of VBG values to identify abnormal ABG values. We also provide a brief description and proper use of the 2 statistical methods commonly used when comparing ABG and VBG analysis.
Methods
Study design, setting, population, and protocol
This was a retrospective, observational study conducted at a 4-hospital health system, including a Level 1 trauma center with a total of 750 beds. All ABG and VBG in the same patient that were collected at the same time between January 1, 2006, and May 1, 2017 were included in the study. Per hospital and laboratory protocol, all blood gas samples are sent “stat” (transferred immediately without batching or delay) to the laboratory, all blood gas analyses are performed within 15 min of sample collection time, and all blood gas analyses are processed as soon as possible after arrival in the laboratory. Arterial and venous blood gases were obtained per unit protocol but were not directly observed given the retrospective nature of the study. There was no differentiation between VBGs sampled peripherally versus centrally. All patients of any clinical status were included in this study, as patient de-identified material was analyzed. The health system’s Institutional Review Board (IRB) deemed that as no identifiable patient information was collected, IRB review was not required and a non-reviewable letter was submitted and accepted.
Measurements and data analysis
The data collected from the ABG and VBG were analyzed using Bland-Altman plots and Pearson correlations. Bland-Altman analysis and plots were used to evaluate and visualize the degree of agreement between arterial and venous pH, pCO2, and
Results
There were 1684 paired arterial and venous pH results, 1744 paired pCO2 results, and 1769 paired
Mean values for arterial and venous pH, pCO2, and

Pearson correlation of arterial and venous pH, pCO2, and

All correlations had P values <.0001.
The Bland-Altman plot for arterial and venous pH is shown in Figure 1. At pH <7.35, the MD was 0.025 (95% CI: 0.019-0.030) with 95% LOA of −0.12 (95% CI: −0.13 to −0.11) to 0.17 (95% CI: 0.16-0.18). The MD was 0.012 (95% CI: 0.009-0.016) with 95% LOA of −0.10 (95% CI: −0.11 to 0.10) to 0.13 (95% CI: 0.12-0.13) for pH ⩾7.35. A venous pH <7.35 was 85.0% sensitive and 63.3% specific in identifying an arterial pH <7.35 with a negative predictive value of 81.1% (Table 3).

Bland-Altman plot of arterial pH and venous pH with mean difference (solid line) and 95% LOA (dotted lines). Mean difference was 0.017 (95% CI: 0.014-0.020) with 95% LOA of −0.11 to 0.15. The 95% CI for the lower LOA was −0.12 to −0.10 and for the upper LOA was 0.14 to 0.15. CI indicates confidence interval; LOA, limits of agreement.
Sensitivity and specificity tables for venous pH <7.35 and pCO2 >45 and >30 mm Hg.
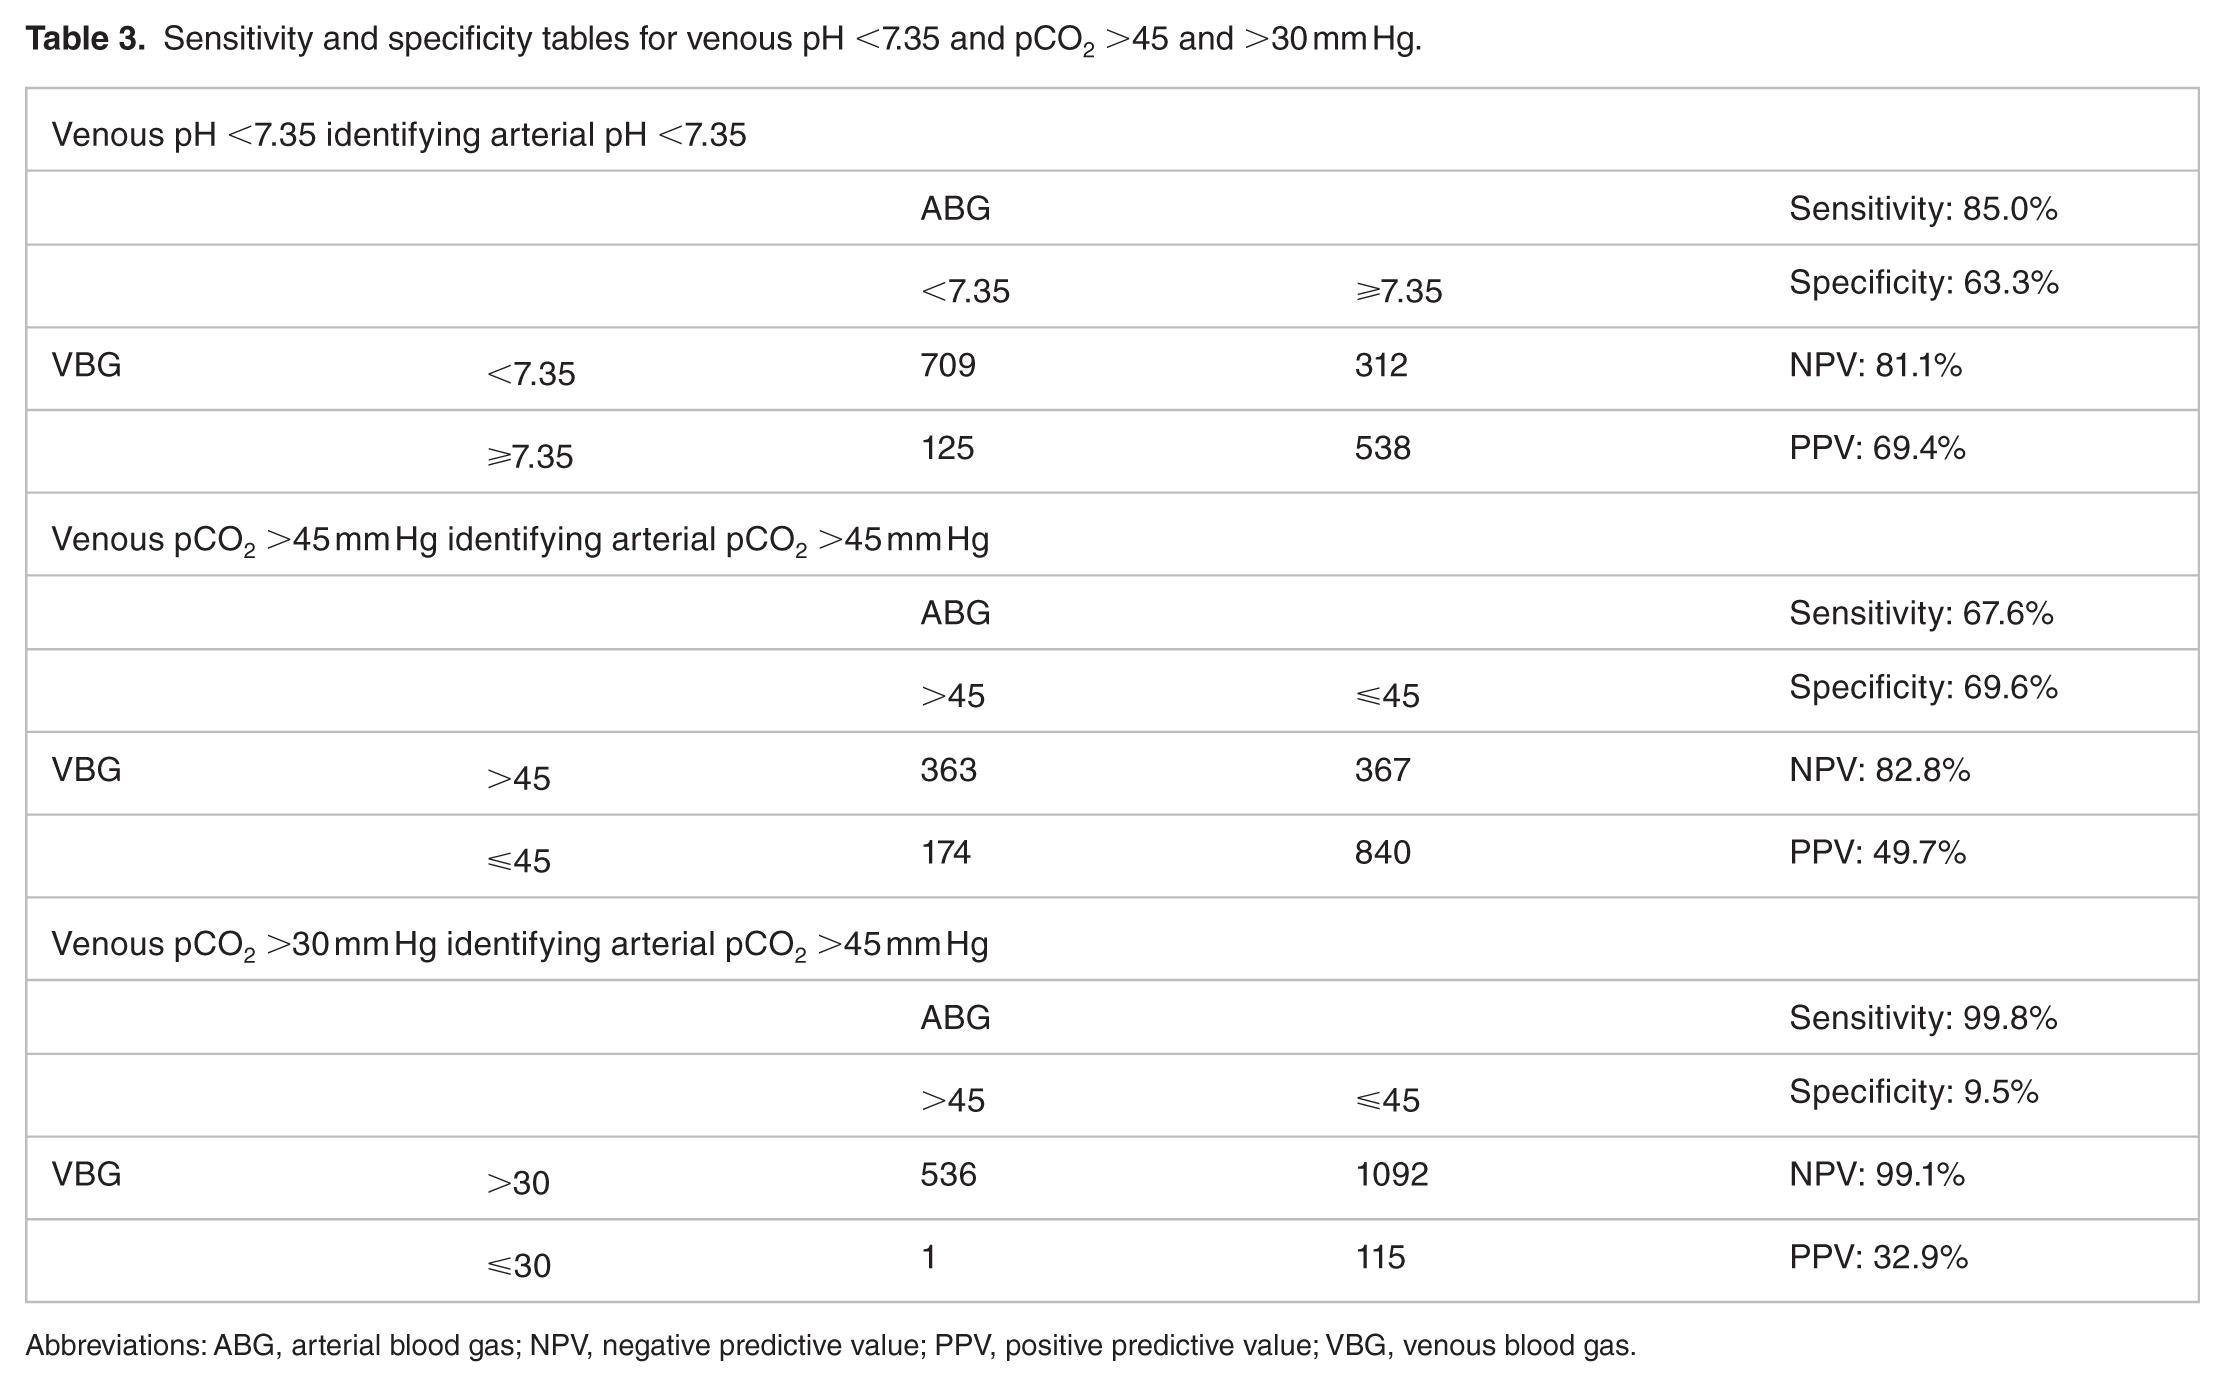
Abbreviations: ABG, arterial blood gas; NPV, negative predictive value; PPV, positive predictive value; VBG, venous blood gas.
The Bland-Altman plot for arterial and venous pCO2 is shown in Figure 2. At pCO2 >45 mm Hg, the MD was −4.1 (95% CI: −4.9 to −3.3) with 95% LOA of −25.7 (95% CI: −27.1 to −24.4) to 17.5 (95% CI: 16.2-18.9). The MD was −1.3 (95% CI: −1.8 to −0.8) with 95% LOA of −18.3 (95% CI: −19.2 to −17.4) to 15.7 (95% CI: 14.7-16.6) for pCO2 ⩽45 mm Hg. A venous pCO2 >45 mm Hg had a sensitivity of 67.6% and a specificity of 69.6% of identifying an arterial pCO2 >45 mm Hg with a negative predictive value of 82.8% (Table 3). Using a venous pCO2 cutoff of greater than 30 mm Hg was 99.8% sensitive and 9.5% specific for identifying an arterial pCO2 >45 mm Hg with a negative predictive value of 99.1% (Table 3).

Bland-Altman plot of arterial pCO2 and venous pCO2 with mean difference (solid line) and 95% LOA (dotted lines). Mean difference was −2.5 (95% CI: −2.9 to −2.0) with 95% LOA of −21.7 to 16.7. The 95% CI for the lower LOA was −22.5 to −20.9 and for the upper LOA was 16.0 to 17.5. CI indicates confidence interval; LOA, limits of agreement.
The Bland-Altman plot for arterial and venous
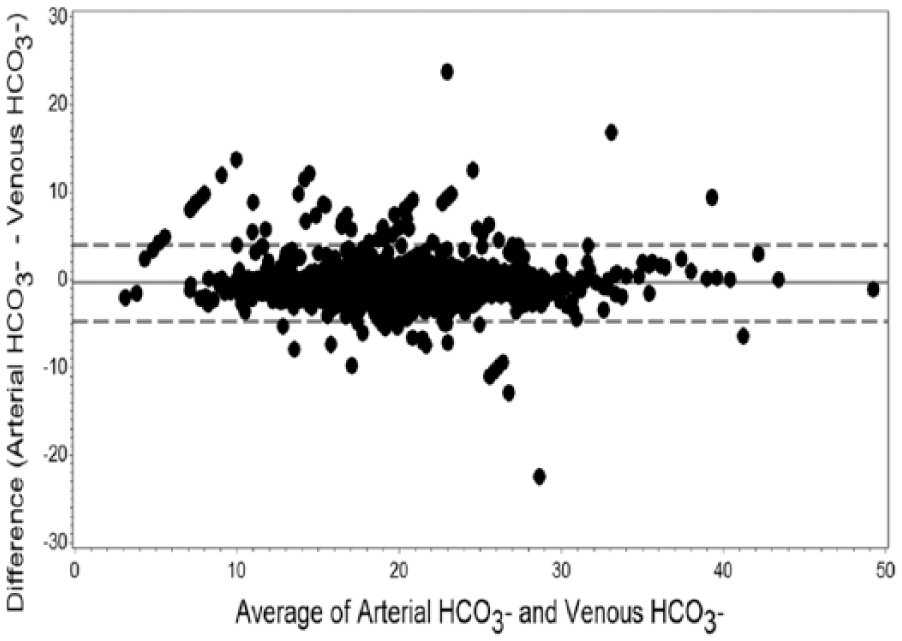
Bland-Altman plot of arterial
Discussion
Pearson correlation versus Bland-Altman plot analysis
Pearson correlations have been used in previous studies when comparing VBG with ABG as a surrogate for agreement. However, this statistical method measures the strength of a relation between 2 variables and estimates the linear correlation rather than agreement.13,20 Pearson correlations are also highly dependent on the range or variation of the variables. 21 Thus, Kelly et al 18 indicated that Pearson correlations are not the clinically relevant measure and instead stated that the accepted method for assessing the agreement between ABG and VBG is the Bland-Altman plot analysis.
Altman and Bland 22 have previously described an alternative method to Pearson correlations when comparing 2 tests with continuous variables. This statistical method quantifies the bias (estimated by the MD) and assesses the agreement regarding the average and individual readings between 2 tests. 13 However, previous surveys20,23–25 have shown that the method described by Bland and Altman 26 is not properly reported or interpreted. Most recently, Chhapola et al 20 showed that only 74% of studies compared the LOA with a priori defined clinical criteria and only 6% reported CIs of LOA. As the 95% LOA is defined as ±1.96 SD of the bias or MD, 26 concluding that 2 tests are in agreement if 95% of the differences lie within the lower and upper LOA is not appropriate. 20 Instead, the width of the LOA should be defined prior to the study and then compared with the obtained 95% LOA.13,20,26 Bland and Altman13,26 suggested defining the limits based on clinical judgment. However, there are published acceptable clinical limits of laboratory analytes 14 that we have used in our study to define our thresholds.
pH
Compared with our predefined threshold, the wide 95% LOA for pH precludes the replacement of ABG by VBG in the general population. This is particularly so for acidemia (pH <7.35) but is also true for pH ⩾7.35. Clinically, these fairly wide LOA in acidemia limit the usefulness of VBG pH to inform a clinician of the arterial acid-base status and may falsely suggest a mildly acidemic arterial pH or even normal arterial pH when the arterial pH may in fact reveal significant acidemia.
The 95% LOA for pH in our study is comparable with those with a diverse population but is wider than studies with specific populations.3,4,7,9–12,19,27 However, none of these studies reported 95% CI of the upper and lower LOA, and many of the studies did not set a threshold a priori to define what would be clinically acceptable. Only 2 of the studies used ±0.05 units as their threshold based on the consensus of 15 attending physicians (trauma surgery, emergency medicine, pulmonary/critical care, anesthesiology) 4 and based on the reported laboratory analytical error. 8 If this threshold for pH is used, most of the studies reviewed would not be able to recommend replacing ABG by VBG. Even if the threshold is wider, such as in our study, depending on the 95% CI of the upper and lower LOA of these studies, replacement of ABG by VBG would probably also not be recommended.
Our MD for pH is lower than the expected difference of 0.05 to 0.06 especially for pH >7.35 but is consistent with previous studies which also found lower MDs.11,27–29
Studies evaluating the sensitivity of VBG pH for ABG pH are rare. McKeever et al 9 had suggested using a venous pH of 7.34 as a cutoff for managing acute exacerbations of chronic obstructive pulmonary disease (COPD) as this pH had a sensitivity of 88.9% and a specificity of 95.6% in identifying an arterial pH ⩾7.35 in their study. We evaluated the sensitivity of VBG to identify ABG acidemia in the general population because we felt that a screening tool should be used to identify possible disease. In our study, the sensitivity of a VBG pH <7.35 identifying an ABG pH <7.35 was 85.0% with a negative predictive value of 81.1% (see Table 3). Thus, based on our predefined threshold, VBG would be an acceptable screening tool for identifying acidemia in the general population. It goes without saying that a VBG should not replace clinical judgment—if the patient is clinically deteriorating or clinical suspicion for acidemia is high, an ABG should be obtained regardless of the VBG result. Moreover, we reiterate that a VBG pH should not be used if exact values are needed given the wide LOA, especially at pH <7.35.
pCO2
Venous blood gas pCO2 has poor agreement for ABG pCO2 as seen by the wide 95% LOA which became wider when we evaluated hypercarbia (pCO2 >45). These findings are similar to previous studies including 2 meta-analyses28,29 which showed poor agreement between ABG and VBG for pCO2. Although there was some overlap regarding the studies that were included in the meta-analyses, we agree that the wide LOA precludes the replacement of measurement of arterial pCO2 with venous pCO2, especially when an accurate measurement of pCO2 is necessary. It should also be noted that similar to our study, the MD for many of the studies included in these meta-analyses was much lower than the expected 5 to 6 mm Hg.28,29
More recently, Zeserson et al 11 found a Pearson correlation of 0.93 for pCO2 and an MD of 4.8 mm Hg with an LOA of 8.05 to −17.82 mm Hg in their study which included an undifferentiated critically ill patient population from the ED and the medical and surgical ICU. Although they suggest that venous and arterial pCO2 correlation allowed for replacement of ABG by VBG for bedside clinical decisions, we cannot agree. Their study emphasized correlation rather than agreement, and they did not include predefined clinically acceptable thresholds for the LOA nor 95% CI for the lower and upper LOA. Our study showed that even for pCO2 ⩽45, the 95% LOA was too wide to allow VBG pCO2 to replace ABG pCO2. Moreover, comparing their obtained 95% LOA with our predefined clinically acceptable threshold shows that there is actually poor agreement between VBG and ABG for pCO2. This suggests that for pCO2, arterial measurement is warranted to guide clinical decision making.
Previous studies3,8,18,19,30 have used venous pCO2 as a screen for potential hypercarbia. These studies found 100% sensitivity of VBG in identifying arterial hypercarbia using different venous cutoffs of 45 mm Hg (patients with COPD and acute respiratory disease)8,18,19 and 50 mm Hg (mechanically ventilated trauma patients). 3 Ibrahim et al 30 found that a venous cutoff of pCO2 ⩾30 mm Hg was 100% sensitive in screening for arterial pCO2 >45 mm Hg, whereas a venous cutoff of pCO2 >45 mm Hg resulted in a sensitivity of 79%. In our study, which included a diverse population, using a venous cutoff of pCO2 >45 mm Hg as a screen was 67.6% sensitive for an arterial pCO2 >45 mm Hg with an 82.8% negative predictive value (see Table 3). Using a venous cutoff of pCO2 >30 mm Hg was 99.8% sensitive for an arterial pCO2 >45 mm Hg (see Table 3), which may be used to rule out hypercarbia. These findings are similar to Ibrahim et al, as our studies included a diverse population. This indicates that a VBG cannot accurately replace an ABG and is unsuitable as a screening tool due to a sensitivity that is less than 80% if used to evaluate the general population for hypercarbia.
HCO3−
The 95% LOA was modestly broad for arterial and venous
Limitations
We did not have documentation of whether a VBG was obtained via centrally or peripherally, which could have an effect on the variability of the VBG values obtained. However, 2 previous studies showed that there was no significant difference between a central and peripheral VBG for pH,12,27 pCO2,
12
and
Although ABG and VBG samples were collected per unit protocol, some of the samples may not have been collected in an anaerobic fashion, specifically using gas syringes. Introduction of air to either the ABG or VBG sample would affect the pCO2 content and pH causing statistically significant differences compared with samples that are not air-contaminated as was shown in a previous study. 32 However, Gambino 33 had showed that collecting VBGs in a heparinized vacutainer versus blood gas syringes did not show significant differences in pH or pCO2. Similarly, Fleisher and Schwartz 34 showed that for ABGs, there was no significant difference for pCO2 between samples obtained from heparinized vacutainers versus blood gas syringes and only a small increase of 0.01 units for pH that was not felt to be clinically significant.
The retrospective de-identified approach precluded subpopulation analysis in our study, and some patients may have had more than 1 paired ABG-VBG samples. In addition, we were unable to correlate blood gas results with specific clinical statuses. Previous literature have noted the effects of temperature status 35 including fever, 36 hematocrit/hemoglobin concentration and metabolic rate, 37 cardiac output and oxygenation status, 38 and the use of drugs, particularly carbonic anhydrase inhibitors 39 on blood gases, but a critical review of these effects is beyond the scope of this article. Furthermore, the aim of our study was to evaluate whether a VBG could replace ABG or be used as a screening tool for acidemia and hypercarbia for the general population regardless of their clinical status.
Conclusions
Venous blood gases cannot reliably replace ABGs due to poor agreement in acidemia and hypercarbia. Venous blood gases can be used as a screening tool for acidemia but are unsuitable for hypercarbia.
Footnotes
Acknowledgements
We want to thank Imran Beig (NorthShore University HealthSystem, Evanston, IL, USA) for assistance in logistical support.
Funding:
The author(s) received no financial support for the research, authorship, and/or publication of this article.
Declaration of Conflicting Interests:
The author(s) declared no potential conflicts of interest with respect to the research, authorship, and/or publication of this article.
Author Contributions
PAC and AS contributed to the acquisition of data, analysis and interpretation of data, drafting of the manuscript, critical revision of the manuscript for important intellectual content, and gave final approval of the version to be submitted. AA contributed to the acquisition of data, analysis and interpretation of data, critical revision of the manuscript for important intellectual content, and gave final approval of the version to be submitted. KK contributed to the analysis of data, drafting the article and revising it critically for important intellectual content, and gave final approval of the version to be submitted. SKB contributed to the conception and design of the study, acquisition of data, analysis and interpretation of data, critical revision of the manuscript for important intellectual content, and gave final approval of the version to be submitted.
Prior Presentation
An abstract based on this work was presented as a poster at the American Thoracic Society International Conference in May 2016, San Francisco, CA, USA.