
Abstract
Objectives
The aim of the study was to determine differences, agreements and correlations of acid–base variables between arterial and venous blood gas in anaesthetised cats in a euvolaemic or hypovolaemic state.
Methods
A group of six cats was used in a prospective randomised crossover haemorrhage–resuscitation study. Anaesthetised cats underwent three treatments at intervals of 2 months. Each treatment had a controlled haemorrhage phase and a resuscitation phase. The haemorrhage phase is the focus of this study. Arterial (carotid artery) and central venous blood were drawn simultaneously from preplaced catheters before haemorrhage (euvolaemic state; mean ± SD blood loss 1.3 ± 0.3 ml/kg for pre-haemorrhage data collection) and soon after controlled haemorrhage (hypovolaemic state; mean ± SD blood loss 15.8 ± 9.9 ml/kg). Acid–base variables from arterial and venous blood were compared under euvolaemic and hypovolaemic states as follows: (1) a paired t-test to determine the differences between the two samples; (2) a Bland–Altman plot to evaluate agreement and establish maximum clinically acceptable differences (defined a priori); and (3) Pearson’s correlation with least squares linear regression to determine the strength of correlation between the variables.
Results
The differences in pH and partial pressure of carbon dioxide were statistically significant under euvolaemic and hypovolaemic states but would not alter clinical decision-making. Agreements were clinically acceptable for all acid–base variables, except for the bias observed in the partial pressure of carbon dioxide under a hypovolaemic state. Correlations for all variables were strong under a euvolaemic state but weakened under a hypovolaemic state.
Conclusions and relevance
Using central venous blood sampling for acid–base analysis was clinically acceptable compared with arterial blood in our haemorrhage–resuscitation cat model during early compensated hypovolaemia. However, the partial pressure of carbon dioxide should be interpreted with caution, especially during hypovolaemia. Further investigation is necessary to determine whether these findings can be translated to critically ill cats.
Introduction
Veterinary emergency and critical care services have grown rapidly over the past decade and a blood gas analyser has become an indispensable tool in managing critically ill cats and dogs. 1 Arterial blood gas analysis (ABG) and venous blood gas analysis (VBG) provide critical information regarding cardiopulmonary function and acid–base status.2 –4 The blood gas analyser measures the pH and blood partial pressures of oxygen (PO2) and carbon dioxide (PCO2), and pre-programmed formulae are used to calculate actual and standard bicarbonate ion (HCO3–) concentrations and base excess of the extracellular fluid (BEecf).4,5
The gold standard of assessing ventilation and oxygenation is through ABG. 5 However, the assessment of acid–base status using ABG has been questioned in human medicine because obtaining an arterial blood sample is not without risk of vascular injury, infection, thrombus formation and pain.5,6 Furthermore, the technical skills required for arteriopuncture are greater compared with those required for obtaining a venous sample. 7
Acid–base status analysis has been an active topic of research in human medicine, comparing ABG with either peripheral or central venous samples in healthy euvolaemic patients and those with a range of illnesses or varied cardiovascular or respiratory derangements.5,8 In human medicine, it has been suggested that central VBG could replace ABG in critically ill patients who are stable and without profound acid–base disturbances. 8 A single study compared ABG with central VBG in euvolaemic anaesthetised dogs with respiratory acidosis. It found clinically acceptable agreement for pH, HCO3– and BEecf, but not for PCO2, which is similar to outcomes observed in human medicine. 5 However, arterial blood sampling in a conscious cat is a challenge, even in cats weighing >4 kg, which makes comparing acid–base status between arterial and venous blood a priority.
The aim of the current study was to determine the differences, agreements and correlations of acid–base variables between ABG and central VBG in anaesthetised cats in euvolaemic and hypovolaemic states. We hypothesised that there would be no differences, good clinical agreements and strong correlations between ABG and central VBG acid–base variables during euvolaemia and hypovolaemia.
Materials and methods
Study design and animals
The data presented in this randomised crossover study form part of a larger haemorrhage–resuscitation project that was approved by the ethics committees of the University of Pretoria (v006-15) and the University of Witwatersrand (2017-10-68-C-AREC). A group of six research colony cats (three males and three females, genetically unrelated) were used in the prospective randomised comparative study. We adhered to the ARRIVE 2.0 reporting guidelines. 9 The cats had a mean ± SD age of 21 ± 1 months and a mean ± SD weight of 4.9 ± 1.2 kg. 10 They were housed in a purpose-built indoor–outdoor cattery and cared for daily by experienced research and laboratory animal technicians at a research facility. The inclusion criteria were that the cats had to be deemed healthy based on a clinical examination and with haematology and biochemistry (urea, creatinine, albumin, lactate and electrolytes) being within normal reference intervals (RIs) for cats. No exclusion criteria were established because the cats were purposefully purchased and reared for this project. A Bland–Altman plot sample size calculation based on reported pH values comparing arterial and central venous blood acid–base status in conscious cats was used, 7 as follows: alpha (type I error) 0.05; beta (type II error) 0.20; expected mean of differences of pH 0.076; expected standard deviation of differences of pH 0.031; and maximum allowed difference of pH between methods 0.2. A minimum sample size of 10 paired samples was required.
Study procedures
Briefly, the larger haemorrhage–resuscitation project involved anaesthetised cats undergoing three different treatments in random order at 2-month intervals. Randomisation was done via a website (www.randomization.com) using a balanced single block design. The cats were transferred from the research facility to Onderstepoort Veterinary Academic Hospital for the study procedures. The anaesthetised cats received treatments in two phases, a controlled haemorrhage phase and a fluid resuscitation phase, as follows: (1) no purposeful haemorrhage and no resuscitation (a sham treatment); (2) controlled haemorrhage followed by an isotonic crystalloid infusion (Ringer-Lactate Solution; Fresenius Kabi) at 60 ml/kg/h; and (3) controlled haemorrhage followed by a synthetic colloid infusion, 6% tetrastarch 130/0.4 suspended in 0.9% saline (Voluven; Fresenius Kabi) at 20 ml/kg/h. The fluids used for resuscitation were administered for 120 mins. The controlled haemorrhage involved manually aspirating blood into a semi-closed collection system using 20 ml plastic syringes primed with 4 ml of citrate-phosphate-dextrose (JMS blood bag, 450 ml; JMS Singapore) at a targeted rate of 2 ml/kg/min until the first of two endpoints was reached. The endpoint was either a maximum blood withdrawal of 30 ml/kg or a mean arterial blood pressure of <48 mmHg that persisted for at least 3 mins (blood draw was paused and if the mean arterial pressure returned to >48 mmHg during the 3 mins, blood draw was continued). The anaesthetic protocol was standardised whereby 0.02 mg/kg of buprenorphine (Temgesic; Reckitt Benckiser Healthcare) was administered intramuscularly, and 45 mins later, an over-the-needle catheter was placed into one of the cephalic veins. Then, anaesthesia was induced with alfaxalone (Alfaxan; Jurox) administered intravenously until the trachea could be intubated. The anaesthetic was maintained using isoflurane (Isofor; Safeline Pharmaceuticals) in oxygen delivered by a paediatric rebreathing circuit (15 mm internal diameter; Compact Paediatric Breathing System; Intersurgical). The cats were allowed to breathe spontaneously for the duration of anaesthesia and no intermittent positive-pressure ventilation was permitted. The hair on the ventral neck was shaved and aseptically prepared before inserting a 22 G, 50 mm catheter (Arrow Arterial Catheterisation Set; Arrow International) into the left jugular vein (percutaneously) and right carotid artery (cut-down technique), both using the Seldinger technique. The insertion point of the catheter into the external jugular vein was approximately 1.5 cm from the cranial margin of the first rib (thoracic inlet). Once the haemorrhage phase was complete, the resuscitation phase began. The interval between the haemorrhage phase and the resuscitation phase was 5 mins. The cats were hypotensive for at least 8–10 mins before blood samples were collected. Once the resuscitation phase was complete, the cats were administered subcutaneous meloxicam 0.2 mg/kg (PetCam; CiplaVet) and intravenous buprenorphine 0.03 mg/kg before being allowed to recover from the anaesthesia in the intensive care unit for 24 h before returning to the colony. Data and methods not related to this study but from the larger haemorrhage–resuscitation project are reported elsewhere; the focus of this study is the haemorrhage phase only.11 –14 All cats were rehomed via an adoption process 1 month after concluding the project.
Data collection
Blood and physiological data were collected at predefined time points during the treatment (physiological data: invasively measured systolic, mean and diastolic arterial blood pressure from the carotid artery, respiratory rate and end-tidal carbon dioxide [PE′CO2] measured using capnography, heart rate measured using an electrocardiogram, oesophageal temperature and blood oxygen saturation [SpO2] measured using pulse oximetry). The pre-haemorrhage (n = 18 paired samples) and post-haemorrhage phase (n = 18 paired samples) arterial and central venous blood collections are relevant to this study. During sampling, venous and arterial blood was simultaneously drawn into lithium-heparinised syringes (BD A-line; Becton Dickinson) and analysed within 10 mins using a daily-calibrated benchtop blood gas analyser (Rapidlab 500 System; Siemens). The blood gas analyser measured the pH using a potentiometric method using standard ion-selective electrode technology. The PCO2 was measured using a modified potentiometric method based on the principles of the Severinghaus electrode. The actual and standard bicarbonate ion concentrations (Act HCO3– and Std HCO3–, respectively), BEecf and total carbon dioxide content (TCO2) were calculated using standard equations provided by the Clinical Laboratory Standards Institute C46-A2 (Rapidlab 500 Operator’s Manual; Siemens). All acid–base variables were interpreted at a fixed temperature of 37°C. The venous-to-arterial carbon dioxide gap [P(v-a)CO2 gap] was calculated by subtracting the arterial PCO2 from the central venous PCO2 for both volume states.
Data analysis
The distribution of the data of the acid–base variables was evaluated by inspecting histograms, descriptive statistics and using the Anderson–Darling test for normality. Data were normally distributed and reported as means (95% confidence intervals [CIs]). The differences between the arterial and central venous variables were assessed using a paired t-test for the euvolaemic and hypovolaemic states, respectively. Effect size was determined by calculating Cohen’s d for each comparison. The difference between each variable within arterial and central venous blood was then compared between the euvolaemic and hypovolaemic states, respectively, using the same analysis. The differences between haemorrhage volume, physiological variables and P(v-a)CO2 gap were compared using a paired t-test. The agreement (bias defined as the mean difference between the variables, and limits of agreement [LoA], defined as precision) between arterial and central venous variables within euvolaemic and hypovolaemic states, respectively, were assessed using Bland–Altman plots. Maximum clinically acceptable differences were defined by one of the authors (GEZ) a priori for each variable, as follows: pH (±0.1), PCO2 (±5 mmHg), Act HCO3– and Std HCO3– (±2.0 mmol/l), BEecf (±2.0 mmol/l) and TCO2 (±1.0 mmol/l). 15 The Pearson’s correlation coefficient (r) and coefficient of determination (r2) were calculated using least squares regression analysis. Commercially available software was used for the statistical analysis (MedCalc Statistical Software version 19.5; MedCalc Software) and P <0.05 was considered statistically significant.
Results
The haemorrhage phase in the sham treatment lasted 15.2 ± 0.8 mins and was not different (P = 0.137) from the controlled haemorrhage times of the lactated Ringer’s solution (17.5 ± 2.3 mins) or tetrastarch 130/0.4 (18.6 ± 4.4 mins) treatment. In treatments with a controlled haemorrhage phase, the maximum blood draw volume endpoint was applied four times and the mean arterial blood pressure endpoint was applied eight times. The total volume of blood loss in the euvolaemic and hypovolaemic states and measured physiological variables are presented in Table 1.
Haemorrhage volume, physiological variables and venous-to-arterial carbon dioxide gap from simultaneously collected arterial and central venous blood in six anaesthetised adult cats under euvolaemic (before haemorrhage) and hypovolaemic (after haemorrhage) states

Data are mean ± SD (range)
PE′CO2 = end-tidal carbon dioxide; P(v-a)CO2 gap = venous-to-arterial carbon dioxide gap; SpO2 = blood oxygen saturation
The pH and PCO2 were significantly different between arterial and central venous blood, regardless of the volume status (Table 2). In euvolaemic cats, the effect sizes for pH and PCO2 were both moderate, whereas in hypovolaemic cats the effect size was large for both variables. There were no differences in Act HCO3– and Std HCO3–, BEecf and TCO2, regardless of the volume status. Within arterial blood, pH, PCO2, Act HCO3–, TCO2 and BEecf were significantly different between the euvolaemic and hypovolaemic states. Within venous blood, only Std HCO3– was significantly different between the euvolaemic and hypovolaemic states.
Acid–base variables from simultaneously collected arterial and central venous blood in six anaesthetised adult cats under normovolaemic (before haemorrhage) and hypovolaemic (after haemorrhage) states

Data are mean (95% CI) unless otherwise indicated
Act HCO3– = actual bicarbonate; BEecf = base excess in extracellular fluid; PCO2 = partial pressure of carbon dioxide; Std HCO3– = standard bicarbonate; TCO2 = total carbon dioxide content
The pH, Std HCO3– and BEecf had a small positive bias, indicating that the arterial blood had higher values compared with the central venous blood when the cats were euvolaemic (Table 3 and Figure 1). On the other hand, PCO2, Act HCO3– and TCO2 demonstrated a negative bias but remained within maximum clinically acceptable differences. The predefined maximum acceptable differences were violated by the LoAs of all variables apart from pH when the cats were euvolaemic. The magnitude of bias of pH, PCO2 and BEecf increased substantially when the cats were in a hypovolaemic state compared with their euvolaemic state, whereas Act HCO3–, Std HCO3– and TCO2 appeared similar, regardless of volume status. The predefined maximum acceptable differences were profoundly violated by LoAs and bias (only PCO2) for all variables.

Bland–Altman plots indicating the agreement between acid–base variables measured or calculated from arterial blood compared with central venous blood in six anaesthetised cats undergoing three treatments in a haemorrhage–resuscitation study. Blood was collated before haemorrhage (euvolaemic state; left column) and after controlled haemorrhage (hypovolaemic state; right column) (continued)
Results of Bland–Altman plots of agreement between arterial and central venous blood gas in six anaesthetised adult cats under euvolaemic (before haemorrhage) and hypovolaemic (after haemorrhage) states
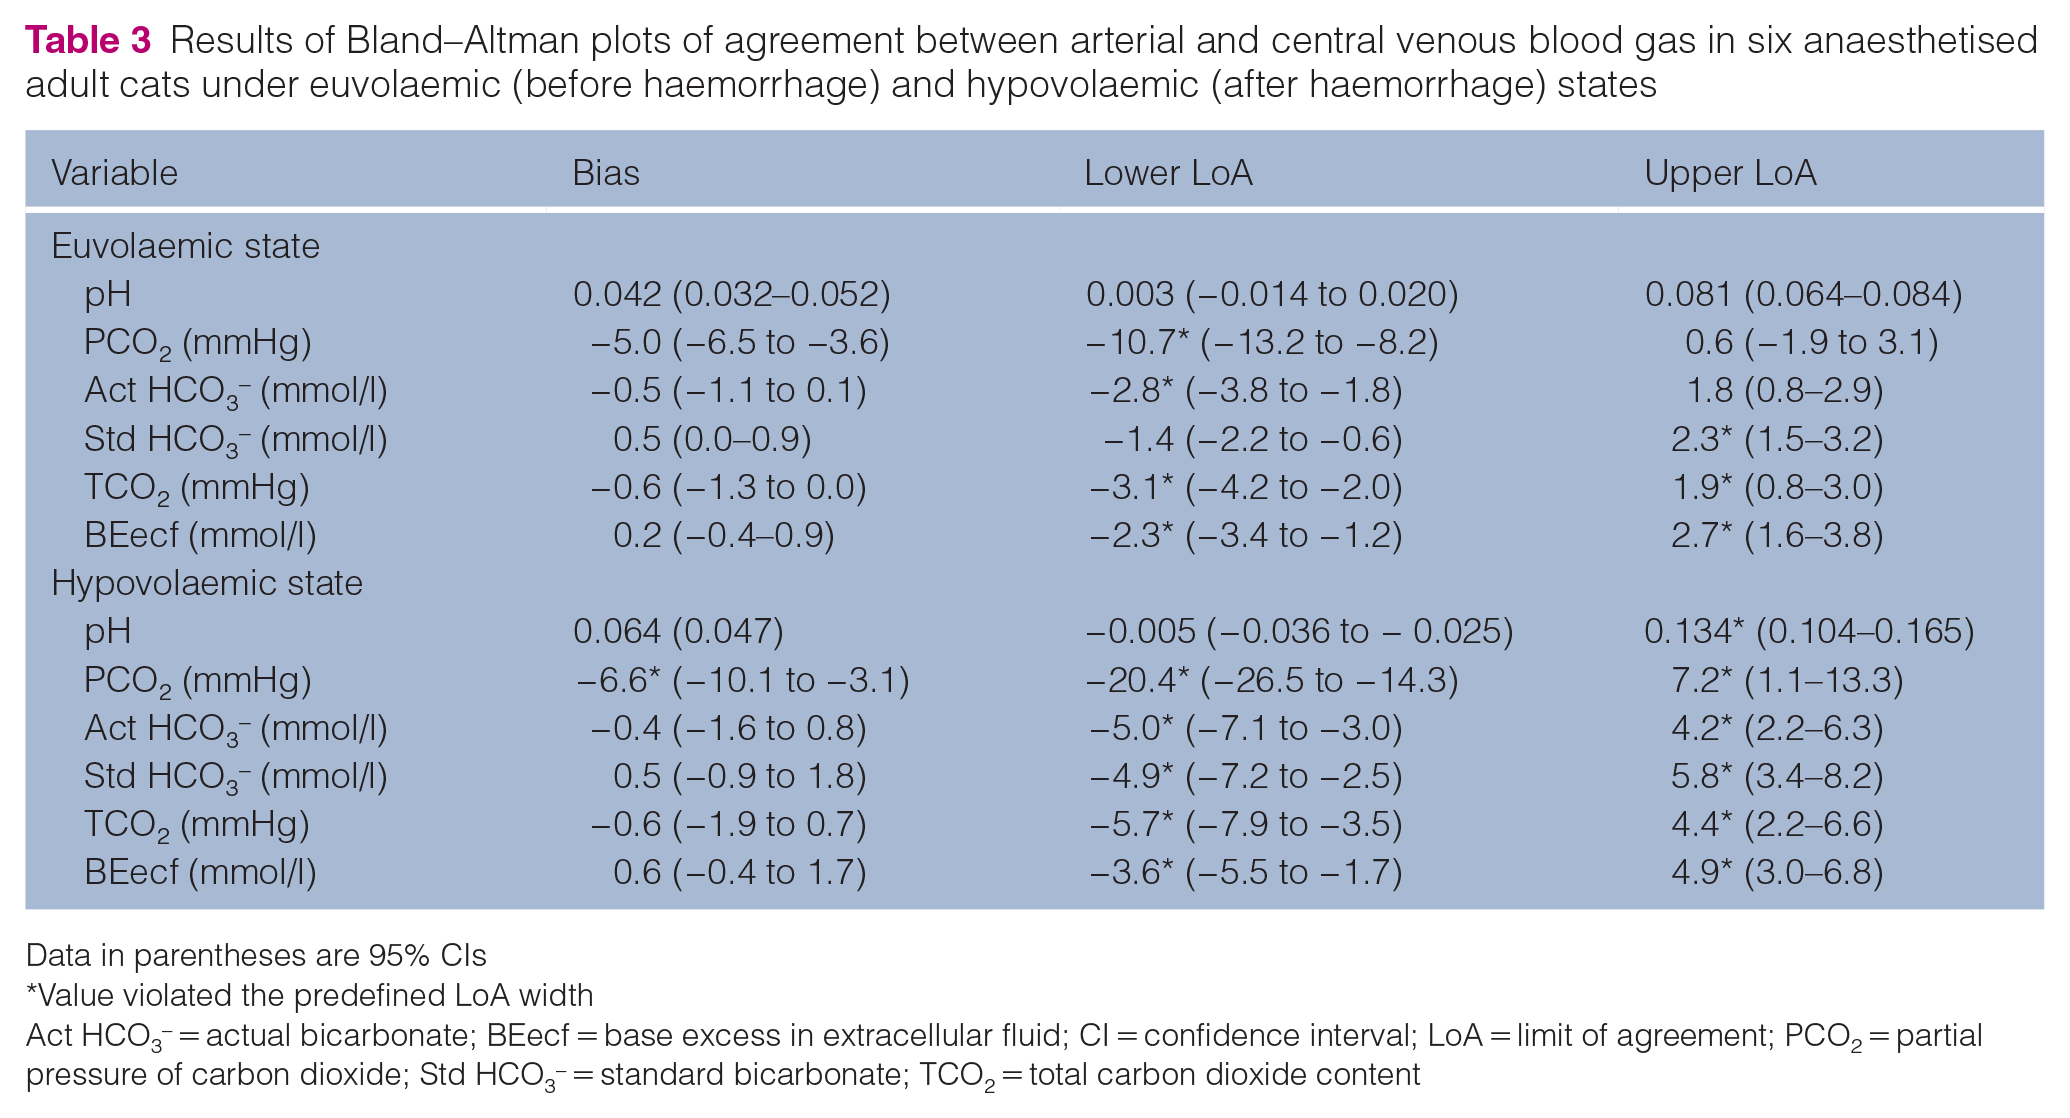
Data in parentheses are 95% CIs
Value violated the predefined LoA width
Act HCO3– = actual bicarbonate; BEecf = base excess in extracellular fluid; CI = confidence interval; LoA = limit of agreement; PCO2 = partial pressure of carbon dioxide; Std HCO3– = standard bicarbonate; TCO2 = total carbon dioxide content
There was a trend of weaker correlations between arterial and central venous blood during hypovolaemic states compared with euvolaemic states (Table 4 and Figure 2). The pH, PCO2, Std HCO3– and BEecf demonstrated very strong positive correlations between arterial and central venous blood for cats in a euvolaemic state, whereas Act HCO3– and TCO2 demonstrated strong positive correlations. During hypovolaemic states, pH maintained a very strong positive correlation. The PCO2 and BEecf had strong positive correlations, Act HCO3– and TCO2 had moderate positive correlations, and Std HCO3– had a weak positive correlation.
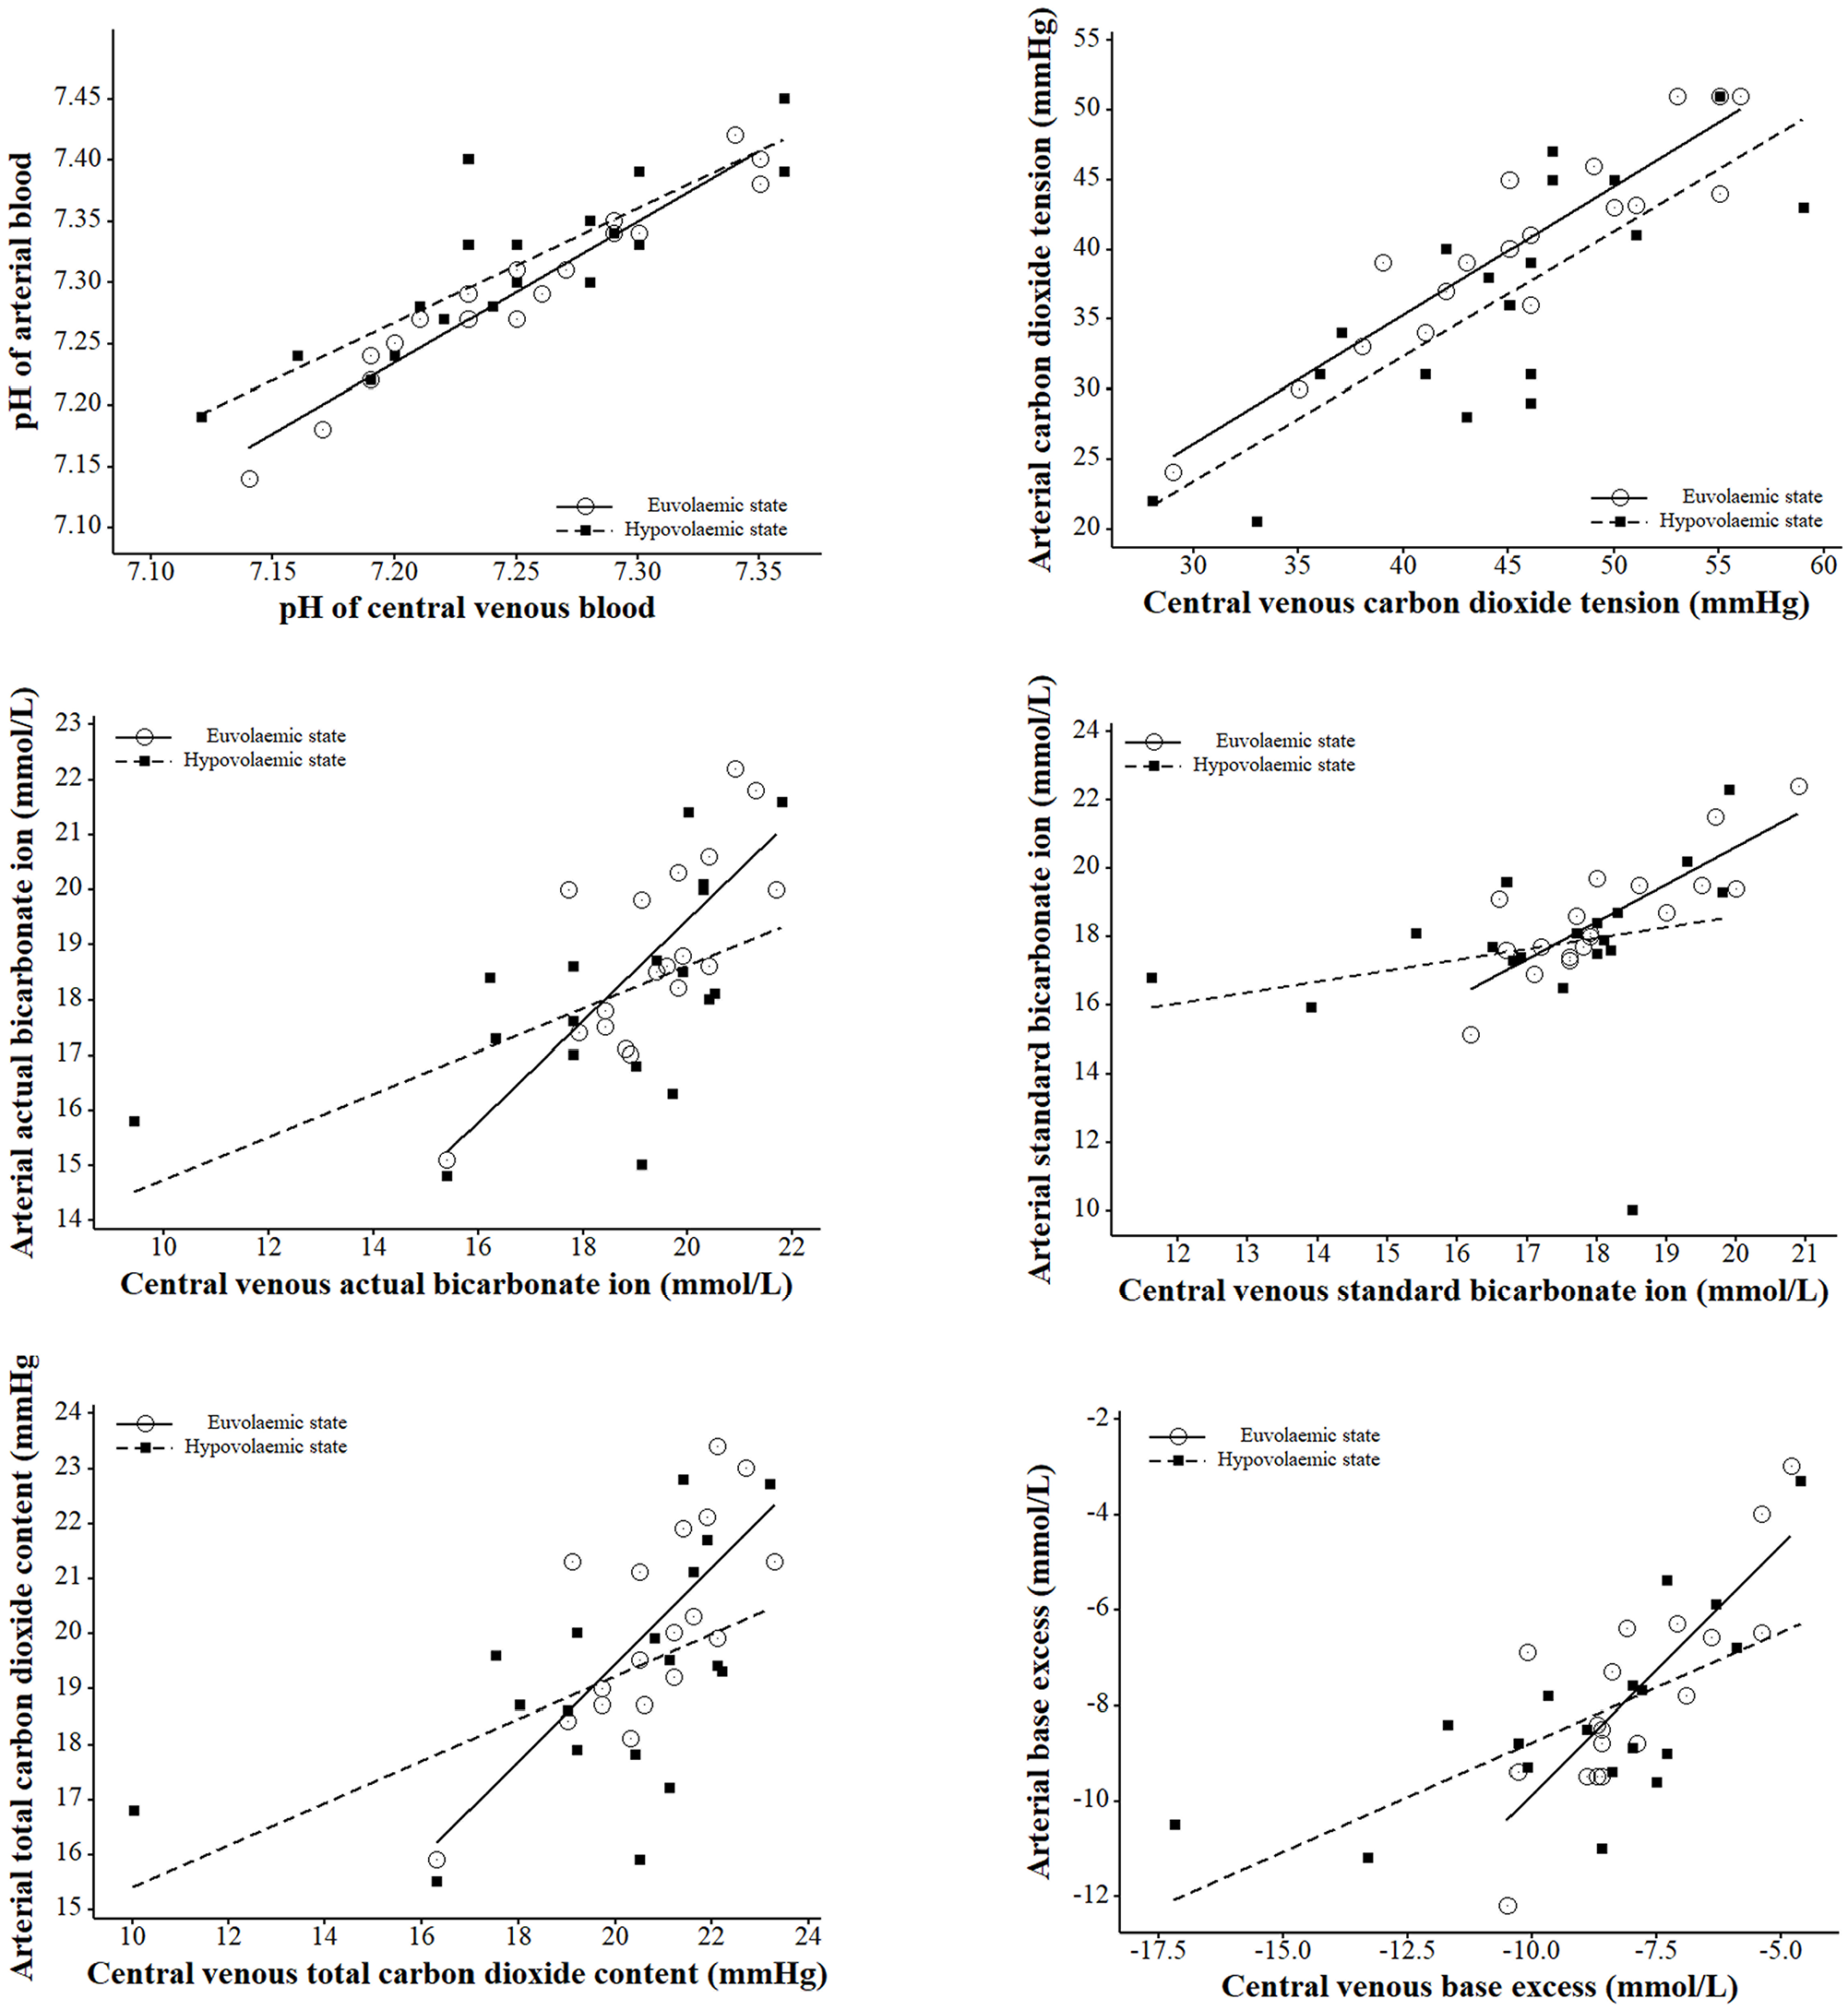
Scatter plots with regression lines indicating the relationship between acid–base variables measured or calculated from arterial blood compared with central venous blood in six anaesthetised cats undergoing three treatments in a haemorrhage–resuscitation study. Blood was collected before haemorrhage (euvolaemic state; circles with solid black line) and after controlled haemorrhage (hypovolaemic state; squares with black dotted line)
Correlation between arterial and venous blood gas in six anaesthetised adult cats under euvolaemic (before haemorrhage) and hypovolaemic (after haemorrhage) states

Data in parentheses are 95% CIs
Act HCO3– = actual bicarbonate; BEecf = base excess in extracellular fluid; CI = confidence interval; LoA = limit of agreement; PCO2 = partial pressure of carbon dioxide; Std HCO3– = standard bicarbonate; TCO2 = total carbon dioxide content
Discussion
This study found statistical differences in measured, but not calculated, acid–base variables between arterial and central venous blood; however, these would not have necessarily led to a change in clinical management. The agreement, based on bias, between the acid–base variables was clinically acceptable during the euvolaemic state. Under the hypovolaemic state, the biases were mostly similar, except for PCO2, but the precision was worse for all variables. Similarly, correlations were very strong during euvolaemia but worsened during hypovolaemia.
The pH and PCO2 were different between arterial and central venous blood in the euvolaemic state, and these differences were larger during the hypovolaemic state. The pH was different owing to the contribution of PCO2 to the Henderson–Hasselbalch equation. 16 Briefly, plasma pH is equivalent to the sum of the pKa of carbonic acid (pKa = 6.1) and the log of the bicarbonate ion concentration ([HCO3–]) divided by the carbonic acid concentration ([H2CO3]) (pH = pKa + log([HCO3–]/[H2CO3]). The carbonic acid dissociates into water and CO2 and can be replaced by the product of the solubility coefficient of CO2 in human plasma (0.03 mmol/l) and PCO2. At a pH of 7.4, the ratio of [HCO3–] to [0.03 mmol/l × PCO2] is 20:1. 16 The venous blood had a consistently higher PCO2 compared with arterial blood and a similar HCO3–; hence, the ratio was lower, causing the lower pH. In both states, regardless of blood sample, anaesthetised cats had a mild respiratory acidosis of negligible clinical concern. 14 Respiratory acidosis is common in spontaneously breathing anaesthetised animals and has been better described in dogs 5 compared with cats.
The P(v-a)CO2 gap has been described and proposed as a measure of hypovolaemia. 17 During health, venous blood typically has a higher PCO2 because CO2 is a byproduct of cellular metabolism, with a normal gap of <5 mmHg. 18 In our cats, the PCO2 gap widened during the hypovolaemic state, which has been reported in humans with a low blood flow state, such as during hypovolaemia. 17 However, the opposite has also been reported in humans with hypotension 19 and during hypovolaemic shock. 20 We speculate that these conflicting reports are due to differences in the timing of blood sampling during the time course of cardiovascular compromise and resuscitation. Our samples were taken within 5 mins after haemorrhage and before any resuscitation or compensatory fluid shifts occurred. The arterial PCO2 was statistically significantly lower during the hypovolaemic state compared with the euvolaemic state. We speculate that this difference was because of a baroreceptor-mediated response to hypotension that increased sympathetic tone with a concomitant increase in cardiac output and minute ventilation, as reported elsewhere. 12 Another possible cause of the differences is variability of the blood gas analyser machine. 21 However, all our venous variables were within expected RIs of conscious cats determined using the same blood gas analyser. 22
Maximum clinically acceptable differences for the Bland–Altman analysis were derived by an experienced diplomate in anaesthesiology and emergency and critical care medicine (GEZ) and were based on published RIs and clinical experience in anaesthetised cats.22,23 The biases for almost all variables in our cats, with the exception of PCO2 during a hypovolaemic state, were within maximum acceptable differences. These outcomes agree with reports in hypotensive or hypovolaemic human patients, where there is acceptable agreement between arterial and central or peripheral venous acid–base analyses.19,20 In many instances, these authors regarded interpretation of acid–base status on a venous blood sample as being clinically acceptable.8,19,20,23 We offer a similar recommendation: central venous blood samples can be used to interpret acid–base status during euvolaemic and hypovolaemic states in anaesthetised cats. However, others have reported opposing conclusions; the PCO2 difference of the means in conscious euvolaemic cats was 11 mmHg, which far exceeds our predefined maximum difference. 7 However, this previously reported bias needs to be interpreted with the knowledge that the data were derived from five paired samples from five cats. 7
A correlation analysis between arterial and venous blood has also been used to describe the relationship of acid–base variables between arterial and venous blood samples in hypovolaemic states in human medicine. 19 However, it is important to point out that correlation statistics determine a relationship between two variables and not the difference between them. 15 As in our study, Bland–Altman plots with predefined maximum differences should be used to determine whether the acid–base variables derived from arterial or venous blood can be used interchangeably for clinical interpretation, and not evaluating correlations. 15 In human critical care medicine, pH and PCO2 appear to be the variables that change rapidly during the time course of hypovolaemia and resuscitation, similar to our cats. 24 Based on correlations, using venous blood instead of arterial blood is clinically acceptable to determine a patient’s acid–base status during euvolaemia and hypovolaemia.6,8 A caveat to this recommendation is that the strength of correlation decreased during hypovolaemic states in our cats.
There were notable limitations to our study. A small sample size was used, and thus only large differences and effects could be determined with confidence. However, we used 18 paired blood samples, which was more than the minimum sample size that was calculated, increasing our power and lowering the chance of a type II error occurring. The study used healthy anaesthetised cats undergoing controlled procedures and we cannot comment on whether these findings will be true in conscious cats or those that have undergone haemorrhage-induced hypovolaemia because of disease- or trauma-related processes. However, our acid–base variables were within the RIs for cats,22,23 and we speculate that, as in human studies,8,19,20,24 central venous blood samples can be used interchangeably with arterial blood samples for acid–base analysis in clinical practice despite our cats being anaesthetised and undergoing controlled atraumatic haemorrhage. Another consideration is that the variables in the hypovolaemic state were obtained within 10 mins after reaching an endpoint of controlled haemorrhage; thus, these outcomes need to be interpreted during an early compensatory phase of haemorrhage-induced hypovolaemia and hypotension. We speculate that, as in human medicine, 8 central VBGs cannot be used in unstable, uncompensated hypovolaemic cats or those with profound acid–base disturbances. The catheter placed into the external jugular vein was inserted as close to the thoracic inlet as possible, with the assumption that the distal tip would be within the cranial vena cava. However, no measurements or procedures were carried out to verify that the tip of the catheter was in a major intrathoracic vein. A final consideration is a caveat to the volumes of fluid used during the resuscitation phase (not reported here) of the larger fluid research project, where an aim was to investigate how fluid sensitive cats are and if they can manage fluid overload. 11 We cannot recommend the use of these volumes of fluids during clinical resuscitation. In cats undergoing severe intraoperative haemorrhage (>30 ml/kg blood loss), we recommend an initial bolus of 30 ml/kg of lactated Ringer’s solution or 10 ml/kg of tetrastarch 130/0.4.
Conclusions
In anaesthetised healthy cats, central VBG can be used for acid–base determination in both euvolaemic and early compensated hypovolaemic states; however, caution is advised when interpreting PCO2, especially in the early stages of hypovolaemia. Further studies should be conducted in cats with various disease states to establish relationships between easily obtained central or peripheral venous blood and arterial blood acid–base variables.
Footnotes
Acknowledgements
The authors would like to thank the staff members of the UPBRC that assisted in the PhD research project.
Conflict of interest
The authors declared no potential conflicts of interest with respect to the research, authorship, and/or publication of this article.
Funding
The authors thank the following for their financial contributions: South African Veterinary Foundation, Health and Welfare Sector Education and Training Authority (HWSETA) Fund, University of Pretoria Research Development Program, South African National Research Foundation.
Ethical approval
The work described in this manuscript involved the use of experimental animals and the study therefore had prior ethical approval from an established (or ad hoc) committee as stated in the manuscript.
Informed consent
Informed consent (verbal or written) was obtained from the owner or legal custodian of all animal(s) described in this work (experimental or non-experimental animals, including cadavers, tissues and samples) for all procedure(s) undertaken (prospective or retrospective studies). No animals or people are identifiable within this publication, and therefore additional informed consent for publication was not required.