
Abstract
Background:
Gut microbiota are associated with the pathological features and development of colorectal cancer (CRC); however, how gut microbiota changes in patients with CRC is unknown. This study investigated the role of gut microbiota in the development and progression of CRC by retrospectively comparing the structural differences between the gut microbiota of patients with CRC and healthy individuals.
Methods:
Together with clinical data, we collected fecal samples from patients with CRC (n = 18) and healthy controls (n = 18) and performed 16S rRNA gene sequencing and alpha and beta diversity analysis to compare microbiota richness and diversity. Based on the differences in microbiota between the CRC and control groups, we identified disease-specific microbial communities after relevant factors. PICRUSt2 software was used to predict the differential microbial functions.
Results:
The CRC and control groups differed in both composition and abundance of intestinal microbiota. Firmicutes and Bacteroidetes were the most abundant phyla in both groups, while Verrucomicrobi was significantly more abundant in the CRC group. Megamonas, Lachnospira, and Romboutsia were more abundant in the control group; 18 genera differed significantly in abundance between the groups, which were found to involve 21 metabolic pathways. The distribution and abundance of gut microbiota differed significantly between patients with CRC with and without lymph node metastasis; at the genus level, the abundance of Rothia and Streptococcus was significantly higher and that of Bacteroides, Parabacteroides, and Oscillibacter was significantly lower in patients with lymph node metastasis.
Conclusions:
The gut microbiota is altered in CRC patients compared with healthy individuals, with specific changes in the microbiota associated with clinical and pathological features such as tumor stage, lymph node involvement, and tumor differentiation. Our findings elaborate to some extent on the link between the gut microbiota and CRC.
Introduction
Colorectal cancer (CRC) was rarely diagnosed a few decades ago but now accounts for 10% of all cancer cases (approximately 1 931 590 new cases), ranking third in incidence, and 9.4% of deaths from CRC worldwide (935 173 deaths), ranking second in mortality. 1 By 2040, there will likely be 3.2 million new CRC diagnoses worldwide, despite a slow improvement in screening and awareness of the disease. 2 The American Cancer Society considers this impending increase an urgent public health crisis, especially in developing countries. 3 The incidence of CRC is the highest in highly developed countries due to the aging population and various risk factors, such as smoking, obesity, a sedentary lifestyle, and unhealthy dietary habits, and is increasing in developing countries. Notably, the incidence of early-onset CRC (usually diagnosed at <50 years of age) has increased at an alarming rate worldwide over the past few decades.2,4
This trend in the younger population and the continued burden on the overall population is worrisome; although early screening significantly improves survival outcomes, most patients with CRC already have advanced disease at the time of diagnosis. Therefore, new strategies for the early detection and prevention of cancer are crucial. With the advent of next-generation sequencing technologies, the link between the gut microbiota and its associated diseases has become a focus of research. It has been shown that the balance of the intestinal microbiota and the metabolites produced during bacterial fermentation in the host play an important role in regulating the development of intestinal diseases and CRC.5,6
The human gut is colonized by trillions of microbes, including bacteria, archaea, fungi, protozoa, viruses, and, predominantly, bacteria. 7 Microbiota community structure is influenced by age, lifestyle, diet/nutrition, environmental factors, host hormonal changes, underlying disease conditions, and host genetics. 8 Macrogenomic analyses suggest that each individual may contain approximately 160 out of the nearly 1000 to 1150 different bacterial species prevalent in the human gut microbiota. 9 The intestinal bacteria are considered the “invisible organs” of the body, 10 they are involved in various biological processes, such as metabolizing indigestible carbohydrates in food, synthesizing vitamins and other nutrients, regulating immune responses, and maintaining intestinal barrier function.11-13 Although the gut microbiota has long been considered commensal, current evidence suggests that it may contribute to precancerous lesions in CRC. 14 Intestinal microbiota dysbiosis has been associated with inflammation, immune disorders, infectious diseases, and malignancies15,16; however, its role in CRC remains largely unclear. Various studies have suggested that oral or fecal microbiota profiles may serve as potential biomarkers for CRC.17-20
In this study, we analyzed and compared the gut microbiota composition of healthy individuals and patients with CRC using 16S ribosomal RNA (rRNA) sequencing. Our aim was to identify key gut microbiota associated with the development of CRC and to provide baseline data to support the potential use of gut microbiome analysis in clinical diagnosis and treatment. Furthermore, our findings may inform the development of new methods for prediagnosing and early treatment in CRC.
Materials and Methods
Research design
A total of 36 fecal samples from the Gastrointestinal Surgery Sample Bank of Northern Jiangsu People’s Hospital, collected between January 2022 and January 2023, were retrospectively included in the study. The inclusion criteria were as follows: CRC confirmed by electron colonoscopy and pathology, or no obvious lesions found by electron colonoscopy. The exclusion criteria were as follows: previous history of major gastrointestinal surgery or preoperative neoadjuvant therapy; history of antibiotic or probiotic application in the 4 weeks prior to surgery; preoperative combination of serious infections.
Demographic and clinical phenotype
Demographic information collected included age, gender, body mass index (BMI), smoking history, alcohol consumption history, long-term diseases (hypertension and type II diabetes mellitus), as well as tumor site and postoperative pathology.
Statistical analysis
Statistical analyses were performed using SPSS (v22.0, IBM SPSS, Chicago, IL, USA). Continuous variables (age and BMI) are expressed as mean ± standard deviation and categorical variables as frequencies and percentages. Chi-square and Fisher’s exact tests were used to analyze categorical variables, while Student’s t- and the Mann-Whitney U tests were used to analyze continuous variables. The Wilcoxon test was used to analyze discrete categorical variables. Differences between groups were assessed using 1-way analysis of variance. All tests were 2-sided, and P < .05 was considered significant.
Results
Clinical characteristics at baseline
A total of 36 fecal samples were collected, including 18 samples from the CRC group (cases) and 18 from healthy individuals (normal). The information for each group is shown in Table 1. There were no differences in clinical or demographic characteristics between groups (P > .05).
Demographic characteristics of the participants.
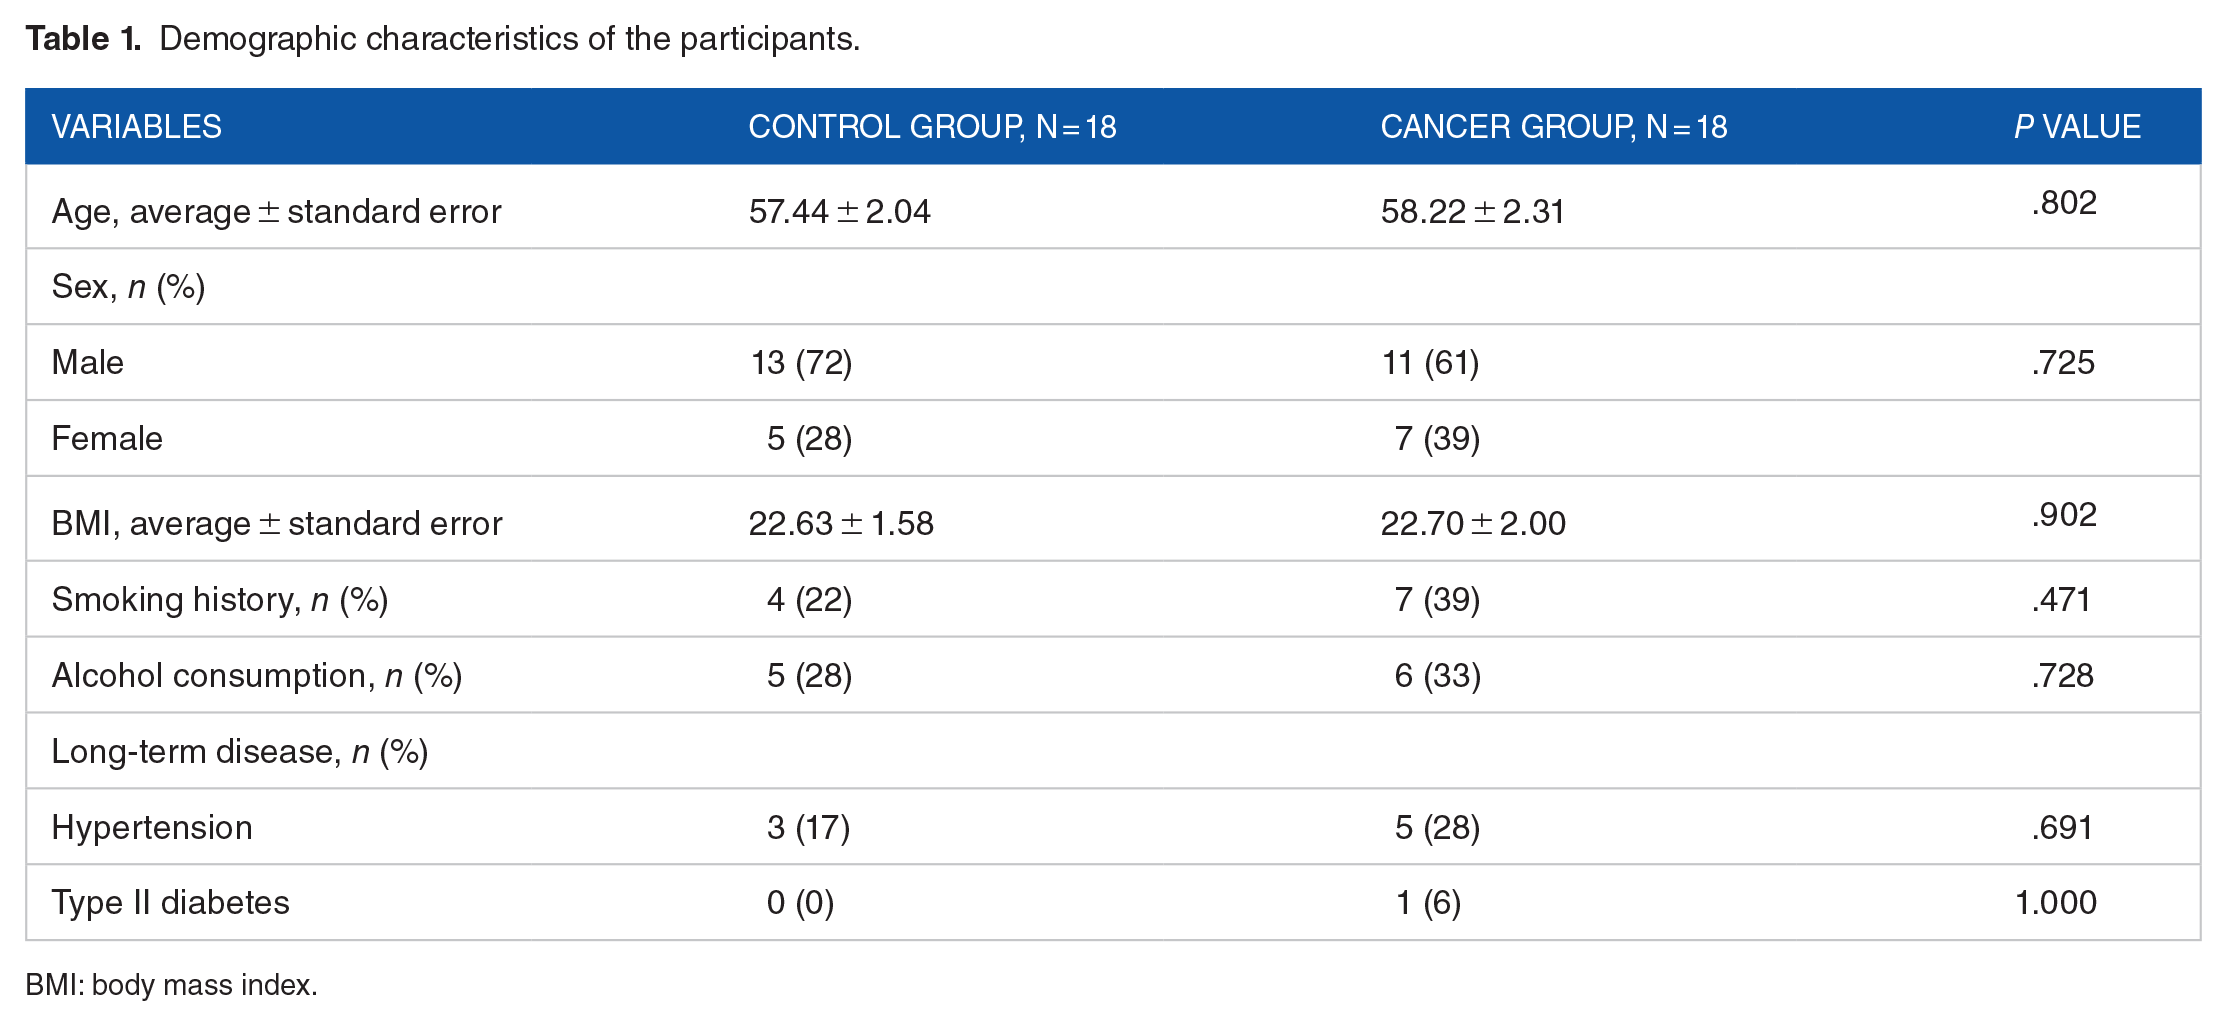
BMI: body mass index.
Analyzing differing bacterial flora
We filtered 1 311 998 reads from the 36 samples and obtained a total of 3694 sequence features. There were 1680 and 1367 unique features in the Control and cancer groups, respectively, and 647 shared features (Figure 1A). In the cancer group, 198 features were shared among subgroups in terms of sex, tumor site, depth of tumor infiltration, and the presence of lymph node metastasis (Figure 1B).

(A) Venn diagram comparing the distribution of features in the healthy control group (Ctrl) and the colorectal cancer group (Cancer); (B) Petal diagram comparing the distribution of features among subgroups in the colorectal cancer group. (C) Observed species.
The rarefaction curve of the alpha diversity index (observed species) presents a plateau (Figure 1C), indicating sufficient sequencing depth and that most species in the sample were detected, thus promoting the reliability of our study.
The hierarchical plot (Figure 2) shows 2 aspects of species diversity, species abundance, and species evenness. The curve of the cancer group was narrower and steeper than that of the Control group, indicating reduced species richness and lower species evenness, respectively.
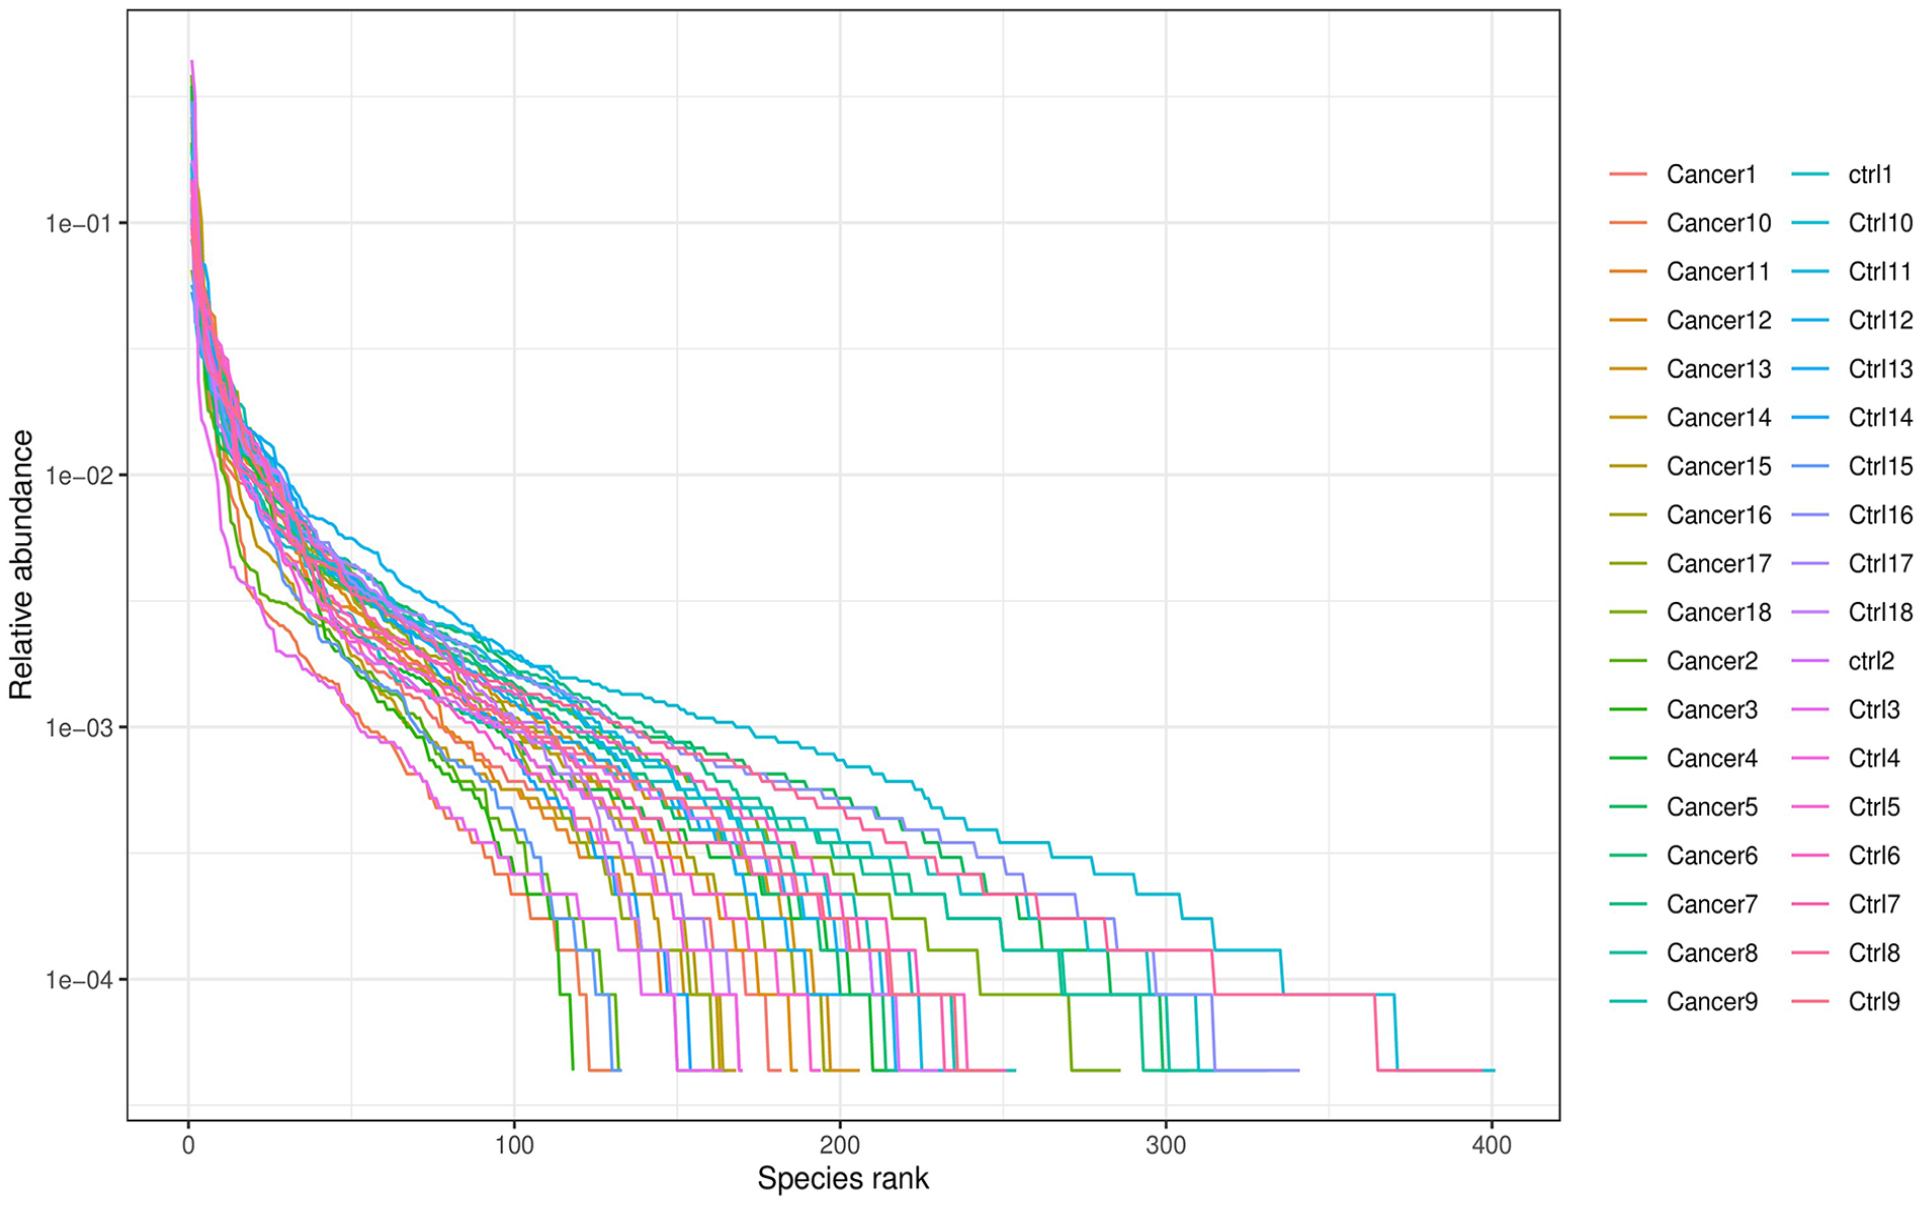
Species rank curve.
Circos (Figure 3A) and species abundance histograms (Figure 3C) show the main composition of gut microbiota at the phylum level. The Wilcoxon test was used to analyze the differences in abundance between groups for normally and non-normally distributed data. The 5 most abundant phyla in the Cancer and Control group were Firmicutes (54.00% vs 61.69%, P = .24), Bacteroidetes (25.11% vs 27.14%, P = .95), Proteobacteria (10.55% vs 5.96%, P = .43, Actinobacteria (7.16% vs 4.79%, P = .33), and Fusobacteria (1.98% vs 0.29%, P = .24). The abundance of Firmicutes and Bacteroidetes was lower and that of Proteobacteria, Actinobacteria, and Fusobacteria in the cancer group compared to the Control group, although these differences were not statistically significant. However, Verrucomicrobia was significantly more abundant in the cancer group than in the Control group (1.17% vs 0.04%, P = .05).

(A, B) Composition and relative abundance of main microbe phyla and genera in CRC (Cancer group) and healthy control group (Ctrl group). (C, D) Relative abundances of microbes between samples at the phylum and genus levels. Each bar represents a single tumor and each colored box a bacterial taxon. The height of a colored box corresponds with relative abundance. “Other” represents lower-abundance taxa. (E) Sample clustering analysis. Left, Bray-Curtis distance clustering tree; the closer the samples and shorter the branches, the more similar is the species composition. Right, relative abundance distribution of phyla for each sample, with a larger proportion indicating higher abundance. (F) Subgroup analysis. The abundance in each subgroup is the average of all the biological replicates within that group. Different colors indicate different species. The lowest color block of the bar indicates the most abundant microbes, representing the sum of abundance in all the samples. (G) Bar graph differential analysis. Differences in abundance among genera. (H) Heatmap of genera. The relative abundance of microorganisms in different samples; deep red and blue indicate high and low abundance, respectively.
At the genus level (Figure 3B and D), Bacteroides and Faecalibacterium were the most abundant in the Cancer (11.92%) and Control group (14.21%), respectively. We performed a cluster analysis to study the differences between the samples in more detail according to the species composition distances of the genera (Figure 3E). The Wilcoxon test was used to analyze the differences in abundance between the 2 groups for normally and nonnormally distributed data. Escherichia-Shigella, Faecalibacterium, and Agathobacter were differentially abundant between the 2 groups, the difference was not statistically significant (Table 2, Figure 3F). Based on the false discovery rate (FDR), we screened the genera potentially responsible for the differences in gut microbiota composition (Table 3, Figure 3G). The top 30 genera in terms of abundance were selected and the samples and species were clustered according to the abundance information. We computed heat maps to analyze the differences between groups (Figure 3H).
Relative abundance of gut microbial communities at the genus level.

Bacterial abundance at genus level.

P < .05 indicates a significant difference.
Relationship of intestinal flora to pathology
The samples of the cancer group were analyzed in subgroups at the genus level to compare the abundance of gut microbiota between the different subgroups (Figure 4). When grouped by sex, Faecalibacterium had the highest abundance in men with CRC (12.07% vs 9.02% in men and women, respectively, P = .42; Figure 4), while Bacteroides had the highest abundance in women with CRC (11.22% vs 13.03% in men and women, respectively, P = .48). In terms of tumor site, Faecalibacterium was the most abundant in patients with colonic tumors (12.77% vs 9.37% in colonic and rectal tumors, respectively, P = .46), whereas Bacteroides had the highest abundance in patients with rectal tumors (11.65% vs 12.14% in colonic and rectal tumors, respectively, P = .83). With respect to tumor infiltration depth, Faecalibacterium had the highest abundance at the T1 to T2 stage (12.22% vs 10.21% in T1-T2 and T3-T4 stages, respectively, P = .44), whereas Bacteroides had the highest abundance in patients at the T3 to T4 stage (10.37% vs 12.70% in T1-T2 and T3-T4 stages, respectively, P = .55). With respect to lymph node metastasis, Faecalibacterium was the most abundant in patients with lymph node metastasis (12.99% vs 9.54% with and without lymph node metastasis, respectively, P = .66), whereas Bacteroides was the most abundant in patients without lymph node metastasis (6.37% vs 12.46% with and without lymph node metastasis, respectively, P = .03).
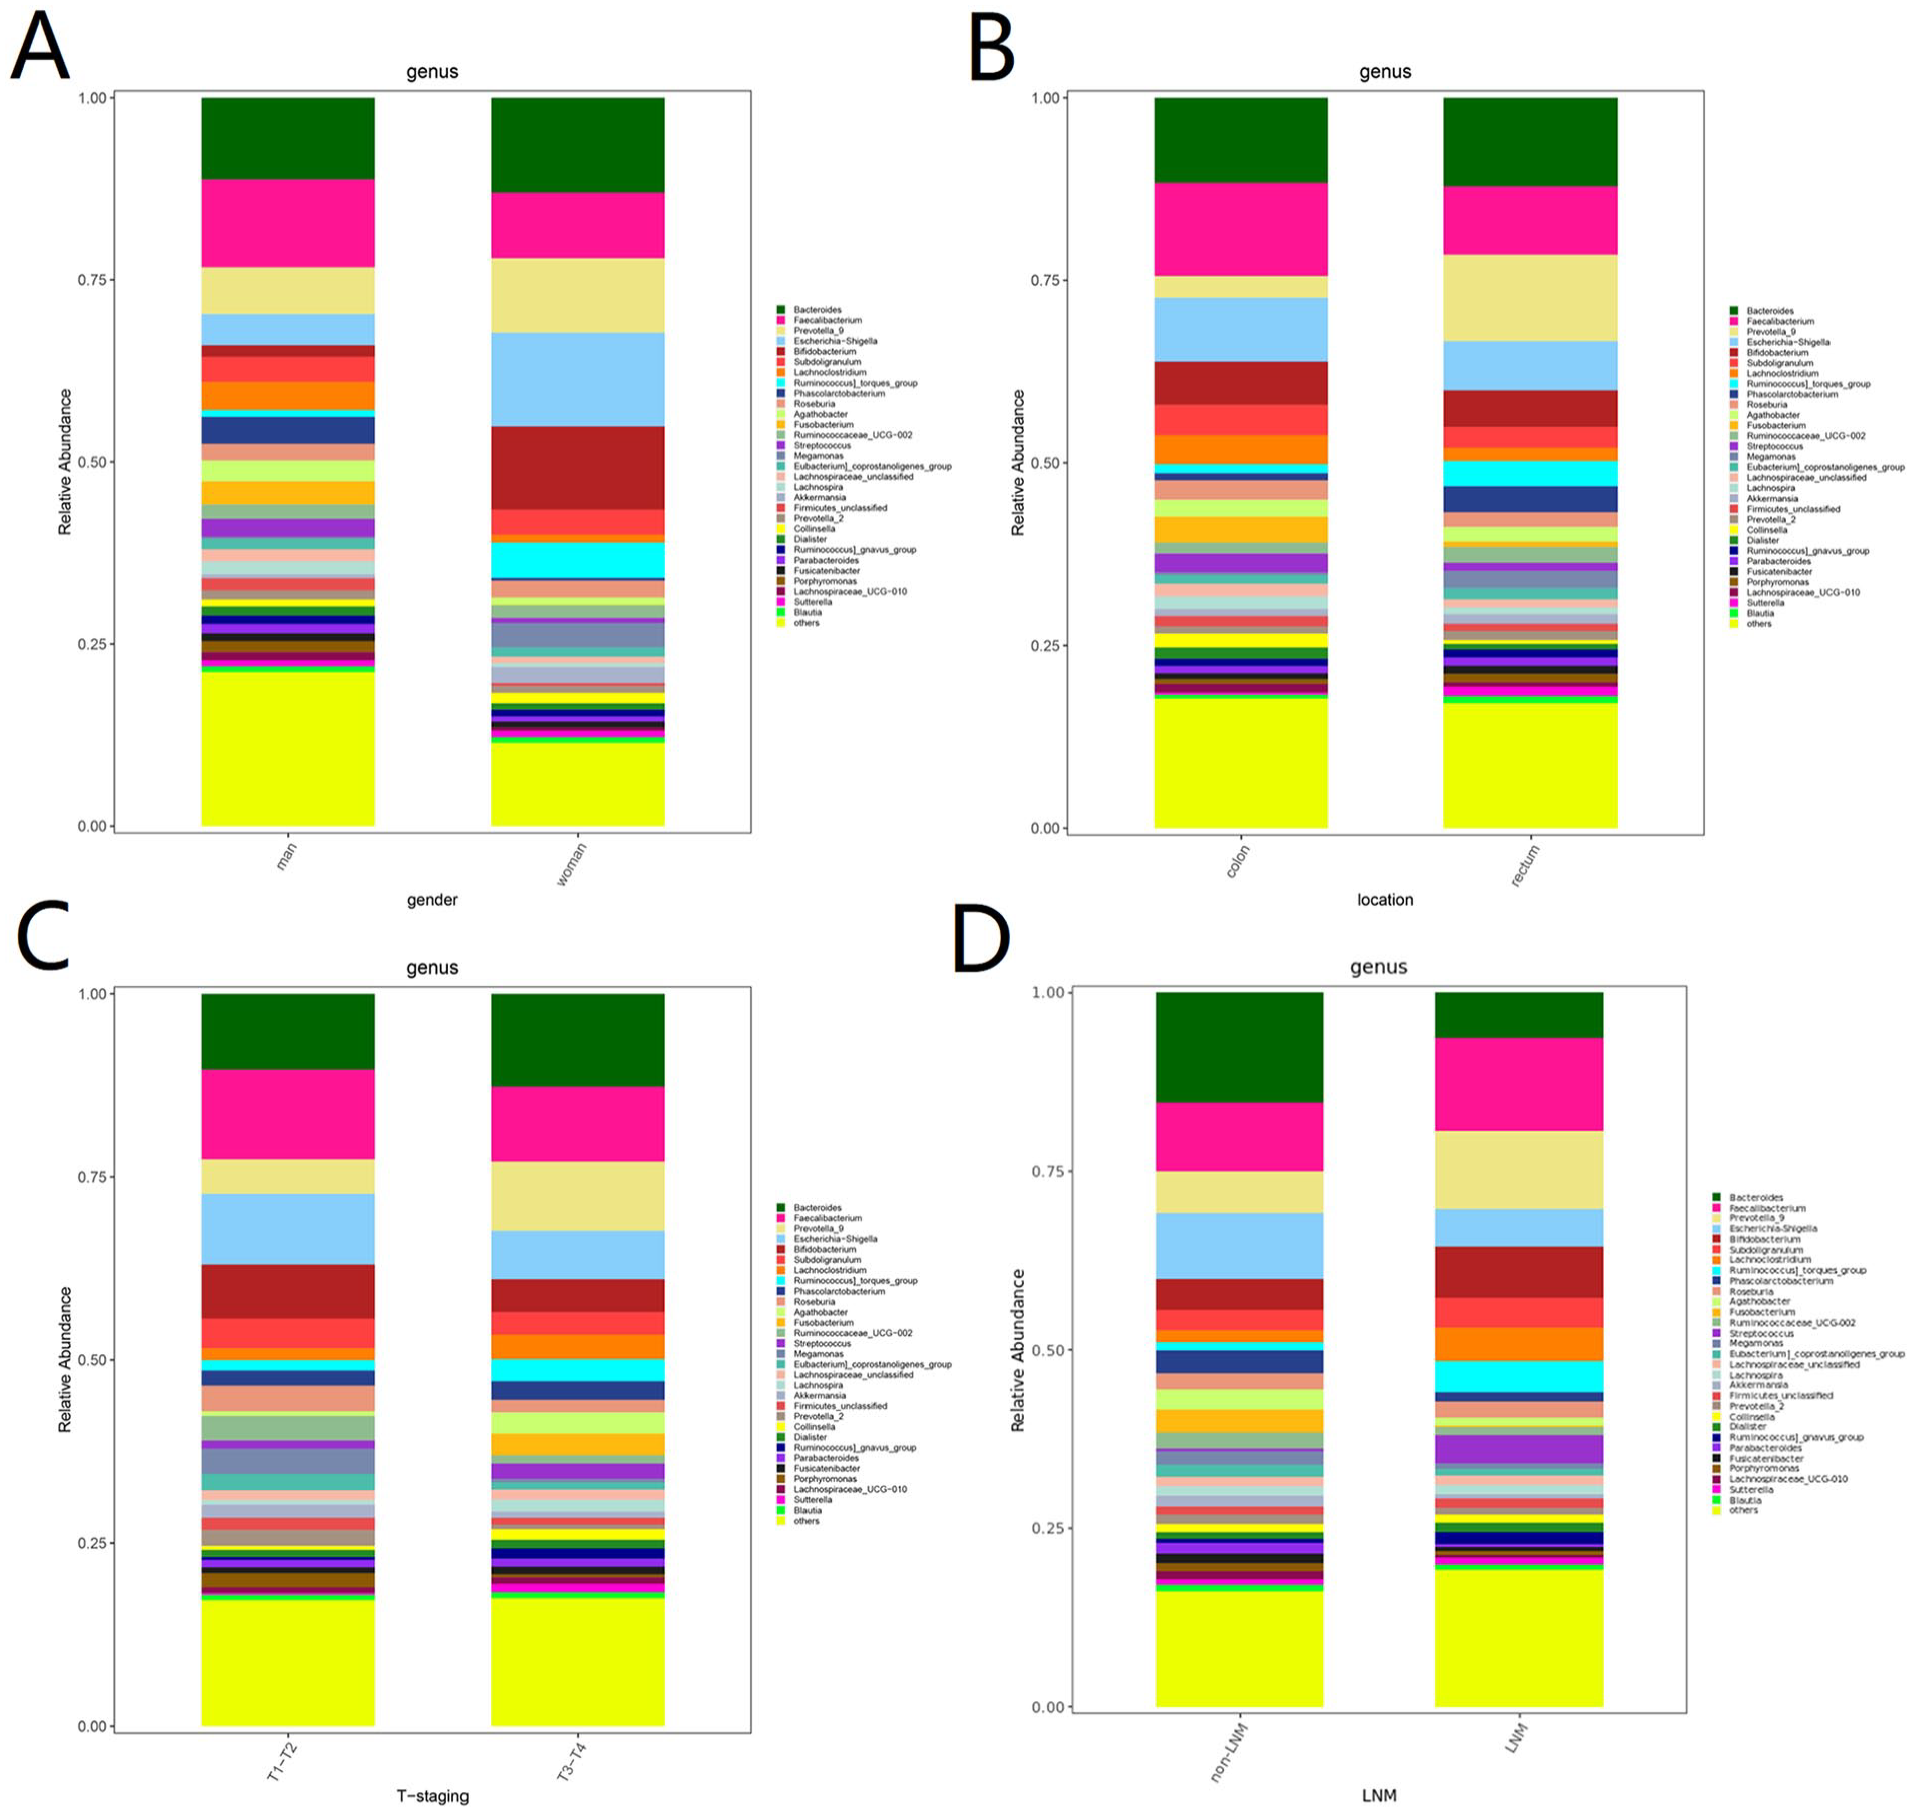
Subgroup analysis in Cancer group: (A) sex; (B) tumor site; (C) tumor infiltration depth; and (D) presence of lymph node metastasis.
Based on the FDR, we screened the genera potentially responsible for the differences in gut microbiota composition (Figure 4, Table 4). As shown in Table 4, Bilophila was more abundant in men than in women (0.38% vs 0.07%, respectively, P = .02), while the abundance of Comamonas was lower (0% vs 0.01% in men and women, respectively, P < .001). Compared with patients with rectal tumors, those with colonic tumors had a significantly higher abundance of Gordonibacter (0% vs 0.02%, respectively, P = .03) and Collinsella (0.52% vs 1.89%, respectively, P = .04), while Clostridium was less abundant (0.71% vs 0.07%, respectively, P = .05). Compared with patients with T3 to T4 CRC, patients with T1 to T2 CRC had a significantly higher abundance of Ruminococcaceae_UCG-005 (0.17% vs 0.90%, respectively, P = .01), Pseudoflavonifractor (0% vs 0.01%, respectively, P = .02), and GCA-900066225 (0% vs 0.02%, respectively, P = .03) and a significantly lower abundance of Tyzzerella_4 (0.96% vs 0%, respectively, P = .03) and Parvimonas (0.10% vs 0.01%, respectively, P = .03). Compared with lymph node metastasis, those without lymph node metastasis had a higher abundance of Streptococcus (4.01% vs 0.34%, respectively, P = .05), Rothia (0.90% vs 0%, respectively, P = .02), and Actinomyces (0.19% vs 0.02%, respectively, P = .03) and a lower abundance of Parabacteroides (0.32% vs 1.53%, respectively, P = .01), Bacteroides (6.37% vs 15.46%, respectively, P = .03), and Oscillibacter (0.08% vs 0.32%, respectively, P = .04).
Bacterial abundance at genus level based on sex in patients with CRC.

Bacterial abundance at the genus level significantly based on tumor sites.

Bacterial abundance at genus level based on tumor invasion depth.

Bacterial abundance at genus level based on presence or absence of lymph node metastasis.

P < .05 indicates a significant differenc.
Alpha diversity analysis
We used the Wilcoxon test to screen the alpha diversity indices that differed significantly between the groups (Figure 5A -E). Both the Chao1 and Observed species indices were lower in the cancer group than in the Control group (Figure 5A and B), indicating a lower abundance of species in the cancer group. In addition, the Shannon and Simpson indices were lower and higher in the Cancer and Control group, respectively, the difference was not statistically significant.

Microbial alpha diversity: (A) Chao1; (B) Observed species; (C) Shannon diversity; (D) Simpson diversity; (E) Good’s coverage.
Beta diversity analysis
Beta diversity is a measure of the similarity of microbiota composition between samples, thus reflecting the differences in the composition and distribution of microbiota. Beta diversity is mainly estimated by means of principal component analysis (PCA), principal coordinate analysis (PCoA), and multidimensional scaling (NMDS). Principal component analysis (Figure 6A) and PCoA (Figure 6B and C) showed no significant differences in gut microbiota distribution between the Cancer and Control groups, while the weighted (Figure 6D) and unweighted NMDS (Figure 6E) showed some explanatory significance (Stress < 0.2).

Beta diversity analysis: (A) PCA; (B) unweighted UniFrac PCoA; (C) weighted UniFrac PCoA; (D) weighted NMDS; (E) unweighted NMDS.
The PCoA showed that there were no significant differences in the distribution of gut microbiota among patients with CRC based on sex, tumor site, or depth of tumor invasion, while there were significant differences between patients with and without lymph node metastasis (Figure 7). NMDS showed that the differences in gut microbiota distribution based on sex, tumor site, depth of tumor invasion, and the presence or absence of lymph node metastasis were well explained.

Beta analysis of various subgroups of patients with colorectal cancer. (A) Grouped by sex; (a) unweighted UniFrac PCoA analysis; (b) weighted UniFrac PCoA analysis; (c) unweighted NMDS analysis; (d) weighted NMDS analysis. (B) grouped by tumor site; (a) unweighted UniFrac PCoA analysis; (b) weighted UniFrac PCoA analysis; (c) unweighted NMDS analysis; (d) weighted NMDS analysis. (C) grouped by depth of tumor invasion; (a) unweighted UniFrac PCoA analysis; (b) weighted UniFrac PCoA analysis; (c) unweighted NMDS analysis; (d) weighted NMDS analysis. (D) grouped by the presence or absence of lymph nodes; (a) unweighted UniFrac PCoA analysis; (b) weighted UniFrac PCoA analysis; (c) unweighted NMDS analysis; (d) weighted NMDS analysis PCoA, principle coordinate analysis; NMDS, multidimensional scaling.
We further characterize the differences in gut microbiota abundance between the Cancer and Control group to identify differentially abundant taxa. A discriminant analysis (LDA) effect size (LEfSe) analysis identified 18 differentially abundant taxa (LDA values > 2), with the cancer group mainly enriched in Akkermansia, Akkermansiaceae, Verrucomicrobiales, Akkermansia_muciniphila, Verrucomicrobia, and Verrucomicrobiae, and the Control group mainly enriched in Megamonas_unclassified, Megamonas, and Lachnospira (Figure 8A and B).

(A) Analysis of differentially abundant taxa. (A) Evolutionary branching diagram. The circles radiating from inside to outside represent taxonomic levels from boundary (individual circles) to genus (or species). Each small circle represents a taxon at that level, the diameter of which is proportional to the relative abundance. Species with no significant differences are uniformly colored yellow, species with significant differences Biomarker follows the group, with red and green nodes indicate microbial taxa that play important roles in the red and green groups, respectively. (B) Distribution of LDA values. The colors of the histogram represent the respective groups and the bar lengths represent the LDA score, reflecting the degree of influence of differentially abundant species. LDA, linear discriminant analysis.
Prediction of gene function in microbiota
We predicted and compared the functions of gut microbiota between the Cancer and Control group using Phylogenetic Investigation of Communities by Reconstruction of Unobserved States (PICRUSt2) software. COG, EC, KO, PFAM, and TIGRFAM, were employed, among other databases, and STAMP software was used to analyze the prediction results at a significance level of P < .05. A total of 21 metabolic pathways differed significantly between the Cancer and Control groups (Figure 9). Among them, 14 metabolic pathways were significantly more active in the cancer group, including pyruvate metabolic pathway, adenosine nucleotide degradation, and acetyl coenzyme A metabolism. Seven metabolic pathways were significantly more active in the Control group, including lipid coenzyme A biosynthesis and acetic acid metabolism (Table 5).
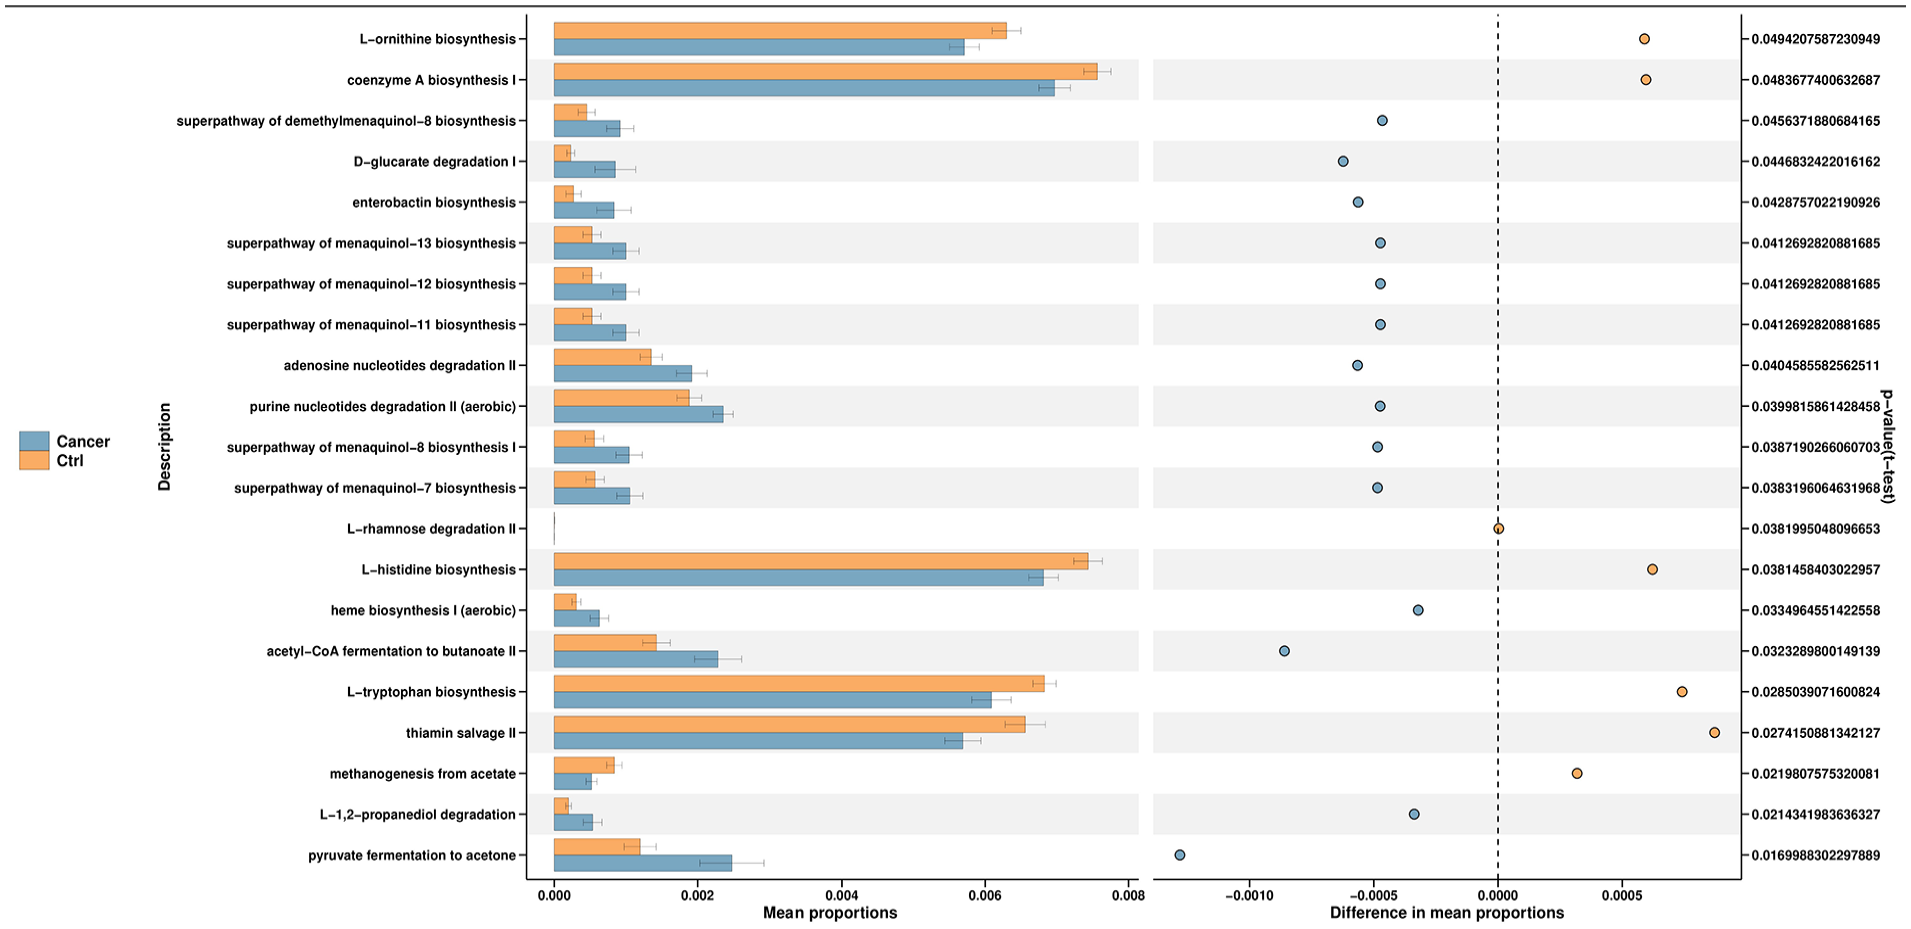
Gut microbiota PICRUSt2 functional prediction.
Differential metabolic pathways between the Cancer and Ctrl groups.
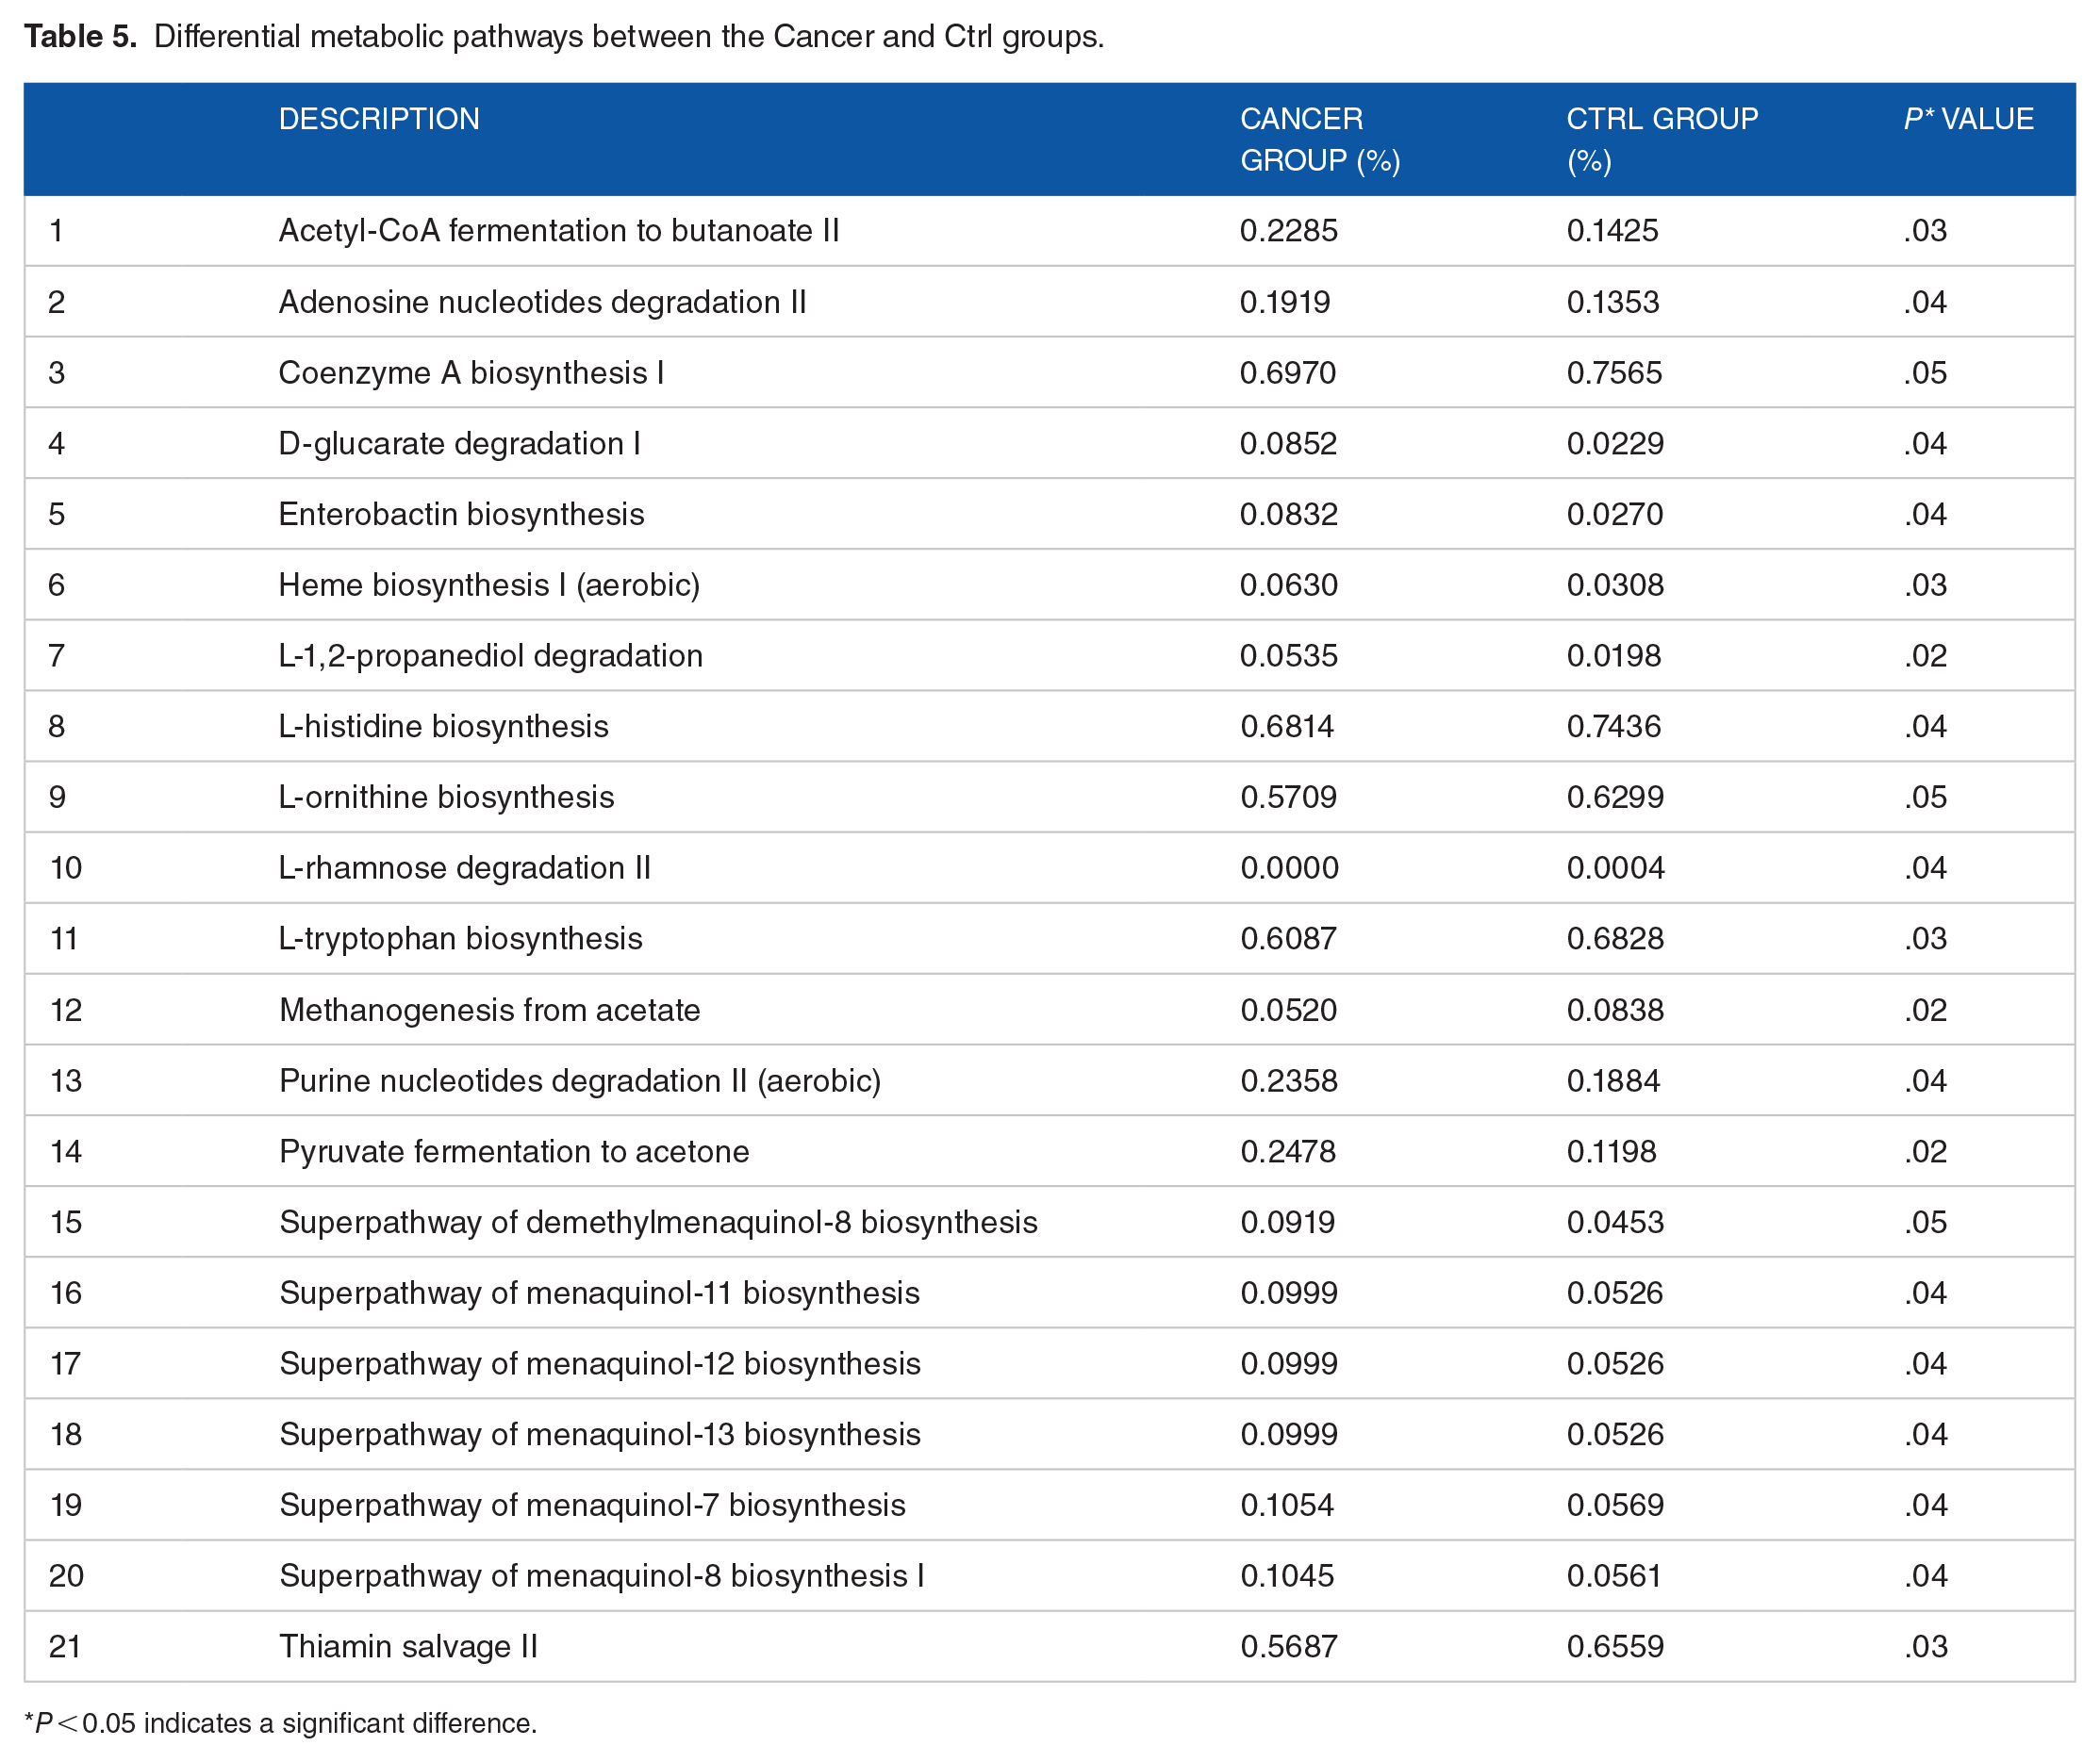
P < 0.05 indicates a significant difference.
Discussion
Intestinal microbiota and their metabolites are essential factors in intestinal microecology, which plays important roles in host health and the development of malignancies such as CRC.21,22 Some studies have found that patients with CRC have a less-diverse gut microbial community than healthy individuals, 23 though this remains debatable. 24 To further validate the changes in gut microbiota in patients with CRC, we investigated the gut microbiota structure and its differences between patients with CRC and healthy individuals. We also predict the function of the microbes between groups based on the differentially abundant microbes. Furthermore, we identify the gut microbiota associated with patient age, sex, depth of tumor infiltration, and lymph node metastasis—this has not been addressed in other studies and is essential for understanding the role of the gut microbiome in the development of CRC. At different stages of CRC, we found that the microbiota community structure changed as CRC progressed along the polyp–adenoma–carcinoma axis,25,26 suggesting that changes in gut microbiota may contribute to CRC progression. However, little is known of the relationship between gut microbiota structure and the clinicopathological characteristics of patients with CRC. Accordingly, we compared the distribution of gut microbiota in patients with CRC and explored the differential microbiota associated with sex, tumor site, depth of tumor infiltration, and lymph node metastasis.
We found that alpha diversity did not differ between patients with CRC and healthy individuals, consistent with recent findings. 25 The 5 most abundant phyla in both groups were Firmicutes, Bacteroidetes, Proteobacteria, Actinobacteria, and Fusobacteria, in that order. Compared to healthy individuals, Firmicutes and Bacteroidetes were less abundant and Proteobacteria, Actinobacteria, and Fusobacteria were more abundant in patients with CRC, the difference was not statistically significant. High levels of Fusobacterium nucleatum have been reported in the intestine of patients with CRC, where it can contribute to the development and metastasis of CRC by establishing a pro-inflammatory tumor microenvironment and activating Wnt/β-catenin signaling, among other pathways. In addition, studies have found that intestinal Fusobacteria may originate from the oral cavity.27,28 Fusobacterium was previously observed to be enriched in the oral cavity of patients with CRC, suggesting a role in colorectal carcinogenesis. 29 Notably, consistent with recent findings, Fusobacteria was not enriched in the intestine of patients with CRC.30,31 This may be due to differences in the study population, stool collection and preservation techniques, library preparation, or primer and sequencing platforms.
LEfSe analysis demonstrated that Verrucomicrobia abundance was significantly increased in patients with CRC, consistent with previous findings.32-34 However, little is known about Verrucomicrobia, and research on Akkermansia muciniphila (the only intestinal representative of Verrucomicrobia in human feces) 35 has focused mostly on its association with diseases such as diabetes and obesity.36,37 Mucin 2 (Muc2) is highly expressed in CRC and involved in its progression. Akkermansia muciniphila encodes Amuc_1434*—a specific protein that degrades and downregulates Muc2—which may be beneficial in controlling CRC progression. Akkermansia muciniphila also reduces CRC cell viability by upregulating tumor necrosis factor-related apoptosis-inducing ligand (TRAIL) to activate the death receptor pathway of apoptosis and mitochondrial pathway. 38 A recent animal study suggested that A muciniphila may promote CRC formation in mice by stimulating early inflammation and intestinal epithelial cell proliferation. 39 The roles of Verrucomicrobia in CRC remain largely unclear and require further investigation.
Parvimonas, a Gram-positive anaerobic coccus that colonizes the oral and gastrointestinal tracts of healthy individuals, has recently received considerable attention for its association with CRC. Sequencing studies of stool samples from different ethnic groups showed that the detection rate and abundance of Parvimonas were higher in the intestine of patients with CRC than in healthy individuals, 40 consistent with our findings. A previous qPCR analysis of fecal samples from patients with CRC concluded that Parvimonas could serve as a noninvasive biomarker for CRC, with a similar sensitivity to that of F nucleatum. 41 Not much is known about the role of Parvimonas in the development of CRC. One in vitro study found that Parvimonas act synergistically in biofilm formation, 42 though this requires further investigation.
We noted a higher abundance of Ruminococcaceae_UCG-002 in patients with CRC than in healthy individuals, consistent with previous results. 43 Ruminococcus is thought to be associated with KRAS mutations, 44 suggesting a potential avenue for the prevention and treatment of CRC using gut microbiota. Our study revealed that Megamonas, Lachnospira, and Romboutsia were more abundant in healthy individuals than in patients with CRC. However, the role of Romboutsia in CRC is unclear. Consistent with our results, a previous study reported a dramatic decrease in the relative abundance of Romboutsia in intestinal mucosal samples of CRC, which may be associated with mucosal damage. 45 Megamonas and Lachnospira are involved in the formation of short-chain fatty acids (SCFAs) from carbohydrates,46,47 which not only serve as a source of energy for colonic cells but also have a preventive effect against CRC through multiple pathways. 48
Our alpha diversity subgroup analysis failed to reveal differences in gut microbiota structure among patients with CRC based on sex, tumor site, depth of tumor infiltration, and the presence or absence of lymph node metastasis. However, significant differences in the beta diversity distribution of intestinal microbiota were observed between patients with and without lymph node metastasis. Comamonas and Bilophila had significantly different intestinal distributions between men and women. In CRC development, the gut microbiome may be more stable in men than in women, suggesting that gut microbiota composition may be sex-dependent. However, this study failed to identify the structural differences in the gut microbiota between men and women 49 ; therefore, further experimental validation is required. Our results emphasize the potential importance of sex differences when predicting CRC risk based on gut microbiota composition.
With respect to tumor infiltration depth, we identified 10 differentially abundant bacteria between stages T1 to T2 and T3 to T4; and among these, the abundance of Tyzzerella_4 and Parvimonas was higher at stages T3 to T4, while the abundance of the other bacteria was higher at stages T1 to T2. The potential role of Tyzzerella_4 in CRC is unclear; nevertheless, it has a promising discriminatory ability for the early detection of advanced adenomas. 50 Based on an LDA > 4, we noted that the abundance of Faecalibacterium was higher at stage T1 to T2, which may be related to the progressive depletion of favorable intestinal microbiota with the progression of CRC. 51
With respect to lymph node metastasis, the abundance of Bacteroides, Parabacteroides, Streptococcus, and Oscillibacter differed significantly between the 2 groups, consistent with the findings of several previous studies26,52,53; however, these studies failed to identify any roles for these bacteria in lymph node metastasis in CRC. 54 Some studies have also failed to find an association between gut microbiota and lymphatic metastasis. 52 The association between gut microbiota and lymphatic metastasis remains controversial and requires further investigation.
Finally, we identified numerous enriched pathways associated with the differentially abundant taxa, including pyruvate metabolism, adenosine nucleotide degradation, acetyl coenzyme A metabolism, and acetate metabolism. The results of our predictive functional analysis suggest a link between microbial changes CRC and metabolic pathways previously associated with dietary risk factors associated with Western diets, though further experimental validation is required.
There are certain limitations to this study. First, owing to the impact of the coronavirus disease (COVID-19) pandemic and strict exclusion criteria, our sample size was relatively small. Therefore, future studies should use larger sample sizes to fully characterize the potential microbial biomarkers in CRC development, identify beneficial microorganisms, and determine their functions and interactions with the host. Second, we did not examine mucosa-adherent gut microbes, which may be more closely associated with colon carcinogenesis than fecal microbes. Third, we only used 16S rRNA sequences to determine microbial distributions. Future studies should include macrogenomic and metabolomic sequencing to improve the accuracy of microbial community composition and function estimation.
In conclusion, we observed differences in gut microbiota composition between patients with CRC and healthy individuals, which was associated with patient clinicopathology, suggesting that gut microbiota play a role in the development and prognosis of CRC. This is the first study to identify gut microbiota associated with patient age, sex, tumor infiltration depth, and lymph node metastasis, which is essential for understanding the role of the gut microbiome in CRC development. Our findings substantiate the results of previous reports, elaborate on the relationship between gut microbes and CRC, and highlight the gaps in the field. In future studies, we will build on this work to validate the role of differentially abundant gut microbiota in CRC and explore the associated mechanisms through cellular and animal experiments.
Conclusion
Based on this study, patients with CRC and healthy people have different gut microbiota compositions, and some microbial alterations are linked to the pathological and clinical characteristics of CRC. Given that Verrucomicrobia are more prevalent in CRC patients and may aid in the disease’s progression, the results point to a possible role of the gut microbiota in the development of CRC. A dysbiotic microbiome is indicated by the decreased microbial diversity and richness in CRC patients. Although our findings lend credence to the link between the microbiota and CRC, more extensive research using metagenomic analyses is required to validate these first findings and investigate potential therapeutic applications. In conclusion, our research shows that the gut microbiota is a promising target for the identification of CRC biomarkers and possible therapeutic intervention.
Footnotes
Acknowledgements
The authors thank our colleagues for their assistance and constant support.
Author Contributions
LZ and YF contributed equally to this article and participated in writing it. JZ, CW, HJ, and JZ participated in drawing the pictures in this article and gave guidance, DW and DT gave constructive comments on the structure of the whole article. All authors read and approved the final manuscript.
Declaration of conflicting interests:
The author(s) declared no potential conflicts of interest with respect to the research, authorship, and/or publication of this article.
Funding:
The author(s) disclosed receipt of the following financial support for the research, authorship, and/or publication of this article: This work was supported by the Graduate Research—Innovation Project in Jiangsu province (grant no. SJCX21_1644), the Academic Science and Technology Innovation Fund for College Students (grant no. 202011117056Y), the Social Development-Health Care Project of Yangzhou, Jiangsu Province (grant no. YZ2021075), and high-level talent “six one projects” top talent scientific research project of Jiangsu Province (grant no. LGY2019034), the Graduate Research—Innovation Project in Jiangsu province (grant no. SJCX22_1816), Social development project of key R&D plan of Jiangsu Provincial Department of science and technology (grant no. BE2022773). The funding bodies had no role in the design of the study; in the collection, analysis, and interpretation of the data; and in writing the manuscript.
Consent for Publication
Written informed consent for publication was obtained from all participants.
Data Availability Statement
Data sharing not applicable to this article as no datasets were generated or analyzed during the current study.
Ethical Approval and Consent to Participate
The study was approved by the Medical Ethics Committee of Northern Jiangsu People’s Hospital (no. 2024ky159). This study adhered to the STROBE guidelines, and all methods were performed in accordance with the relevant guidelines and regulations (eg, Declarations of Helsinki).