
Abstract
Background:
Reliable predictive data are crucial for making accurate treatment decisions in glioma patients, but it can be challenging to obtain due to limited information in many cases. Numerous research studies have indicated the involvement of cyclic adenosine monophosphate (cAMP)-response element binding protein (CREBBP) and E1A binding protein p300 (EP300) in tumorigenesis and tumor progression across various types.
Methods:
The messenger RNA (mRNA) expression levels of CREBBP and EP300 were retrospectively analyzed in 17 grade-3 glioma patients. The SYBR Green real-time polymerase chain reaction (RT-PCR) technique was employed for mRNA expression analysis, with the glyceraldehyde-3-phosphate dehydrogenase gene (GAPDH) used as a reference gene for data normalization. In addition, the relationship between CREBBP, EP300 expression and patients’ clinical information, imaging features, histologic features, immune factors, and overall survival was assessed through univariate analyses.
Results:
The analysis of the data unveiled a statistically significant upregulation of CREBBP and EP300 mRNA expression levels in large gliomas as compared with their smaller counterparts (P < .05). Histological examination using hematoxylin and eosin (H&E) staining exhibited marked cellular heterogeneity, with heightened cell density observed specifically within tumors displaying elevated CREBBP expression levels. In contrast, there was a substantial downregulation of complement 3 and complement 4 within larger tumor volumes when compared with smaller ones (P < .05). However, these findings do not serve as clinically relevant prognostic indicators for glioma.
Conclusions:
It is suggested that higher expression levels of CREBBP and EP300 are positively associated with increased tumor volume. Inhibition of CREBBP and EP300 enhances local immunogenicity, leading to the recruitment of immune cells and release of cytokines for effective tumor eradication, ultimately resulting in the inhibition of tumor growth.

Introduction
Glioma, the most prevalent primary brain tumor, accounts for approximately 80% of all primary malignant tumors in the central nervous system. 1 The latest, fifth edition of the World Health Organization (WHO) Classification of Tumors of the Central Nervous System, categorizes these tumors into four distinct grades, ranging from 1 to 4, which reflect the degree of malignancy. This classification system also encompasses a variety of histological subtypes, including astrocytoma, oligodendroglioma, and the highly aggressive glioblastoma. 2 The important biological characteristic of glioma is that tumor cells invade normal brain tissue, resulting in the formation of numerous “satellite tumor foci” surrounding the primary focus. 3 Due to the frequent infiltration of vital functional regions in the brain, surgical removal is often restricted, resulting in a significant likelihood of recurrence within 2 cm from the initial tumor site after surgery. Consequently, effective treatment remains a formidable challenge in neurosurgery. Over the past few years, there have been notable developments in imaging diagnostics, neuronavigation, identifying functional neural areas, understanding tumor molecular pathology, administering chemotherapy and stereotactic radiotherapy, performing microneurosurgery, utilizing gene therapy and immunotherapy. These advancements have led to some degree of improvement in treating malignant glioma. 4 However, despite these treatment advances, the prognosis for glioma remains poor with a median survival time of only 14 to 17 months. 5 The identification of novel and effective prognostic and therapeutic biomarkers and targets for clinical use remains crucial in customizing the evaluation of glioma prognosis assessment and treatment.
The closely homologous genes, cyclic adenosine monophosphate (cAMP)-response element binding protein (CREBBP) and E1A binding protein p300 (EP300), are pivotal in regulating cell growth, metabolism, differentiation, and angiogenesis, making them essential carcinogenic factors. 6 Studies have revealed that the oncogenic impact of CREBBP and EP300 is manifested by their control over processes such as angiogenesis, hypoxic metabolism, epithelial–mesenchymal transition, and various other biological mechanisms.7-9 Angiogenesis is a hallmark of malignant tumors, and the proliferation, migration, and invasion of tumor cells are closely associated with tumor angiogenesis. 10 Hypoxia is a prominent feature of the local microenvironment in tumors and also one of the critical factors that contribute to tumor metastasis11,12 and the hypoxic microenvironment can induce irreversible epithelial–mesenchymal transition.13,14 In addition, CREBBP and EP300 are associated with tumor prognosis. Research has revealed that CREBBP plays a role in tumor development and affects the effectiveness of immune checkpoint inhibitors through its direct regulation of the DNA damage response pathway. 15
The lack of reliable biomarkers for predicting therapy response and recurrence in cancer, particularly with regards to CREBBP and EP300 involvement, is a major concern. However, their association with clinical-pathophysiological characteristics in glioma patients remains poorly understood. Therefore, this study aimed to investigate the role of CREBBP and EP300 in glioma lesions and assess their relationship with key clinicohistological predictive factors. The primary objective was to compare and analyze the levels of these genes in varying sizes of glioma samples based on histologic features using quantitative real-time polymerase chain reaction (RT-PCR) techniques and nuclear magnetic resonance imaging (MRI). In addition, we sought to evaluate the immune implications of these gene expression levels by examining their correlations among patients diagnosed with glioma. The CREBBP and EP300 play a crucial role in the diagnosis and progression of glioma, making it a promising candidate as a biomarker for this disease.
Methods
Patient information
A total of 17 cases of glioma from Zhejiang Cancer Hospital (Zhejiang, China) were selected, including 10 men and 7 women. The average age was 51 ± 23 years. The inclusion criteria were postoperative diagnosis of glioma grade 3 based on histopathology. The exclusion criteria encompass individuals who are either under 18 or over 75 years of age, those with other malignant tumors, and those with incomplete clinical data or unavailable follow-up data. In addition, individuals who are unable to comprehend the study’s requirements or provide informed consent are also excluded. The study was approved by the Ethics Committee of the Cancer Hospital of Zhejiang Cancer Hospital. Data collection commenced in November 2018 and was completed after 4 years observation period in November 2022.
Tumor samples and histology review
All tumor specimens were fixed in 10% neutral-buffered formalin and embedded in paraffin. A pathologic review of all tumors was conducted by a group of expert neuropathologists. Hematoxylin and eosin (H&E)-stained slides were prepared from 4 lm sections of formalin-fixed, paraffin-embedded (FFPE) tissue. Slides were examined with an Olympus BX41 light microscope. Photos were taken with an Olympus DP25 camera.
MRI scan
All MRI scans were conducted utilizing a Siemens magnetic resonance (MR) system. The scanning protocol involved an Enhanced T1 Spin Echo (SE) sequence, encompassing both axial and coronal imaging planes. The specific parameters for the scan were as follows: Repetition Time (TR) of 380 ms, Echo Time (TE) of 10 ms, with a total of 24 slices acquired. Each slice had a thickness of 5 cm and a gap of 1 cm between them. A contrast agent, specifically gadolinium spray acid glucosamine, was administered at a dosage of 15 cm, infused at a rate of 1.5 cm/s. Following the contrast injection, an equivalent volume of isokinetic saline was injected to flush the system. It was ensured that the scanning range extended to cover the entirety of the brain. Subsequently, the size of the glioma was measured using a Picture Archiving and Communication System (PACS) workstation.
RNA extraction, complementary DNA synthesis, CREBBP and EP300 messenger RNA expression analysis
Total RNA was isolated from the glioma tissue using a Trizol kit according to the manufacturer’s protocol. The complementary DNA (cDNA) was synthesized following the manufacturer’s instructions and stored at −20°C until analyzed. The reverse transcription kit PrimeScript TM RT Master Mix (Perfect Real Time) was used for reverse transcription. Fluorescent quantitative PCR kit SYBR® Premix Ex Taq TM (Til RNaseH Pl μs) was used in fluorescence quantitative PCR. The primer sequences for glyceraldehyde-3-phosphate dehydrogenase (GAPDH), CREBBP, and EP300 genes were designed using primer 3 software. The internal reference for the control group was the GAPDH housekeeping gene, and the results were calculated using the 2–ΔΔCt method. The ΔΔCt value is the sample to be tested ΔCt value and the difference between the control sample ΔCt value. The ΔCt value is the target gene Ct value and the internal reference gene Ct.
Statistical analysis
A T-test was used to analyze the difference between CREBBP and EP300 expression in glioma clinical information. The different cases were divided into groups, and the expression levels of other clinical and pathological parameters were compared. The Chi-square test evaluates the discrepancies between the two sets of data presented in the baseline table. The cut-off value is determined based on the receiver operating characteristic (ROC) curve, where the positive and negative outcomes in the ROC curve are defined with respect to mortality occurrence. The study measured the overall survival (OS) by tracking the time from disease diagnosis to either patient death or last follow-up date. The correlation between CREBBP and EP300 expression and OS was evaluated. All data were processed using SPSS 19.0 statistical software program, with statistical significance set at P < .05.
Results
CREBBP and EP300 expression with patients’ clinical information
In this study, fresh glioma tissues from 17 patients were included in the RT quantitative PCR (qPCR) experiment. According to ROC curve (see Figure 1), patients were stratified into two groups based on cut-off values for CREBBP and EP300 expressions (CREBBP: 0.3181, EP300: 0.22535). Test results equal to or greater than cut-off value are considered positive, otherwise they are negative. Patients were categorized into two groups based on a tumor volume cut-off value of 56 cm3. Tables 1 and 2 present the patients’ clinical information such as sex, age, primary tumor location, tumor diameters, and tumor volume with CREBBP and EP300. The results show that the study is randomized, and the two groups are balanced (P > .05). The RT qPCR experiment findings demonstrated a notable increase in the expression levels of CREBBP and EP300 in large gliomas when compared with small gliomas, exhibiting statistical significance (P < .05; see Tables 3 and 4).

The ROC curve with CREBBP, EP300, and tumor volume. CREBBP indicates cyclic adenosine monophosphate (cAMP)-response element binding protein; EP300, E1A binding protein p300; ROC, receiver operating characteristic.
Baseline characteristics of the patients with CREBBP.
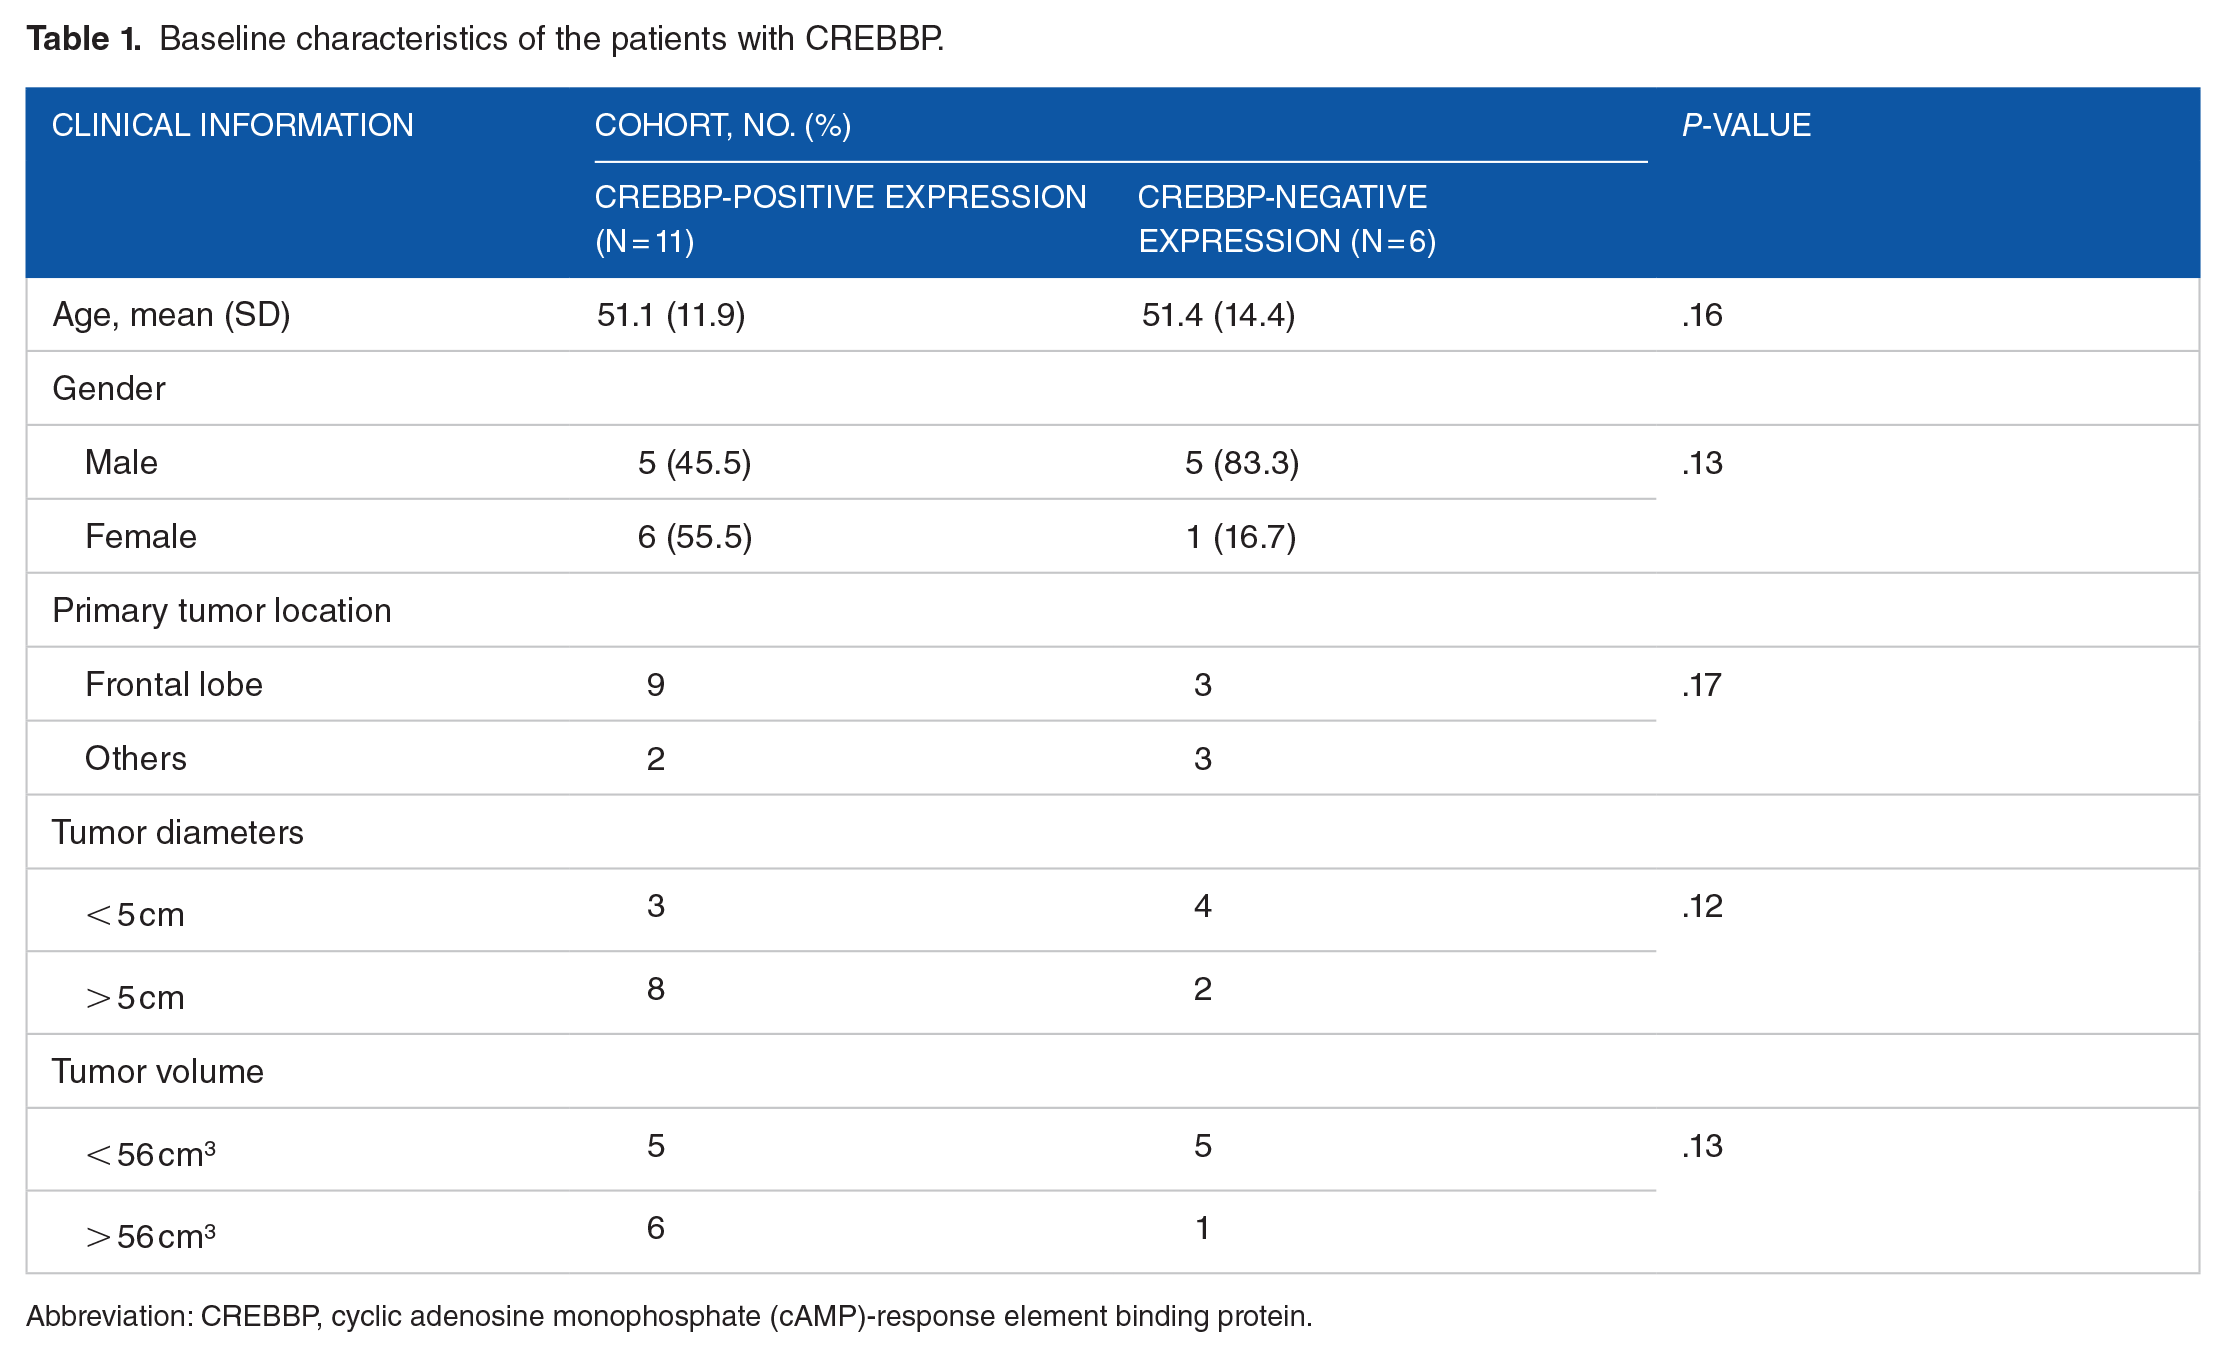
Abbreviation: CREBBP, cyclic adenosine monophosphate (cAMP)-response element binding protein.
Baseline characteristics of the patients with EP300.

Abbreviation: EP300, E1A binding protein p300.
Clinicopathological variables and their correlation with gene expression of CREBBP in glioma tissues.

Clinicopathological variables and their correlation with gene expression of EP300 in glioma tissues.

CREBBP and EP300 expression with imaging features
Preoperative MRI scans detected compact, clearly delineated masses in all 17 individuals, with the tumors displaying substantial mass-related impacts. The dimensions of the tumors ranged from 1.1 to 8.4 cm. Our results indicated that gliomas with increased levels of CREBBP and EP300 showed noticeable enlargement on MRI scans (see Figure 2).

Imaging features of the grade-3 glioma. (A) and (B) MRIs of selected patients with low CREBBP and EP300 expression glioma. (C) and (D) MRI of selected patients with high CREBBP and EP300 expression. CREBBP indicates cyclic adenosine monophosphate (cAMP)-response element binding protein; EP300, E1A binding protein p300; MRI, magnetic response imaging.
CREBBP and EP300 expression with histologic features
To examine the histology and pathological classification of glioma, H&E staining is employed. This method primarily imparts a purple-blue hue to the chromatin within the nucleus and nucleic acid in the cytoplasm, while highlighting components in theasm and extracellular matrix as red. Examination of H&E-stained sections reveals noticeable diversity among tumor cells, with increased density observed in cases demonstrating elevated levels of CREBBP and EP300 expression (see Figure 3), suggesting their potential involvement in promoting cell proliferation.
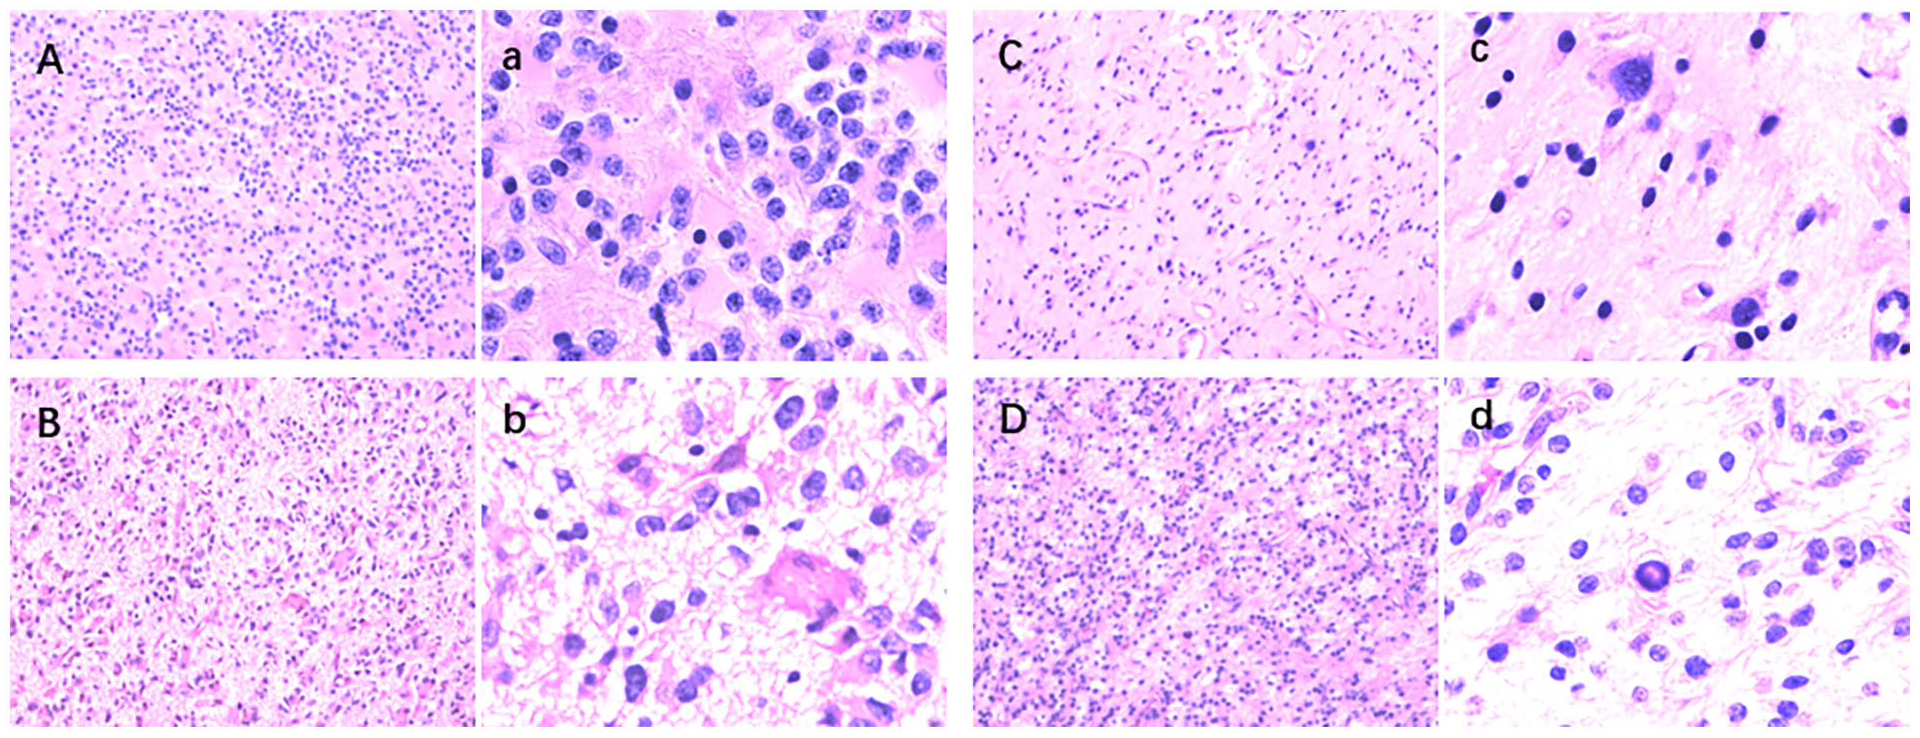
Shown are H&E-stained sections demonstrating the circumscribed growth, palisading necrosis, perivascular pseudorosettes, and glioma-like fibrillary frequently observed in this tumor. (A) and (C) Histologic features of selected patients with low CREBBP and EP300 expression glioma. (B) and (D) Histologic features of selected patients with high CREBBP and EP300 expression. Microscopic images of pathological sections obtained from glioma 100× magnification (ABCD) and 400× magnification (abcd). CREBBP indicates cyclic adenosine monophosphate (cAMP)-response element binding protein; EP300, E1A binding protein p300.
CREBBP, EP300 expression, and tumor volume with immune factors
To investigate the impact of CREBBP, EP300 expression, and tumor volume on immune factors in glioma, we assessed the blood levels of complement 3, complement 4, lgA, IgG, and IgM in these patients. Our results indicate a notable decrease in the expression levels of complement 3 and complement 4 among individuals with extensive tumor size when compared to those with limited tumor size (P < .05; see Table 5). However, no statistically significant differences were observed for other immune indicators.
Univariate analysis of immune indicators for CREBBP and EP300 expression of glioma patients.

Abbreviations: CREBBP, cyclic adenosine monophosphate (cAMP)-response element binding protein; EP300, E1A binding protein p300; Ig, immunoglobulin.
CREBBP, EP300 expression, and tumor volume with OS
The median OS for patients with high expression of CREBBP was 761 days, accompanied by a 90.9% 1-year survival rate and a 54.5% 2-year survival rate; whereas the median OS for those with low expression was 818 days, exhibiting an 83.3% 1-year survival rate and an identical 2-year survival rate of 83.3%. In terms of EP300 expression, the median OS for individuals with high levels reached 813 days, along with an observed 1-year survival rate of 86.7% and a 2-year survival rate of 60%; on the contrary, patients with decreased EP300 expression exhibited a median OS of 760 days, demonstrating an impressive 1-year survival rate of 100% and maintaining a similar 2-year survival rate. There was no statistically significant difference in OS expression of different CREBBP and EP300 expression proteins. For large volumes, the median was 813, with a 1-year survival rate of 100% and a 2-year survival rate of 71.4%, while for small volumes, the median was 749, with a 1-year survival rate of 80% and a 2-year survival rate of 60%. There was no statistically significant difference in OS expression of different CREBBP and EP300 expression proteins.
Discussion
Two highly homologous proteins, CREBBP and EP300, play crucial roles in diverse biological processes. Research has demonstrated that CREBBP-mediated post-translational N-glycosylation induces conformational changes in interacting proteins, thereby regulating gene expression, cell growth, and differentiation. 16 The EP300 plays a pivotal role in various cellular processes, encompassing cell differentiation, proliferation, and DNA repair. The oncogenic potential of CREBBP and EP300 has been extensively validated across diverse tumor types, underscoring their indispensable involvement in tumorigenesis and progression. 17 However, limited research has been conducted on the expression of CREBBP and EP300 in glioma. In this study, we examined the levels of CREBBP and EP300 expression in human gliomas with varying sizes and explored their association with clinicopathological characteristics as well as immune responses in gliomas using high-level tissue samples obtained during clinical practice. The findings of this study reveal a notable increase in the expression of CREBBP and EP300 in larger glioma tissues compared with smaller ones, as confirmed by both MRI scans and pathological analyses. The tumor’s volume, rather than its diameter, showed notable variations (see Tables 3 and 4). Tumor volume is typically calculated using measurements of both length and width. Benign tumors are often characterized by their round shape and smooth surface, whereas malignant ones tend to be irregularly shaped and have an uneven surface texture. In the case of grade-3 gliomas, which are more malignant, it is more appropriate to use volume rather than diameter to represent the tumor’s size. However, tumor size is not the sole determinant of malignancy. Malignant tumors are generally known to grow more rapidly and can reach larger sizes, sometimes without causing noticeable symptoms in the early stages. Although the growth rate and potential for malignancy can be correlated with tumor size, this is not universally true. In clinical practice, small tumors can still be malignant, and some larger ones may be benign. Consequently, tumor size is just one of many factors that physicians consider when assessing a tumor’s nature. An accurate diagnosis and evaluation are made by taking into account the tumor’s size, shape, histological features, the patient’s medical history, and other relevant factors. Notably, the overexpression of CREBBP and EP300 genes is implicated in promoting tumor growth. Moreover, this investigation identifies a novel biomarker for glioma, offering a promising avenue for precise diagnosis and treatment strategies.
The tumor microenvironment is intricately associated with the occurrence and progression of glioma. 18 In conjunction with complement activation, innate immunity plays a crucial role in the human innate immune process by incorporating natural immune functions. The complement system exerts a dual regulatory role in tumorigenesis and development while influencing the outcomes of immune responses.19,20 On one hand, complement plays a crucial role in enhancing immune surveillance and inhibiting tumor cells through activation of the body’s immune response, participation in the opsonin response, and direct cytotoxicity. 21 On the other hand, dysregulated complement activation within the tumor microenvironment serves as a pivotal factor in sustaining chronic local inflammation and promoting tumorigenesis. 22 The interference of complement in the immune response signaling pathway also significantly enhances tumor immune evasion and immunosuppression. Recently, it has been discovered that complement activation can facilitate the assembly of membrane attack complex (MAC), which not only directly induces complement-dependent cytotoxicity (CDC) but also serves as a crucial mediator for activating acquired immunity. 23 The activation of the complement system necessitates the presence of both complement 3 and complement 4. 24 This investigation revealed an inverse correlation between tumor volume and the levels of complement 3 and complement 4. This may be attributed to the compromised immune response of complement-deficient patients toward glioma, thereby suggesting that normal activation of the complement system could potentially facilitate the generation of a cascade of tumor immune response intermediates, enhance tumor-specific immune responses, and impede glioma formation and growth. Previous studies on glioma immunity have predominantly focused on acquired cellular immunity. 25 In contrast, this study suggests that the complement system, as part of innate immunity, may exert a significant influence on glioma formation, growth, and malignancy. Although no direct correlation was observed between the expression of CREBBP and EP300 genes and immune indicators, there is an inverse relationship between tumor volume and levels of complement 3 and complement 4. 26 The experimental results further demonstrate that the inhibition of CREBBP and EP300 enhances local immunogenicity, leading to increased recruitment of immune cells, enhanced cytokine release for tumor eradication, and subsequent suppression of tumor growth.
This study does not provide further validation for the prognostic significance of CREBBP and EP300 in glioma. However, we observed that a lower level of CREBBP expression was linked to longer median survival and improved 2-year survival rates in comparison to a higher level of CREBBP expression. Furthermore, decreased EP300 expression showed correlation with higher 1-year and 2-year survival rates when compared with increased EP300 expression.
Our study provides compelling evidence to facilitate the identification and early diagnosis of glioma populations through detection techniques. The identification of biomarkers plays a crucial role in effectively identifying high-risk groups for glioma, implementing targeted interventions, improving early detection rates, and enhancing prognoses. However, the limited sample size in this study restricts a comprehensive discussion on the clinicopathological characteristics of glioma associated with CREBBP and EP300. When examining the predictive value of molecular markers, it is essential to integrate traditional important stratification factors with a thorough analysis of their impact on prognosis. This approach can lead to more comprehensive prediction outcomes or provide more accurate guidance for treatment decisions. Future investigations should prioritize expanding the clinical sample size to repeatedly validate the potential utility of CREBBP and EP300 as novel biological diagnostic and prognostic markers for glioma, while also elucidating their underlying mechanisms in glioma occurrence and development.
One of the primary limitations of this study is the small sample size of cases examined. This constraint may affect the generalizability and robustness of our findings. The limited number of cases was due to a combination of resource constraints and the rarity of the condition under investigation, which restricted our ability to recruit a larger cohort. The small sample size could introduce selection bias and increase the likelihood of random variability affecting our results. Consequently, the conclusions drawn from this study should be interpreted with caution, as they may not be fully representative of the broader population. To mitigate the impact of this limitation, we employed rigorous statistical methods to ensure the reliability of our analyses. However, we acknowledge that larger-scale studies are needed to confirm our findings and to provide a more comprehensive understanding of the condition.
In summary, while our study provides valuable preliminary insights into CREBBP and EP300 about gliomas, the small number of cases included should be considered when interpreting the results. Future research should aim to overcome this limitation by increasing the sample size, potentially through multicenter collaborations or by leveraging larger databases. This would enhance the power of the study and allow for more robust statistical analyses.
Conclusions
Based on the above findings of our study, we have concluded that CREBBP and EP300 have a significant role in the progression of gliomas, as their expression levels are notably elevated in larger gliomas. Furthermore, an increased cell density was specifically observed within tumors that exhibited high levels of CREBBP expression. The oncogenic influence of CREBBP and EP300 is evident through their regulation of various biological mechanisms. This investigation revealed an inverse correlation between tumor volume and the levels of complement 3 and complement 4. Our investigation also uncovered an inverse correlation between tumor volume and the levels of complement 3 and complement 4. Although the expression of CREBBP and EP300 was found to be upregulated in large glioma patients, their messenger RNA (mRNA) expression levels did not serve as a clinically relevant prognostic indicator for gliomas. Therefore, it is suggested that the analysis of CREBBP and EP300 expression could be crucial when making informed and personalized clinical decisions regarding the management of glioma patients.
Footnotes
Acknowledgements
The authors would like to thank all the patients who participated in this study.
Author Contributions
Cuiwei Chen was involved in writing and editing of the work; Meiqin Yuan did the conceptualization and methodology; Liang Xia did the analysis and interpretation of data; Xin Wu substantively revised the work; Xingguang Zhong and Huangjie Zhang contributed to the design of the work; Lidan Zhang contributed to the design of the work and data interpretation; Xuan Liu was involved in the acquisition and analysis of the data; Zeng Wang was involved in the acquisition of data and drafted the work; Caixing Sun contributed to conception and designing of the work. All authors read and approved the final article.
Declaration of conflicting interests:
The author(s) declared no potential conflicts of interest with respect to the research, authorship, and/or publication of this article.
Funding:
The author(s) disclosed receipt of the following financial support for the research, authorship, and/or publication of this article: This work was supported by Zhejiang Cancer Hospital National Science Cultivation Foundation (grant no. PY2021020), the 1022 Talent Training Program of Zhejiang Cancer Hospital, National Science of Foundation of China (grant no. 81502147), Zhejiang Provincial National Science Foundation of China (grant no. LBY23H080003), Zhejiang Medical and Health Science and Technology Project (grant no. 2023KY564), Chinese medicine science and technology plan of Zhejiang Province (grant no. 2022ZB052), Zhejiang Pharmaceutical Association Hospital pharmacy special project (grant no. 2020ZYY16).
Availability of Data and Materials
The datasets used and/or analyzed during the current study are available from the corresponding author on reasonable request.
Consent for Publication
Written informed consent for publication was obtained from all participants.
Ethics Approval and Consent to Participate
This study was approved by the Medical Ethics committee of Zhejiang Cancer Hospital, China (IRB-2024-613). All individuals included in the study signed a consent form to use their clinical samples and personal data under the supervision of their physician.