
Abstract
Most of the discoveries from gene expression data are driven by a study claiming an optimal subset of genes that play a key role in a specific disease. Meta-analysis of the available datasets can help in getting concordant results so that a real-life application may be more successful. Sequential meta-analysis (SMA) is an approach for combining studies in chronological order while preserving the type I error and pre-specifying the statistical power to detect a given effect size. We focus on the application of SMA to find gene expression signatures across experiments in acute myeloid leukemia. SMA of seven raw datasets is used to evaluate whether the accumulated samples show enough evidence or more experiments should be initiated. We found 313 differentially expressed genes, based on the cumulative information of the experiments. SMA offers an alternative to existing methods in generating a gene list by evaluating the adequacy of the cumulative information.
Introduction
Most of the discoveries from gene expression data are driven by a single study claiming an optimal subset of genes that play a key role in a specific disease within a particular clinical setting: diagnostic, prognostic, or response to treatment. However, poor agreement between the results of differentially expressed gene analysis from different gene expression experiments with a similar research question has been reported,1–4 which is possibly due to the well-known “curse of dimensionality” in microarray data. 5
Meta-analysis of the available datasets potentially helps in getting reliable results so that a real-life application may be more successful. Given the costs of experiments and the public availability of datasets, combining existing information from multiple gene expression experiments is an efficient tool to increase statistical power and to obtain more generalizable results. Guidelines in conducting a meta-analysis of microarray gene expression studies have been offered by Ramasamy et al. 6 and recently by Gan et al. 7 to specifically combine Affymetrix-based datasets. The proposed meta-analysis techniques have found their application in gene expression studies, eg, by Yi and Park, 8 Li and Gosh, 9 and Chang et al. 10 , as well as their application to find promising biomarkers.11,12
The common goal of a meta-analysis is to increase the precision of the effect estimate. A cumulative meta-analysis combines studies in chronological order so that the change of the effect size estimate can be observed when a study is added to the analysis. 13 However, in general, there is no adjustment for repeatedly testing the null hypothesis; nor can the power of the statistical analysis be quantified. As an alternative, sequential meta-analysis (SMA) has been proposed. SMA is not commonly applied yet, but it can be an efficient decision-making tool. 14 In an SMA, we are able to see whether we already have enough evidence to draw a conclusion, a property that an “ordinary” meta-analysis does not have. This may be particularly useful if a series of experiments have already been done, to decide to start a new study or not and potentially save resources.
This study focuses on the application of SMA to find significant gene expression signatures across a number of microarray experiments. The sequential method in this study is applied to evaluate whether accumulated samples already show enough evidence for a certain effect size or whether more experiments should be initiated. Application of an SMA is illustrated by an example in acute myeloid leukemia (AML). We incorporated the between-study variance in the SMA to adjust for the different nature of the experiments, such as the experimental setting and sample characteristics.
Methods
We describe the details of the proposed approach in this section and summarize them in Figure 1. We distinguished three major steps, namely data collection, data preparation, and data analysis. Raw gene expression datasets are obtained either as available data from different laboratories and/or from a systematic search in the online repositories. The raw datasets are then preprocessed prior to the data analysis. Finally, SMA is applied to combine the gene expression studies. As an illustration, we apply the proposed approach to find genes that are differentially expressed between normal controls and patients with AML. All statistical analyses described in this section were performed in R software.
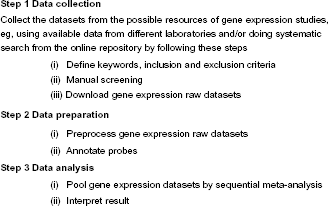
General proposed approach to apply sequential meta-analysis to gene expression datasets. The details for each step are described in the Methods section.
Step 1: Data collection
In addition to finding a gene signature list, the sequential approach that was applied in this example also acts as a tool to evaluate the necessity of the next prospective experiment. A new experiment needs to be performed when we have not decided yet for all or at least a substantial number of observed genes to be either differentially or nondifferentially expressed, due to insufficient evidence from the experiments done so far to draw a conclusion for each gene. The datasets may be combined from different experiments/laboratories and/or collected from systematic search in online repositories. We recommend using raw data to reduce the source of variability due to different preprocessing procedures. We used the downloaded gene expression datasets from ArrayExpress by using
Characteristics of the seven selected microarray experiments.

E-GEOD-12662
The main objective of this study was to characterize acute promyelocytic leukemia (APL), which is a subtype of AML. The experiment was conducted on 106 samples. The RNA samples were drawn from 76 de novo adult patients with AML and 30 healthy bone marrow donors. 15
E-GEOD-14924
Peripheral blood samples from newly diagnosed patients with AML were used to observe the effect of having AML on the patients’ T cells. The peripheral blood T cells from healthy volunteers served as a control to be compared with patients with AML. The study used CD8 and CD4 T cells in the experiment for both patients with AML and normal controls, resulting in four groups with 10 samples each. In our analysis, we took the 20 samples from CD4 T cells from patients with AML and normal controls. 16
E-GEOD-17054
Gene expression datasets were obtained from University of Michigan and Stanford University to study dysregulated pathways between normal bone marrow hematopoietic stem cells (HSC) and leukemic stem cells from patients with AML (AML LCC) samples. A set from Stanford University only was available and therefore included in our analyses, which contains nine AML LCCs and four normal HSCs. 17
E-MTAB-220
C133+ cell fractions were isolated from the bone marrow of 33 patients with AML and 10 healthy donors, and their transcriptional profiles were assessed with Affymetrix HG U133 Plus 2.0. The experiment had been initiated to assess the association of WNT/β-catenin signaling with AML. 18
E-GEOD-33223
Thirty peripheral blood mononuclear cell (PBMC) samples were included in an experiment that was aimed at observing the factors that influence the prognosis in CEBPA-mutated AML. The participants were categorized into three groups, ie, control patients (n = 10), AML patients with multilineage dysplasia (MLD, n = 9), and AML patients without MLD (n = 11). We regrouped the samples into AML and normal controls. 19
E-GEOD-35010
Short-term (ST-HSC) and long-term HSC (LT-HSC), as well as granulocytic monocytic and progenitors (GMP) from patients with AML were compared in gene expression to healthy controls. The gene expression data from the GMP were used in our analysis, with six patients in the AML group and six healthy controls. 20
E-GEOD-37307
Microarray gene expression experiment was carried out in 30 AML patients and 19 normal HSC donors to identify genes that were differentially expressed between those groups. The gene expression data were obtained either from cryopreserved mononuclear cells or from testis cells. We excluded the two samples that had been obtained from testis cells.
Step 2: Data preparation
We followed a common procedure in preprocessing raw gene expression datasets for further analysis.
Preprocessing data
Methods are widely available for the preprocessing steps, eg, normalization, background correction, and logarithmic transformation. The choices for preprocessing microarray gene expression data have been widely discussed in the literature.21,22 A different choice of preprocessing methods may lead to a different result. However, this particular issue will not be covered in this study. The investigator may choose preprocessing methods by familiarity, with good knowledge of their properties. In the practical example of our proposed SMA approach, we normalized the raw datasets by quantile normalization, performed background correction according to manufacturer's platform recommendation, and transformed the expression values to the log2 scale. 23 For the Affymetrix platforms, median polish was used as a summarization method of probes into probesets, to deal with outlier probes. 24
As is common in microarray studies, we also applied a filtering step to reduce the number of noninformative probesets. We only used detection call filtering to minimize the risk of excluding informative genes, ie, we retained all probesets whose log2 expression values were greater than 5 in at least 10% of the samples. The differentially expressed genes resulting from the SMA from filtered and nonfiltered data were then compared.
Gene annotation
Deciding the “objects” to be combined from multiple studies is another point to consider in pooling multiple studies, eg, combining expression values either at the probeset level or at the gene level. Due to the fact that different platforms may have different probeset names for the same genes, we mapped the probesets to the gene level to increase the agreement among the experiments. Since all the selected experiments had been performed on Affymetrix chips, we used the array-specific AffymetrixID by using the Bioconductor package (annotation packages: hgu133plus2.db, hgu133a.db, hugene10stprobeset.db, hugene10sttranscript-cluster.db, and hugene10stv1probe). 25 To deal with multiple probesets referring to the same gene, in each experiment we summarized the replicated genes by taking the median of their expression values. 6
Step 3: Sequential meta-analysis
In each individual dataset, we performed a differential expression analysis by fitting a linear model using “limma” in R 26 and controlling the false discovery rate at 5%, defined as the expected proportion of false rejection among the rejected hypotheses, using the Benjamini and Hochberg (BH) procedure. 27 The resulting differentially expressed genes (DEGs) from each study were compared between studies.
Next, we applied an SMA following Whitehead's boundaries approach for a double triangular test (TT). 28 Sequential design and analysis was originally developed to monitor results of a randomized clinical trial (RCT) in order to draw a conclusion when enough evidence is available. There, the patient is the unit of analysis. The method can also be applied on a higher level, in the setting of a meta-analysis, where the unit of analysis is the study. The method can also be applied to nonrandomized studies. The application of SMA to microarray experiments is challenging, in the sense that we are dealing with thousands of end points (expression value of genes) that are analyzed simultaneously, and far more complex than sequential analysis in the clinical setting, where we usually have a single end point.
As previously described, the SMA is applied to each and every single gene by testing the null hypothesis that the average expression value is equal between two groups against the alternative hypothesis that there is a certain difference in average expression values between two groups. For gene 


Construction of the double triangular test
The expression values of gene 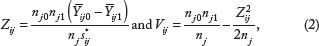

The newly adjusted Z and V are then defined as
The cumulative information from 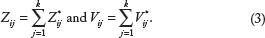
Cumulative (Z
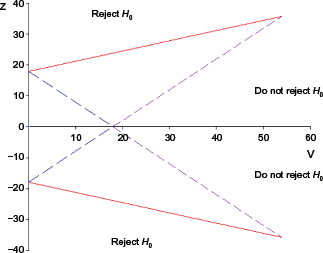
Example of a double triangular test (TT) that is designed by prespecified
A gene
For a practical example of our proposed approach, we only took fully replicated genes, ie, the genes that appeared in all experiments, in order to visualize the sample path in the TT plot more clearly. As a result, we analyzed 12,211 unduplicated genes sequentially in the nonfiltered datasets. The boundaries of the TT were constructed with
Results
The raw microarray gene expression datasets were collected from the ArrayExpress online repository by using the keywords

Pairwise comparisons of the differentially expressed genes in individual selected experiments. The number within each block represents the overlap of differentially expressed genes between two experiments, which is then represented by the color. The
Based on the cumulative information of the seven experiments that were evaluated by TT using Design 1, with prespecified parameters
The TTs for the two designs in nonfiltered datasets are summarized in Figure 4. The figures are dominated by the orange region, which implies more experiments are to be initiated in order to make a conclusion for the genes of interest, especially when Design 2 is used to construct the triangular test.

Heatmaps of the 12,211 fully replicated genes. The colors represent the status of each gene in sequential tests: orange, no decision can be made; red, do not reject the null hypothesis; white, reject the null hypothesis. The
We selected four genes, presented in Figure 5, to show the sample paths of cumulative evidence based on SMA for Designs 1 and 2. The sample paths for the two different designs are identical in pattern but they do differ in the moment the conclusion can be drawn, due to the fact that the TTs have wider boundaries for the Bonferroni-corrected design. Considering gene G55704 for instance, two experiments are enough to decide that the gene is informative when it is evaluated by a TT that was constructed with Design 1. Meanwhile, we need cumulated samples from six experiments in order to draw a conclusion when Design 2 is used to evaluate the gene.
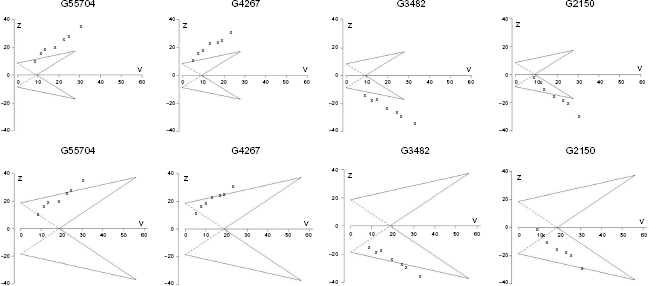
Triangular tests of four selected genes. The boundaries were constructed for a pre-specified effect size
We filtered genes with low expression values and took 7,455 genes that appeared in seven experiments. We then performed TTs by applying Design 1. The sequential analyses detected 202 genes as DEG, while 1,392 and 5,861 genes were classified as uninformative and undecided, respectively. When the boundaries of the TT were constructed by
Comparisons of the differentially expressed genes that were found with and without incorporating Bonferroni correction in the filtered and non-filtered gene expression data. The numbers represent the number of overlap differentially expressed genes between two different settings.

Discussion
This study has extended the application of SMA into the genomic field. We described and applied the proposed algorithm to find potential differentially expressed genes in AML by taking advantage of the public availability of gene expression datasets from published studies as suggested by the MIAME (Minimum Information About a Microarray Experiment) guideline. 37 The systematic search in the ArrayExpress online repository and manual screening resulted in seven microarray studies to be analyzed further. We followed a published recommendation 6 to conduct a meta-analysis in microarray gene expression data by downloading raw datasets in order to reduce the source of variation due to preprocessing procedures that might vary across experiments.
To the best of our knowledge, application of an SMA (following Whitehead's boundaries approach) to combine microarray gene expression studies has not yet been employed to detect differentially expressed genes. It is worth mentioning, however, that sequential analysis has been proposed in single microarray experiments for interim analysis. 38 An “ordinary” meta-analysis is also a well-known method to combine information from different experiments in genome-wide association studies (GWAS). As mentioned in Introduction, the goal of a meta-analysis is to estimate the effect size (or fold change, in case of differentially expressed gene analysis) without evaluating the adequateness of cumulative evidence to draw a conclusion. The SMA approach could also be a useful tool to decide whether more experiments are needed to draw a conclusion for each and every gene of interest, a property that an “ordinary” meta-analysis lacks.
The effect size described in Equation (1) is similar to the
The summaries of the TTs from the 12,211 genes show that almost all the genes need more than one experiment to be declared as either noisy or informative (Fig. 4). Further, the 271 samples from seven experiments are even not enough to draw a conclusion for 9,060 genes when evaluated by Design 1 and 10,994 genes by Design 2 in nonfiltered data. On the other hand, 274 and 55 genes are already classified as redundant genes by single experiments in Designs 1 and 2, respectively. This result also tells us that the signal of expression values differ across the genes. A gene may have a strong signal, so it is easy to be classified as an informative gene without involving a large sample size. Since microarray technology simultaneously measures thousands of genes, more experiments are needed to cumulatively gather information, particularly for indecisive genes.
Given the curse of dimensionality in microarray studies, filtering redundant genes is commonly applied in practice, eg, removing genes with low variations and/or low expression values. 40 The filtering procedure has a risk of excluding the informative genes when gene expression datasets are cumulated across experiments via SMA. This was clearly shown by the identification of some differentially expressed genes on nonfiltered data that were not found in the result of SMA on filtered data. The consequence is even more severe when hard filtering by removing genes with low expression and low variance is applied. Hence, we recommend avoiding any filtering procedure if the computational resources allow doing so.
We kept analyzing every gene until information from all experiments was gathered, although the sample paths for some genes had already crossed one of the TT's boundaries. With the common sequential design, the analysis can be stopped once the sample path crosses a boundary for reason of efficacy or futility. However, investigators might also continue the sequential analysis although the boundary is crossed, in order to optimize the available information, a condition called overrunning.28,41 In some genes, the overrunning analysis has as a consequence inconsistency in conclusions. We found genes that were declared noisy genes (non-differentially expressed genes) by TT once they crossed a lower boundary, but then turned out to be informative genes (differentially expressed genes) as more information was accumulated. The inverse case was also found, ie, informative genes became noisy genes when more studies were included. Although more information was gathered and the conclusion changed, the overall fraction of rejected null hypotheses was close to the predetermined type 1 error rate. We provided examples of genes that changed the conclusion when the overrunning analysis was performed (Fig. 6). We also noticed that the phenomenon of a switched conclusion happened only for the genes that had a sample path close to the inner boundary of the TT. We found no gene that crossed both upper and lower boundaries during the sequentially cumulated process.
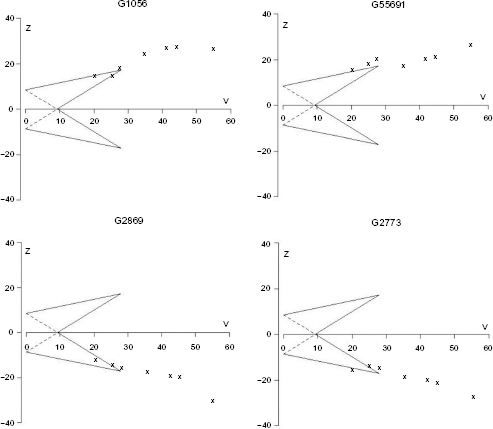
Triangular tests of four selected genes that have inconsistent conclusions. The boundaries were constructed for a relevant effect size
FMS-related tyrosine kinase 3 (FLT3) is an important gene in the development of AML. However, all designs in TTs could not classify FLT3 as being differentially expressed, since the selected cumulative samples could not provide enough information to make a conclusion for this particular gene (Fig. 7). Further, the selected studies15–20 also did not mention this particular gene as a potential biomarker for distinguishing patients with AML from normal healthy controls.

Triangular tests for the FLT3 gene. The boundaries were constructed for a prespecified effect size
The boundaries of a TT depend on prespecified parameters, namely the effect size, type I error rate, and statistical power. In this study, we used
Type 1 error is another crucial parameter in the determination of the boundaries of TT. We employed the conservative Bonferroni approach to correct for multiple testing, which depends on the number of tested genes. In the given example, we analyzed the genes that occurred in seven experiments. When a new study is available and Bonferroni correction is applied, the whole process of sequential analysis can be repeated if the investigator would like to include the fully replicated genes only in the analysis. When non-fully-replicated genes (ie, genes that appeared in less than seven experiments) are also included in the analysis, applying Bonferroni correction is most likely to change the conclusions for some previously evaluated genes, since the sequential design is also changed due to different levels of
The TT is one of a group of sequential methods. We specifically chose TT following Whitehead's boundaries approach. Other similar methods like the sequential probability ratio test (SPRT) may also be considered. With the same prespecified parameters, it is easier for the SPRT compared to the TT to detect the required effect size earlier in the sequential testing if the effect size is real or if no relevant difference exists. However, TT minimizes the maximum amount of information needed to come to a conclusion compared to the SPRT. We refer to van der Tweel and van Noord 42 for further details regarding the comparison of TT and SPRT particularly in the case–control study setting. We analyzed the gene expression data also by SPRT and found comparable results with the TT (results are not shown).
We tested gene expression values from different microarray experiments with a group sequential method. Further, we showed that the time to make a decision varies across the tested genes. This study shows the application of a sequential method in continuous outcome data. Such application may also be extended to count data (Poisson-distributed outcome data, such as in RNA sequencing) or survival outcome data.
Conclusion
We have shown that samples from one experiment are most likely not enough to classify a gene as informative or noninformative. This study showed a method to determine whether there is enough evidence at a certain time point to draw a conclusion for a particular gene or to hold the conclusion until the evidence is adequate to make conclusion for all the genes under study. SMA following Whitehead's boundaries approach offers an alternative method to find a gene signature list by evaluating the adequacy of the accumulated evidence.
Author Contributions
Conceived and designed the experiments: PWN, MJCE, IvdT. Analyzed the data: PWN. Wrote the first draft of the manuscript: PWN. Contributed to the writing of the manuscript: PWN, IvdT, VLJ, KCBR, MJCE. Agreed with the results and conclusions: PWN, IvdT, VLJ, KCBR, MJCE. Jointly developed the structure and arguments for the paper: PWN, MJCE, IvdT. Made critical revisions and approved final version: PWN, IvdT, VLJ, KCBR, MJCE. All authors reviewed and approved of the final manuscript.
Footnotes
Acknowledgments
The authors would like to thank to S Nikolakopoulos (Biostatistics and Research Support, Julius Center for Health Sciences and Primary Care, UMC Utrecht) for discussion about group sequential designs. They would also acknowledge the anonymous reviewers for their comments and constructive suggestions.