
Abstract
Introduction:
Pembrolizumab is widely used in advanced non-small-cell lung cancer (NSCLC) patients with positive programmed death-ligand 1 (PD-L1). However, efficacy evaluation along treatment by serial monitoring of circulating tumor DNA (ctDNA) using next-generation sequencing remained to be well studied.
Methods:
Nine PD-L1 positive advanced NSCLC patients were prospectively enrolled and received pembrolizumab monotherapy. Pretreatment tissue and/or plasma samples were collected as baseline reference. Serial plasma samples were collected after 3 and 6 weeks of treatment as well as at disease progression. All samples underwent targeted next-generation sequencing.
Results:
The median progression-free survival (mPFS) and median overall survival (mOS) were 4.43 and 25.53 months, respectively. In total, 3 patients achieved partial response (PR) or stable disease (SD) for more than 6 months and were thus classified into the durable clinical benefit (DCB) group, whereas the rest 6 were grouped as nondurable benefit (NDB) patients. Molecular profiling of baseline samples revealed that TP53 and APC were the 2 most frequently mutated genes in all patients, whereas POT1 and SETD2 mutations were enriched in DCB and NDB groups, respectively. Higher tumor mutational burden (TMB) was observed in DCB patients than NDB group. During serial ctDNA monitoring, 2 DCB patients showed a dramatic ctDNA reduction while 75% of NDB patients’ ctDNA concentration increased at week 6. Several acquired mutations might contribute to the pembrolizumab resistance, including CDKN2A frameshift and MITF nonsense mutations.
Conclusions:
Genomic profiling of peripheral blood samples can be applied to dynamically monitor disease progression. The reduction in ctDNA concentration during treatment implied DCBs.
Introduction
Immunotherapy is now broadly used to treat advanced non-small-cell lung cancer (NSCLC) patients with positive programmed death-ligand 1 (PD-L1) expression. The standard evaluation about immunotherapy efficacy is based on the imageological examination, which might be lagged to some extent due to its relatively low resolution. 1 Some imageologically undetectable tumors can be detected by circulating tumor DNA (ctDNA) sequencing during or after treatments.2,3 Lung cancer patients with positive ctDNA detection showed a higher risk of disease recurrence after curative surgery, 4 suggesting the great clinical potential application of serial ctDNA sequencing in dynamically monitoring disease progression.
Tumor mutational burden (TMB), the total number of somatic mutations in a tumor, is a widely studied and well-known biomarker for immune checkpoint inhibitors (ICIs) treatment in multiple cancer types, 5 such as advanced NSCLC, 6 metastatic melanoma, 7 and metastatic epithelial carcinoma. 8 However, the utility of tissue TMB (tTMB) is limited in some advanced cancers due to the unavailability of tumor tissue samples and high tumor heterogeneity. Considering its easy accessibility and repetitive sampling, blood TMB (bTMB) based on ctDNA sequencing of peripheral blood samples is now intensively investigated as an alternative to tTMB. 9 Molecular profiling of ctDNA by next-generation sequencing (NGS) has been reported to predict the efficacy of targeted therapies in various cancer types.10 -13
Pembrolizumab, a humanized antibody for immunotherapy, was firstly approved by Food and Drug Administration (FDA) for advanced melanoma in 2014. 14 For advanced NSCLC patients, pembrolizumab was approved as a second-line treatment (PD-L1 expression ⩾ 1%) in 2015 and became the first-line therapy in 2016 for patients with PD-L1 expression over 50% and without EGFR or ALK aberrations. 15 However, the early efficacy evaluation of pembrolizumab treatment by ctDNA sequencing is poorly investigated. Accordingly, we prospectively enrolled 9 advanced NSCLC patients receiving pembrolizumab monotherapy and collected plasma samples at pretreatment, week 3, week 6, and after progression, which all underwent targeted NGS. Molecular profiling revealed the association between baseline TMB and clinical benefit duration as well as the potential role of serial ctDNA sequencing as an early evaluation tool of pembrolizumab efficacy.
Materials and Methods
Patients’ recruitment and sample collection
A total of 9 patients with advanced NSCLC admitted to the Northern Jiangsu People’s Hospital between April 2016 and June 2018 were recruited in this study. Inclusive criteria are as follows: stage IIIB or IV confirmed by cytology or histological pathology; NGS-confirmed negative EGFR genetic alterations; negative ALK immunohistochemistry (IHC) and/or fluorescence in situ hybridization (FISH); positive PD-L1 IHC (PD-L1 IHC 22C3 pharmDx IHC kit; Dako Autostainer Link 48; Tumor Proportion Score [TPS] ⩾ 1%); patients above 18 years of age; the Eastern Cooperative Oncology Group (ECOG) scores 0 or 1; no recent infection, trauma, or immune-related diseases; and not in the use of immune-regulatory drugs. Both treatment-naïve and first-line chemotherapy failed patients were included. Patients with other types of tumors, cardiovascular and cerebrovascular diseases, mental illness, and pregnancy or lactation were excluded. The study was conducted in accordance with the Declaration of Helsinki and approved by the Ethics Committee of the Northern Jiangsu People’s Hospital (Approval: ID2016008). All enrolled patients had signed informed consents.
Sample collection and the evaluation of clinical efficacy
Peripheral blood of 5 to 10 mL was collected at pretreatment, week 3, week 6, and at the time of drug resistance. Plasma was extracted within 2 hours after blood collection and transported to the central testing laboratory within 48 hours. Pretreatment formalin-fixed paraffin-embedded (FFPE) section or tumor biopsy tissue was obtained at the hospital to confirm diagnosis and tumor purity by pathologists. Computed tomographic (CT) scans were performed at baseline and every 9 weeks during treatment to track the changes in tumor lesion size and evaluate efficacy. Progression-free survival (PFS) was measured from treatment initiation to disease progression or death, whichever occurred first. Objective response rate (ORR) was defined as the percentage of patients with complete response (CR) or PR evaluated by Response Evaluation Criteria in Solid Tumors (RECIST) version 1.1. Durable clinical benefit (DCB) was CR, PR, or stable disease (SD) lasting more than 6 months. No durable benefit (NDB) was defined as SD less than 6 months or disease progression.
Targeted panel NGS
Genomic DNA was extracted from fresh tissue and FFPE samples using the DNeasy Blood & Tissue kit (Qiagen) and QIAamp DNA FFPE Tissue Kit (Qiagen) according to the manufacturer’s protocols. Cell-free DNA (cfDNA) was extracted using the NucleoSpin Plasma XS kit (Macherey-Nagel). Sequencing libraries were prepared using the KAPA Hyper Prep kit (KAPA Biosystems) and then sequenced on Illumina MiSeq or HiSeq4000 NGS platforms (Illumina) as described previously. 16 Trimmomatic was used for FASTQ file quality control (QC). 17 Reads from each sample were mapped to the reference sequence hg19 (Human Genome version 19) using Burrows-Wheeler Aligner (BWA-mem, v0.7.12). The Genome Analysis Toolkit (GATK; https://software.broadinstitute.org/gatk/) was applied to detect germline mutations from blood control samples. VarScan2 was employed for the detection of somatic mutations. 18 Genomic fusions were identified by FACTERA with default parameters. 19 Copy number variations (CNVs) were detected using ADTEx (http://adtex.sourceforge.net). For the ctDNA monitoring, relative ctDNA abundance was calculated by multiplying max ctDNA allele frequency (AF) by cfDNA concentration (ng/mL). 20 ctDNA concentration (haploid genome equivalents per mL, hGE/mL) was calculated based on the assumption that each haploid genomic equivalent weighs 3.3 pg with the following formula: mean ctDNA AF × cfDNA concentration (pg/mL) ÷ 3.3 as described previously. 21
Statistical analysis
Median progression-free survival (mPFS) was estimated by the Kaplan-Meier approach. The correlation analysis was calculated by Spearman correlation analysis. A P value less than .05 is considered statistically significant. SPSS 19.0 statistical software was used for data analysis (https://www.ibm.com/spss/statistics).
Results
Clinical characteristics and survival analysis of patients
A total of 9 PD-L1 positive advanced NSCLC patients were prospectively enrolled in the Northern Jiangsu People’s Hospital between April 2016 and June 2018. As shown in Table 1, 4 of them were diagnosed with adenocarcinoma (ADC) and the rest 5 were squamous cell carcinoma (SCC). Most of the patients (7 of 9, 78%) were stage IV. More male patients (8 of 9, 89%) were included in this study with a median age of 66 years, ranging from 63 to 77 years. The ECOG performance score of 8 patients was 1, and 1 stage IV patient was assessed with the ECOG score of 0. Two thirds reported a smoking history. However, 6 patients received pembrolizumab monotherapy as the first-line treatment and the rest 3 patients took pembrolizumab after progressing on the first-line platinum-based chemotherapies. The median follow-up period was 20 months, ranging from 3 to 38 months.
Clinical characteristics of the cohort.

Abbreviations: ADC, adenocarcinoma; DCB, durable clinical benefit; ECOG, Eastern Cooperative Oncology Group; NDB, nondurable benefit; PD, progressed disease; PR, partial response; SCC, squamous cell carcinoma; SD, stable disease.
The mPFS and the median overall survival (mOS) were 4.43 and 25.53 months, respectively. However, 3 patients achieved PR after pembrolizumab treatment, whereas 4 patients remained as SD. The remaining 2 patients progressed slowly since the treatment initiation. Although these 2 patients were initially identified as SD (increase < 20%) based on their first follow-up at week 9, they were later on re-evaluated as progressed diseases (PDs) in consideration of the overall treatment period. The changes in target lesions since treatment initiation of all patients were shown in Figure 1A. Based on their best clinical response and the length of response to pembrolizumab, patients were then divided into the DCB group (N = 3) who achieved PR or SD for more than 6 months and the nondurable benefit (NDB) group (N = 6) whose disease progressed or remained stable for less than 6 months (Figure 1B).

Clinical characteristics of tumor response to pembrolizumab. (A) Spider plot shows the percent changes in target lesions from baseline. The end symbol of each curve represents the stop event of follow-up (square: termination due to disease progression; star: death). The end symbols are colored based on the individual. The color of the curves shows the best response of each patient. (B) The best response from the baseline of each patient was shown. Horizontal dashed lines indicate the progressive disease and PR according to the RECIST, version 1.1. DCB patients are colored in orange who achieved PR or SD for more than 6 months. NDB patients are shown in blue. DCB indicates durable clinical benefit; NDB, nondurable benefit.
Genetic profiles of baseline samples
Baseline samples were collected from 8 patients and 5 of them had paired tissue and plasma samples. The rest 3 patients had only tissue (N = 2) or plasma samples (N = 1). Through a panel NGS targeting 425 cancer-related genes, the genetic alterations at baseline were analyzed (Figure 2A). TP53 was the most frequently mutated gene, followed by APC and NFE2L2. According to the oncoKB database, 4 TP53 missense mutations were likely oncogenic, whereas the other TP53 alterations, including nonsense and frameshift, may also cause TP53 loss-of-function. Notably, POT1 and SETD2 mutations were exclusively enriched in the DCB and NDB groups, respectively (Figure 2A).

Mutational profiles of baseline and PD samples. (A) The concurrent genomic alterations of baseline samples are shown in the oncoprint plot. The mutational profile of tissue samples is chosen to show here when both tissue and plasma samples are available for patients. The clinical characteristics of each patient are indicated by the black/white boxes on the top panel. Data from P3 are not shown due to the negative result in ctDNA detection from the baseline plasma sample and the unavailability of the baseline tissue sample. (B) The number of detected mutations for 5 patients with paired baseline tissue and plasma samples is shown. (C) A total of 4 patients with paired samples at baseline and after PD are analyzed. Of these, 3 of them had paired plasma samples for comparison while the baseline plasma sample was not available for P1. The concurrent mutations detected from each sample are shown by the oncoprint plot. (D) The number of mutations that were maintained, lost, or acquired after PD was shown on the top panel. PD indicates progressive disease.
By analyzing the 5 paired baseline tissue and plasma samples, we found a relatively good correlation between the 2 sample types. A total of 48 and 46 mutations were detected in tissue and plasma, respectively. However, 64.9% (37/57) of all mutations were shared in both sample types. Specifically, the number of shared, tissue-only, and plasma-only mutations for the 5 patients was shown in Figure 2B and the shared mutations were nearly or more than half in all 5 patients.
Furthermore, as TMB could be related to drug response, we tested it by calculating the TMB scores of all baseline samples. We observed relatively high levels of both blood TMB (bTMB) and tissue TMB (tTMB) in 2 DCB patients (Figure 3A). A moderate positive correlation between bTMB and tTMB was observed (Spearman correlation analysis rs = 0.45). Then we investigated the association between drug response and baseline TMB. As shown in Figure 3B, both tTMB and bTMB were higher in the DCB group. The difference between DCB and NDB groups in bTMB was statistically significant (P = 0.002), despite the number of patients was relatively small. Moreover, 10 mutants/Mb were chosen as the cut-off of high and low TMB as suggested by FDA. 22 Consistent with the previous study, 5 we also observed a trend of prolonged PFS and OS in the high tTMB group than the low tTMB group (Figure 3C and D). Of note, a similar trend was observed in high bTMB vs low bTMB patients, and bTMB seems to better stratify patient prognosis than tTMB (Figure 3C and D vs Figure 3E and F). Nevertheless, due to the restricted cohort size, neither tTMB nor bTMB reached statistical significance and the results need to be validated in future large cohort studies.

Baseline bTMB and tTMB are correlated. (A) The dot plot shows the bTMB and tTMB from 5 patients with paired baseline plasma and tissue samples. The Spearman correlation analysis indicates a medium positive correlation (rs = 0.45). (B) TMB values of all available baseline samples are grouped based on their clinical response duration (DCB or NDB). High bTMB is significantly enriched in DCB group with a P-value of .002 while the difference of tTMB between DCB and NDB is not statistically significant (P = .21). (C-F) Survival analysis (PFS: progression-free survival and OS: overall survival) of patients with high or low tTMB and bTMB. Moreover, 10 mutants/Mb were chosen as the cut-off of high and low TMB. Due to the restricted sample size, statistical analysis results are not significant. DCB indicates durable clinical benefit; NDB, nondurable benefit.
Serial ctDNA profiling to monitor pembrolizumab response
To check if the serial ctDNA profiling using targeted NGS could monitor pembrolizumab responses earlier than imageological examinations, we collected plasma samples at week 3, week 6, and postprogression, and dynamically monitor the changes of ctDNA along with treatment. In total, 6 patients, including 2 in the DCB group and 4 in the NDB group, had matched baseline, week 3, and week 6 plasma samples. We analyzed the maximum ctDNA AF, relative ctDNA abundance, and ctDNA concentration for these matched samples (see “Material and Methods” section for definition and calculation). As shown in Figure 4A to C, the 2 DCB patients showed early and sustained responses to pembrolizumab, alongside dramatic decreases in their ctDNA levels, which showed no increase until the time of disease progression (at least 6 months after treatment). In contrast, 3 of the 4 NDB patients experienced an initial decrease in ctDNA levels at week 3 and then rapidly increased at week 6, which implied the non-DCB of pembrolizumab treatment in these patients. The fourth NDB patient with continuous disease progression showed an increase in ctDNA measurements as early as week 3 (Figure 4A to C). These observations indicated ctDNA level is anticorrelated with the response to pembrolizumab. The plasma samples were collected after disease progression in 3 patients. As expected, maximum ctDNA AF, relative ctDNA abundance, and ctDNA concentration were all dramatically increased on disease progression (Figure 4A to C). Of note, patients with decreased ctDNA concentration at week 6 tended to have a longer PFS than those with increased ctDNA concentration (mPFS 8.37 vs 4.19 months, P = .1), suggesting the correlation between dynamic changes of ctDNA concentration after treatment and immunotherapy prognosis (Figure 4D).
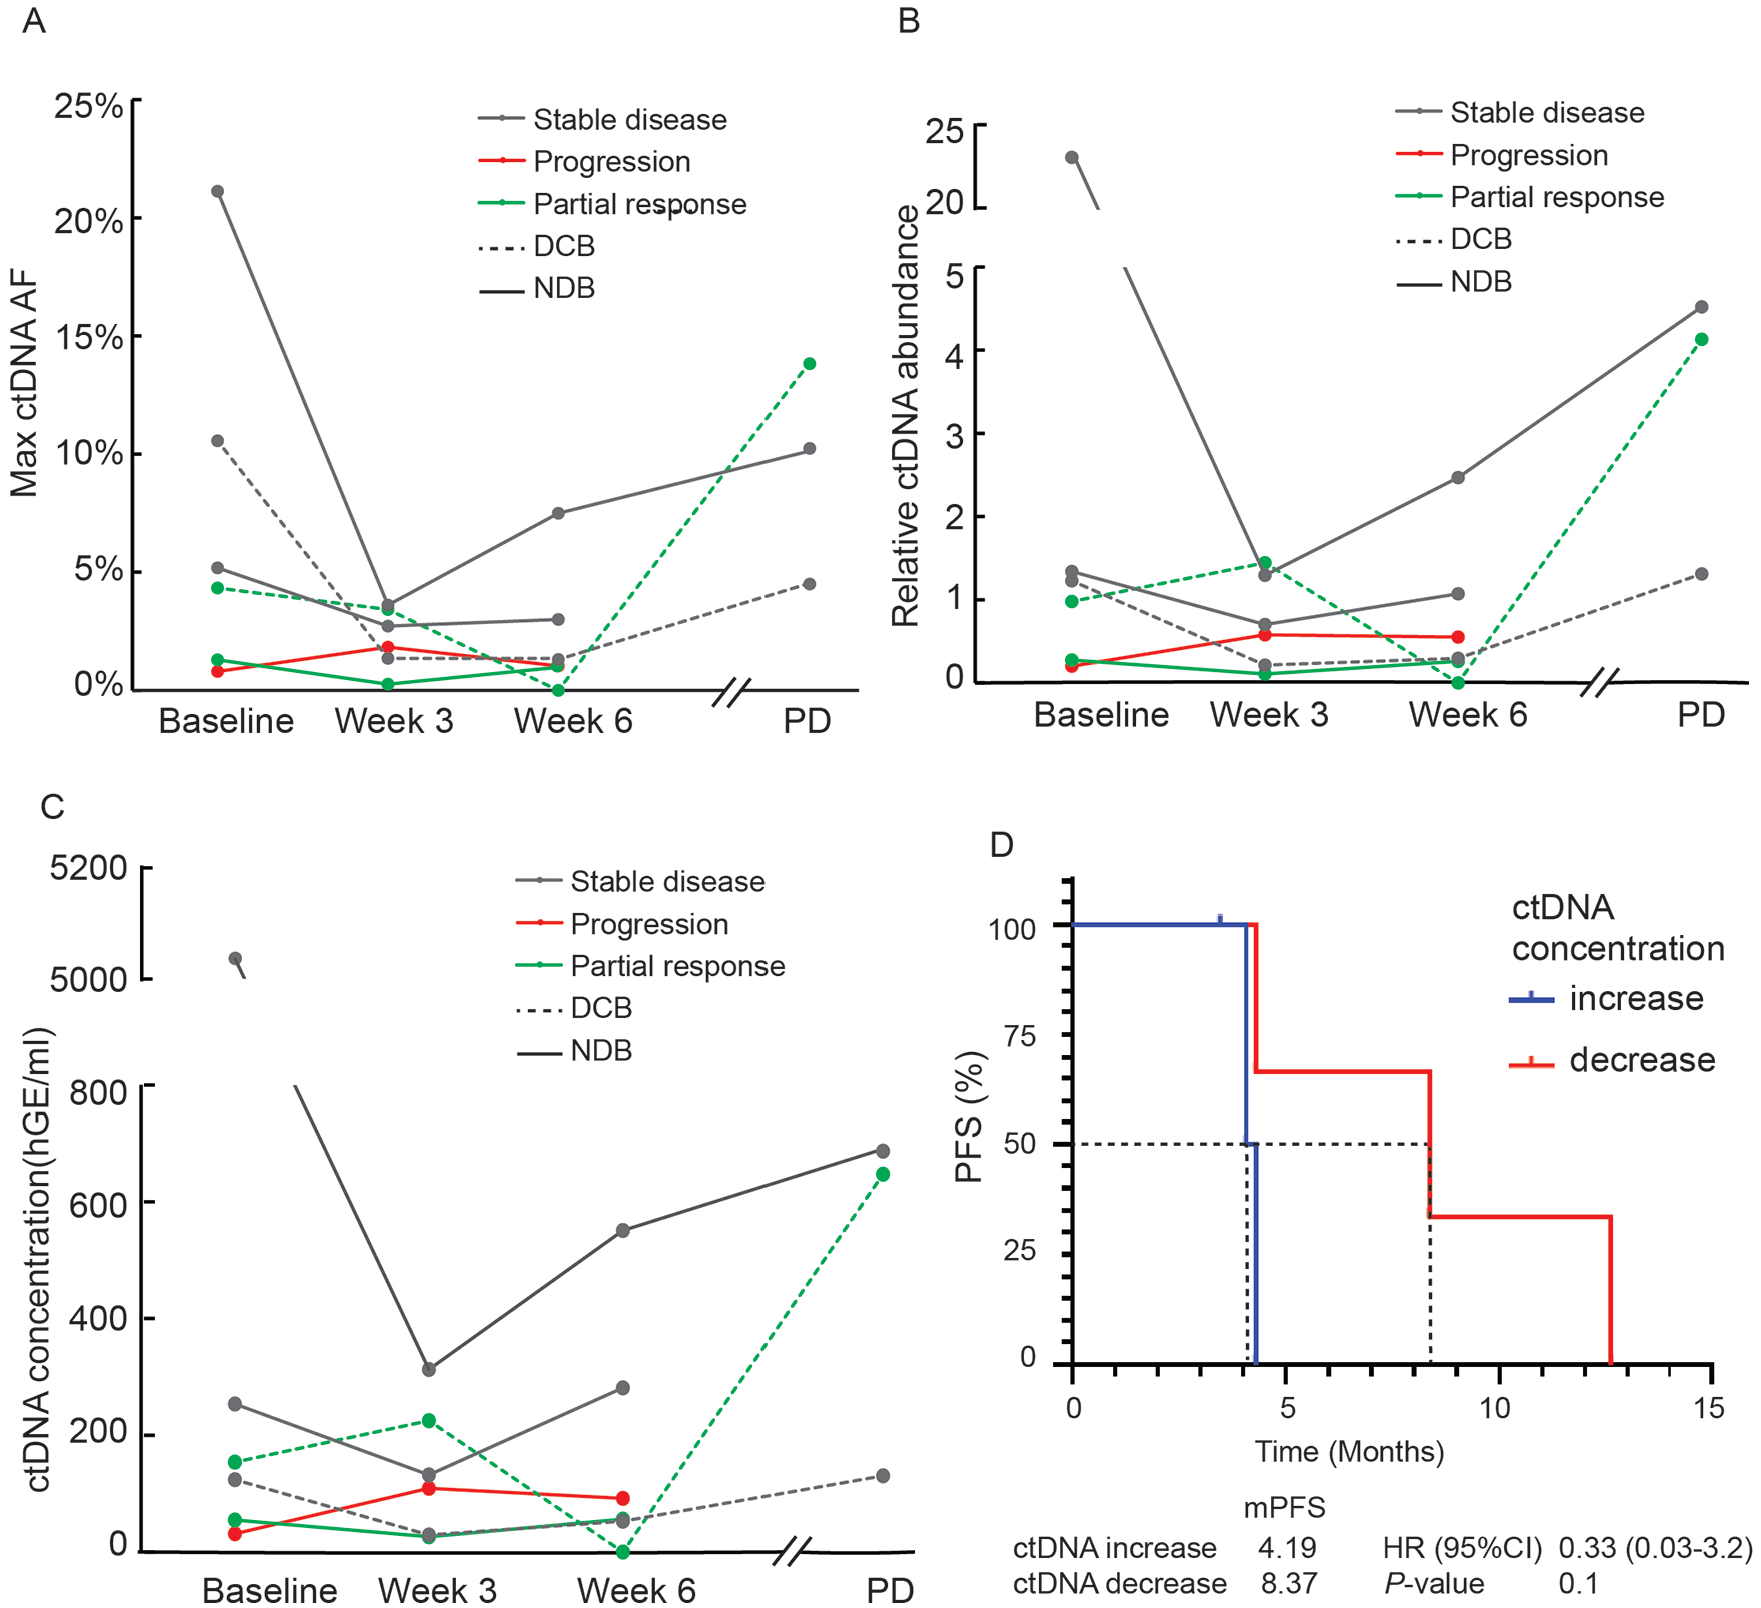
Measurements of ctDNA dynamics could monitor disease progression. (A) Max ctDNA AF, (B) relative ctDNA abundance, and (C) ctDNA concentration of 6 patients’ plasma samples collected at baseline, 3 and 6 weeks after pembrolizumab treatment are shown. Three of them also had plasma samples collected after PD. The calculation of relative ctDNA abundance and ctDNA concentration is described in the “Materials and Methods” section. (D) The patients are subgrouped based on the changes of ctDNA concentration at week 6 from baseline. The patients with decreased ctDNA concentration at week 6 tended to have prolonged PFS. DCB indicates durable clinical benefit; NDB, nondurable benefit; PD, progressive disease.
Genetic profile comparison between baseline and postprogression samples
To study the potential resistant mechanism of immunotherapy, we closely compared the genetic profiles of the 4 pairs of baseline and postprogression samples. Except for 1 patient (P1) with identical mutational profiles at baseline and after PD, the other 3 patients maintained most mutations detected at baseline and acquired 4 to 7 new alterations during the immunotherapy, which might contribute to the resistance to pembrolizumab (Figure 2 C and D). In total, 16 new mutations were detected in postprogression samples and 42 out of the 45 alterations were maintained throughout the treatment. More specifically, the acquired mutations included cell cycle–related gene CDKN2A, DNA damage repair (DDR)-related pathway genes BRIP1, POLE, and MGMT, PIK-mTOR signaling gene MTOR, and transcription factor MITF (Figure 2C).
Discussion
In this study, a total of 9 advanced NSCLC patients were prospectively recruited to investigate the application of serial ctDNA profiling to evaluate pembrolizumab monotherapy efficacy and their molecular profiles. We reported an ORR of 33% (3 of 9), which was comparable with a previous clinical trial, KEYNOTE-024, whose ORR of the pembrolizumab group was 45%. 23 Furthermore, in Keyfigure-001 study, 24 the mPFS of 394 advanced NSCLC patients treated with pembrolizumab was 3.7 months and was improved to 6.3 months for patients with PD-L1 expression more than 50%. All patients enrolled in this study were PD-L1 positive (>1% but <50%) and thus we observed a slightly shorter mPFS (4.43 months).
The major limitation of this study is the relatively small cohort size, which may lead to analytic bias. Although it is relatively hard to achieve solid conclusions solely based on the restricted cohort, our study conveyed valuable information about the function of plasma ctDNA profiling. First, the moderate correlation between tTMB and bTMB in this study (rs = 0.45) was consistent with a previous large cohort study where they reported a Spearman rank correlation score of 0.64. 9 Second, we found that bTMB performed better than tTMB when reflecting pembrolizumab efficacy. A previous study 25 using whole-exon sequencing (WES) showed an association between better pembrolizumab efficacy and higher tTMB. However, some other researchers have pointed out that tTMB could not well represent the intra-tumor and inter-tumor heterogeneity. 26 Third, we detected an ALK fusion using NGS in 1 patient (P5) who was both ALK IHC- and FISH-negative when admitted to the study. It is possible due to the false negative of IHC/FISH tests or the tumor heterogeneity suggesting that NGS could overcome this limitation with comprehensive capability.
In addition, we reported 2 mutations, POT1 and SETD2, were exclusively enriched in the DCB and NDB group, respectively. Preclinical studies suggested a connection between POT1 mutations and genome instability27,28 which might be a clue of the durable response to immunotherapy observed in the DCB group. The oncogenesis function of POT1 abnormalities has been reported in multiple cancer types. 27 However, the clinical evidence of POT1-mutated patients responding well to pembrolizumab treatment is worth exploring in larger cohorts. However, SETD2 mutation was identified as a predictor of poor prognosis in early-stage lung ADC 29 which was also consistent with the reported recurrence in NDB group. To validate this observation, a public dataset with 204 NSCLC patients who received PD-(L)1 monotherapy was analyzed. 30 SETD2 missense mutations were detected in 8 patients and 7 of them were identified as NDB. Although the statistic analysis result did not reach significance due to the relatively low frequency, the enrichment of SETD2 mutation in the NDB subgroup was consistent with our study.
Furthermore, we showed the great potential of ctDNA changes to be a biomarker for monitoring immunotherapy responses. In addition, other groups reported the function of ctDNA in predicting ICI efficacy based on ctDNA-determined hypermutation status and chromosome instability.31,32 Several acquired mutations were detected in the plasma samples collected postprogression, and some of them have been reported to convey immunotherapy resistance. Among them, CDKN2A mutation was previously identified as a predictor of immunotherapy resistance in late-stage NSCLC. 33 In addition, MITF is a well-known oncogene of melanoma, whose suppression could lead to the resistance of immunotherapy. 34 We found a nonsense mutation of MITF in 1 patient after progression on pembrolizumab which might be the acquired resistance mechanism.
Conclusions
In summary, we reported that genomic profiling of peripheral blood samples can be a good surrogate for tissue biopsy to dynamically monitor disease progression for pembrolizumab-treated advanced NSCLC patients. Both higher bTMB and decreased ctDNA concentration reflected DCBs. However, the detailed mechanisms of immunotherapy resistance remained to be investigated in the future.
Footnotes
Acknowledgements
The authors thank the patients and family members who gave their consent on presenting the data in this study, and the investigators and research staff involved in this study. They also thank Dr Qiuxiang Ou for her critical comments on the article.
Funding:
The author(s) disclosed receipt of the following financial support for the research, authorship, and/or publication of this article: This work was supported by the Science and Technology Bureau Fund of Jiangsu Province (Grant No. LGY2017027) and the Science and Technology Bureau Fund of Yangzhou City (Grant No. YZ2019057).
Declaration of conflicting interest:
The author(s) declared the following potential conflicts of interest with respect to the research, authorship, and/or publication of this article: YM, YX, and XW are employees of Nanjing Geneseeq Technology Inc., Nanjing, Jiangsu, China. The remaining authors have no competing interests to declare.
Author Contributions
BW and LZ contributed to the study conceptualization and administrative support; XW, LL, and YW are responsible for the provision of study patients; YF, LL, YH, and YL contributed to the collection and assembly of data; YF, YM, YX, and XM performed data analysis and interpretation. All the authors are responsible for the writing of original draft, review, and editing. All the authors contributed to and approved the article.
Data Availability Statement
The data that support the findings of this study are available from the corresponding author on reasonable request.
Ethical Approval
The authors state that they have obtained approval from the Ethics Committee of Northern Jiangsu People’s Hospital (Approval: ID2016008). In addition, written informed consent has been obtained from the participants involved.