
Abstract
Background:
To investigate the association between melatonin levels and bone mineral density (BMD) in postmenopausal women with type 2 diabetes mellitus (T2DM).
Methods:
One hundred and ninety postmenopausal women who visited the clinic between September 2023 and September 2024 were selected and divided into 4 groups according to their disease status: the normal group (n = 45); the abnormal bone mass group (n = 43); the T2DM group (n = 46); and the T2DM with abnormal bone mass group (n = 56). Relevant glycolipid metabolism biochemical indexes, bone metabolism markers and melatonin levels were detected and statistically analyzed.
Results:
Comparison of melatonin levels showed that melatonin levels were significantly lower in the abnormal bone mass group, the T2DM group, and the T2DM with abnormal bone mass group [100.00 (94.00, 110.00), 99.00 (91.75, 100.25), and 92.50 (84.75, 99.00)] than in the normal group [127.71 (116.23, 137.68)], and melatonin levels were the lowest in the T2DM with abnormal bone mass group (P < .01). Melatonin levels were positively correlated with both lumbar spine L1 to L4 BMD and femoral neck BMD. T2DM differed in the role of melatonin in associating with BMD at different sites. For lumbar spine L1 to L4 BMD, the mediating effect of T2DM was not significant (percentage: −8.16%, 95% CI, −90.39 to 57.00), and for femoral neck BMD, T2DM played a significant mediating role, with its effect accounting for 33.95% (95% CI, 5.38-70.00) of the total effect. Receiver operating characteristic (ROC) curve analysis showed that the area under the curve (AUC) of the operating characteristics of subjects with melatonin levels diagnosing osteoporosis (OP) was 0.942 (95% CI, 0.902-0.982). The optimal cut-off value was 124.29 pg/mL when the Jordon index was 0.571, corresponding to a sensitivity and specificity of 57.8% and 99.3%, respectively. Multiple linear regression analysis showed that a decreased melatonin level was a risk factor for decreased BMD.
Conclusion:
Lower serum melatonin levels in postmenopausal women with T2DM are an independent risk factor for decreased BMD, and T2DM partially mediates the protective effect of melatonin on femoral neck BMD. Serum melatonin levels have a specific diagnostic value for abnormal bone mass in postmenopausal women with T2DM.
Plain Language Summary
Why this study? The incidence of type 2 diabetes mellitus (T2DM) and osteoporosis (OP) is increasing every year, but the pathogenesis remains unclear. Melatonin is thought to be associated with T2DM and OP. Therefore, the aim of this study was to assess the association between melatonin levels and bone mineral density (BMD) in postmenopausal women with T2DM. What did the researchers do? This case-control study collected data from 190 postmenopausal women categorized into the normal group (n=45), the abnormal bone mass group (n=43), the T2DM group (n=46), and the T2DM with abnormal bone mass group (n=56). Baseline data and biochemical parameters were collected. BMD was measured using dual-energy X-ray absorptiometry, melatonin levels were determined using enzyme-linked immunosorbent assay (ELISA), and mediation analysis was performed using R-package mediation. Data were analyzed using SPSS 27.0 software. What did the researchers find? Lower serum melatonin levels in postmenopausal women with T2DM are an independent risk factor for decreased BMD, and T2DM partially mediates the protective effect of melatonin on femoral neck BMD. Serum melatonin levels have a specific diagnostic value for abnormal bone mass in postmenopausal women with T2DM. What do these findings mean? Lower levels of melatonin are strongly associated with abnormal bone metabolism in postmenopausal T2DM patients, and lower levels are an important risk factor for decreased BMD. The protective effect of melatonin on bone may be site-specific, and its positive effect on femoral neck BMD is partly mediated by modulating the pathological process of T2DM. Therefore, regular monitoring of melatonin levels in postmenopausal women with OP risk factors may help to identify early bone loss and slow its progression.
Introduction
Type 2 diabetes mellitus (T2DM) is a metabolic disease characterized by chronic poor glycemic control, which not only significantly reduces the quality of patients’ survival, but also imposes a huge socioeconomic burden. According to the International Diabetes Federation (IDF), about three-quarters of the world’s diabetes patients live in low- and middle-income countries. China has one of the highest diabetes prevalence rates and health expenditures in the world. 1 Osteoporosis (OP) is a systemic skeletal disease characterized by decreased bone mineral density (BMD) and destruction of bone microarchitecture, which is manifested by significantly increased bone fragility and fracture risk, 2 in which BMD responds to the amount of bone minerals per unit volume and bone microarchitecture refers to the microscopic architecture of tissues, such as trabecule. A systematic review and meta-analysis covering all types of diabetic patients showed that OP is a common complication in diabetic patients with a combined prevalence of about 27.67%. 3 Estrogen is a female steroid hormone that fluctuates with the menstrual cycle and not only regulates reproductive function, but is also involved in the maintenance of a wide range of metabolic homeostasis, including bone, lipids, and glucose. 4 In postmenopausal women, the precipitous drop in estrogen levels is a central driver in disrupting bone metabolic homeostasis and triggering postmenopausal osteoporosis (PMOP). When T2DM coexists with the menopausal state, hyperglycemia and estrogen deficiency together form a complex background of bone metabolic abnormalities, making this population particularly at risk for bone health.5,6 The mechanisms by which T2DM leads to decreased BMD and increased fracture risk are complex and center on long-term hyperglycemic toxicity and the cascade of responses it triggers. Persistent hyperglycemia promotes the production of advanced glycosylation end products (AGEs) and activates signaling pathways such as protein kinase C (PKC). 7 These pathologic changes underlie both diabetic microangiopathy (eg, retinopathy, nephropathy) and macrovascular complications (eg, atherosclerosis), 8 as well as impairing the skeletal microcirculation and interfering with bone reconstruction. 9 In addition, insulin resistance, which is prevalent in patients with T2DM, is key in linking risks to the skeletal and cardiovascular systems, both by impairing osteoblast function and inhibiting bone formation, as well as promoting endothelial dysfunction and atherosclerosis. 10 At the same time, dysfunction of adipose tissue and imbalances in its secretion of adipokines combine to exacerbate a chronic inflammatory state. 11 This inflammatory environment not only elevates cardiovascular risk but also directly disrupts the functional balance between osteoblasts and osteoclasts, which together exacerbate bone loss. 12 Although the association mechanism between T2DM and OP has been partially elucidated, at the clinical level, ideal biomarkers for early identification of bone mass abnormality in postmenopausal patients with T2DM are still lacking. BMD is inconvenient and non-dynamic to detect, and serum markers of bone metabolism are lacking in disease specificity. Therefore, the search for a novel biomarker that can sensitively reflect the interaction between glucose metabolism and bone metabolism has become the focus of current research, which also provides a direction for exploring the regulatory role of pleiotropic hormones.
Melatonin, an indole-like hormone secreted by the pineal gland, has been widely studied for its core mechanism of action as a sleep hormone that regulates circadian rhythms. Melatonin is widely involved in the regulation of glucose metabolism and bone metabolism and is a key regulator linking circadian rhythm and metabolic homeostasis.13,14 In the regulation of glucose metabolism, the role of melatonin has a significant circadian rhythm dependence. Studies have confirmed that elevated melatonin levels at night can inhibit insulin secretion by binding to the melatonin receptor MTNR1A/MTNR1B on the surface of pancreatic β-cells, thereby affecting glucose metabolism. 15
In the regulation of bone metabolism, melatonin can act directly on osteoblasts and osteoclasts to promote bone formation and inhibit bone resorption through the regulation of classical signaling pathways, such as Wnt/β-catenin and RANKL/OPG, thereby maintaining bone homeostasis. 16 Melatonin combines powerful antioxidant and anti-inflammatory properties, which enables it to attenuate the aforementioned oxidative stress and chronic inflammation damage to bone in T2DM. 17
Currently, although the role of melatonin in simple OP and T2DM has been reported, there is a lack of studies directly focusing on postmenopausal T2DM combined with bone mass abnormality, a high-risk group. Therefore, the aim of this study was to determine and compare serum melatonin levels in different glycemic and bone mass subgroups in postmenopausal women, analyze its correlation with bone metabolic indexes and disorders of glucose and lipid metabolism, use mediation analysis to explore the role of T2DM in the association between melatonin and BMD, and evaluate its diagnostic value, with the aim of providing a theoretical basis for the early prevention and treatment of this high-risk group.
Methods and Materials
Research Subjects
One hundred ninety postmenopausal women who attended the First Affiliated Hospital of Shihezi University from September 2023 to September 2024 were selected as study subjects.
Inclusion Criteria
Postmenopausal women (natural menopause ⩾ 1 year); (II) T2DM diagnostic criteria were based on the China Diabetes Prevention and Control Guidelines (2024 edition) 18 ; (III) OP diagnostic criteria were based on the Primary Osteoporosis Diagnostic and Treatment Guidelines (2022). 19
Exclusion Criteria
(I) Type 1 diabetic patients; (II) Use of drugs or supplements that may affect bone metabolism (eg, melatonin, glucocorticoids, etc.) within the last 6 months; (III) Those with a combination of severe insufficiency of vital organ function (eg, hepatic and renal insufficiency, etc.); (IV) Those with a history of any malignant tumor; (V) Menopause due to loss of ovarian function caused by surgery or radiotherapy; (VI) Missing or inaccurate clinical information, etc.
Methods
Detection of Biochemical Indicators
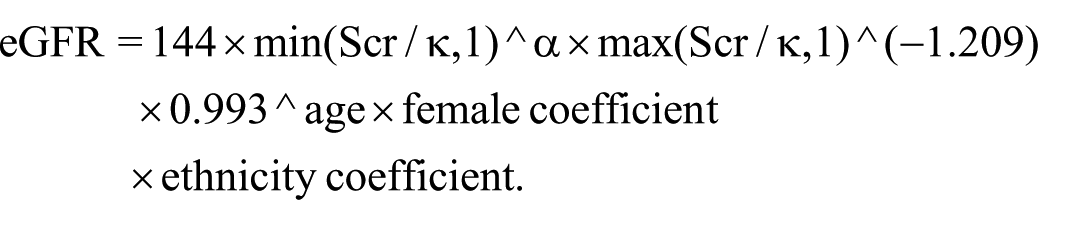
Baseline information (eg, age, years of menopause, body mass index (BMI), and waist-to-hip ratio (WHR)) was collected and recorded for all subjects. After subjects fasted for 10 hours, elbow venous blood (10 mL) was drawn on an overnight fasting basis and divided into 2 tubes (5 mL each) for processing. One tube was placed in a serum separator tube containing procoagulant, centrifuged at 3500 r/min for 10 minutes at 4°C, and the upper layer of serum was aspirated and used for the detection of fasting glucose (FPG), triglycerides (TG), high-density lipoprotein (HDL-C), low-density lipoprotein (LDL-C), calcium (Ca), phosphorus (P), alkaline phosphatase (ALP), uric acid (UA), creatinine (Cr), and other indexes. Triglyceride-glucose index (TyG), triglyceride-glucose index-body mass index (TyG-BMI), triglyceride-glucose-waist circumference index (TyG-WC), uric acid/creatinine (UA/Cr) ratio, and estimated glomerular filtration rate (eGFR) were obtained by calculation based on the results of the above tests. Another tube of blood sample was placed in an EDTA anticoagulation tube for glycated hemoglobin (HbA1c) assay. The sample was stored at 4°C under refrigerated conditions for a short period of time (⩽72 hours) and was transported in a refrigerated box with a low-temperature transit time of no more than 24 hours. The whole process avoided violent shocks to prevent hemolysis of the sample caused by the rupture of erythrocytes.
Measurement of Serum Melatonin
Collect 5 mL of blood from the elbow vein after fasting for 10 hours, put it into a dry blood collection tube without anticoagulant, let it stand for 30 minutes at room temperature, then centrifuge it at 3000 r/min for 15 minutes at 4°C, collect the upper layer of serum, and then divide the serum into sterile EP tubes, 1 mL in each tube, and then put them into a −80°C ultra-low-temperature freezing refrigerator for spare parts after labeling and numbering, and then avoid freezing and thawing the samples (⩽3 times) to ensure the stability of the samples before the test. The serum melatonin levels were determined by enzyme-linked immunosorbent assay (ELISA), which was performed in strict accordance with the instructions of the ELISA kit (the ELISA kit was purchased from Wuhan Sanying Biotechnology Co., Ltd.).
Calculation of Related Indices
BMI = Weight (kg)/Height (m) 2 . BMI between 18.0 and 23.9 kg/m2 is considered normal weight, 24.0 to 27.9 kg/m2 is considered overweight, and BMI ⩾ 28 kg/m2 is considered obese.
WHR = Waist circumference (cm)/Hip circumference (cm). WHR ⩾ 0.8 is considered abdominal obesity.


Measurement of BMD
BMD of the lumbar spine L1 to L4 and femoral neck was measured using dual-energy X-ray absorptiometry (DPX Prodigy; GE Lunar DEXA). A T-score between −1 and +1 is considered normal, −1 to −2.5 indicates decreased bone mass, and ⩽−2.5 indicates osteoporosis (OP). 20
Statistical Analysis
In this study, the study participants were divided into 4 groups according to their disease status: the normal group (n = 45); the abnormal bone mass group (n = 43); the T2DM group (n = 46); and the T2DM with abnormal bone mass group (n = 56). For continuous variables, if the normality test conformed to Gaussian distribution, it was expressed as mean ± standard deviation (
Results
Comparison of Baseline Data
Compared with the normal group, abnormal bone mass and T2DM groups, the age, and years of menopause were increased in the T2DM with abnormal bone mass group (P < .01; Table 1).
Comparison of Baseline Characteristics Between Groups [(
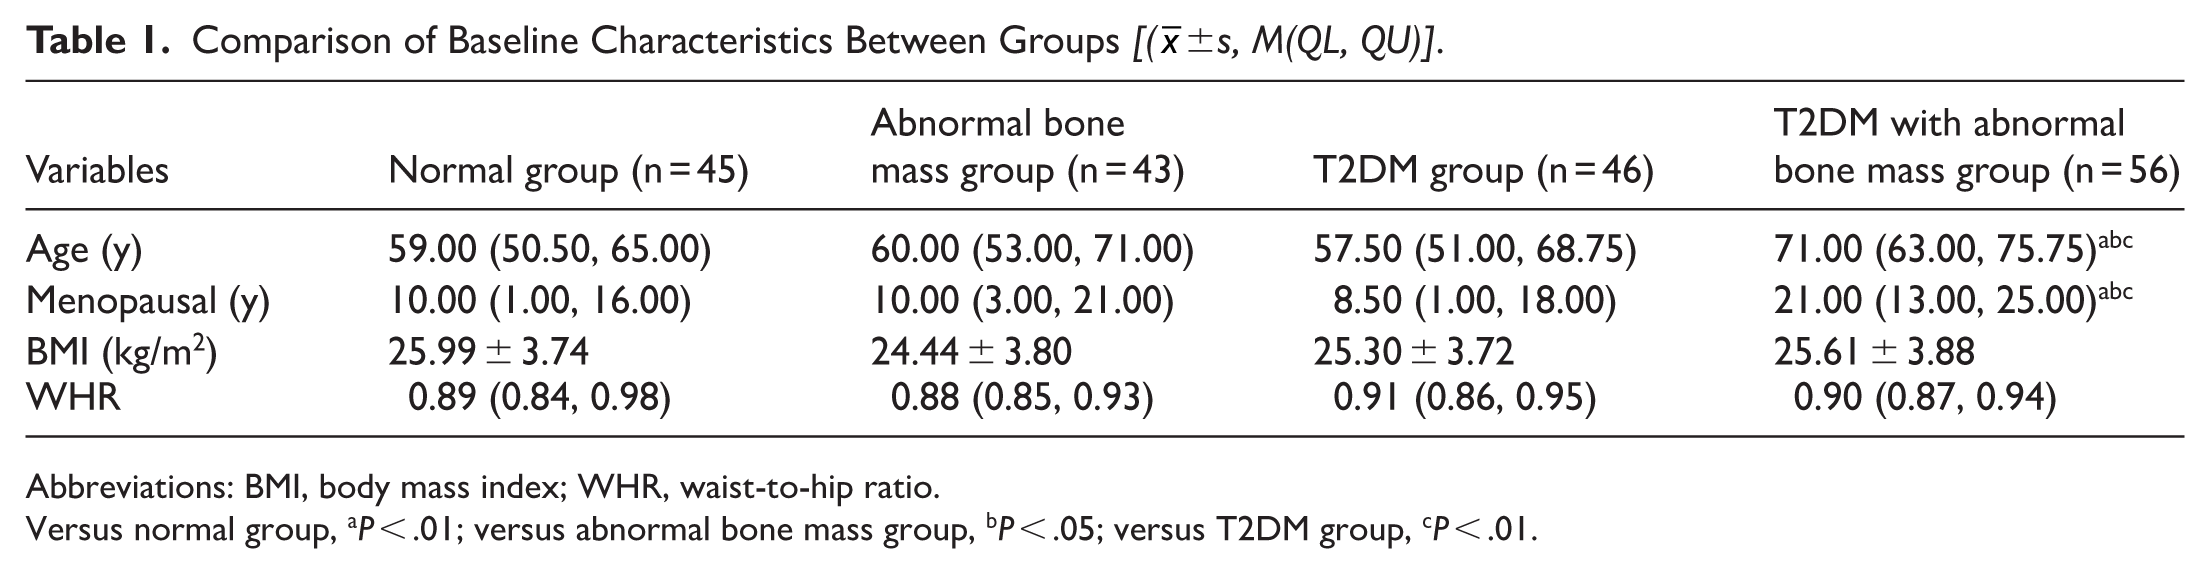
Abbreviations: BMI, body mass index; WHR, waist-to-hip ratio.
Versus normal group, aP < .01; versus abnormal bone mass group, bP < .05; versus T2DM group, cP < .01.
Comparison of Clinical Biochemical Indices and BMD Between Groups
Compared with the normal group and the abnormal bone mass group, the levels of FPG, HbA1c, TyG, TyG-BMI, and TyG-WC were significantly higher in the T2DM group and the T2DM with abnormal bone mass group (P < .01). Femoral neck BMD was lower than the normal group in the abnormal bone mass group, T2DM group, and T2DM with abnormal bone mass group, and lumbar spine L1-L4 BMD was significantly lower than the normal group in the abnormal bone mass group and T2DM with abnormal bone mass group and higher than the abnormal bone mass group in the T2DM group. The P level and eGFR in the T2DM with abnormal bone mass group were lower than that in the normal group, the abnormal bone mass group, and the T2DM group (P < .05; Table 2).
Comparison of Clinical Biochemical Indices and BMD Between Groups [(

Abbreviations: ALP, alkaline phosphatase; Ca, calcium; Cr, creatinine; eGFR, estimated glomerular filtration rate; FPG, fasting blood glucose; HDL-C, high-density lipoprotein; LDL-C, low-density lipoprotein; P, phosphorus; TG, triglycerides; TyG, triglyceride-glucose index; TyG-BMI, triglyceride-glucose index-body mass index; TyG-WC, triglyceride-glucose-waist circumference index; UA, uric acid; UA/Cr, uric acid/creatinine.
Versus normal group, aP < .01; versus abnormal bone mass group, bP < .05; versus T2DM group, cP < 0.01.
Comparison of Melatonin Levels Among Groups
Compared with the melatonin levels of 127.71 (116.23, 137.68) in the normal group, it was lower in the abnormal bone mass group, the T2DM group, and the T2DM with abnormal bone mass group [100.00 (94.00, 110.00), 99.00 (91.75, 100.25), and 92.50 (84.75, 99.00)] groups, melatonin levels were lower in the T2DM with abnormal bone mass group compared to the abnormal bone mass group, and the difference was statistically significant (P < .01; Figure 1).

Contrast of melatonin levels among different groups.
Correlation Between Melatonin Levels and BMD
Spearman correlation analysis showed that melatonin levels were positively correlated with femoral neck BMD and lumbar spine L1 to L4 BMD (correlation coefficients were r = .382, P < .001; r = .205, P = .005 respectively; Figure 2).

Spearman correlation analysis between melatonin levels and BMD: (A) Spearman correlation analysis of melatonin levels with femoral neck BMD and (B) Spearman correlation analysis of melatonin levels with lumbar spine L1 to L4 BMD.
Spearman Correlation Analysis Between BMD and the Remaining Biochemical Indicators
Because of the non-normality of the data, Spearman correlation analysis was used. The results suggested that lumbar spine L1 to L4 BMD was positively correlated with Cr (P < .05), negatively correlated with age and years of menopause (P < .05), and positively correlated with P (P < .01); femoral neck BMD was negatively correlated with FPG, HbA1c, TyG, TyG-BMI, and TyG-WC (P < .01), and the rest were not statistically significant (Table 3).
Spearman Correlated Analysis of BMD and the Remaining Clinical Biochemical Parameters.
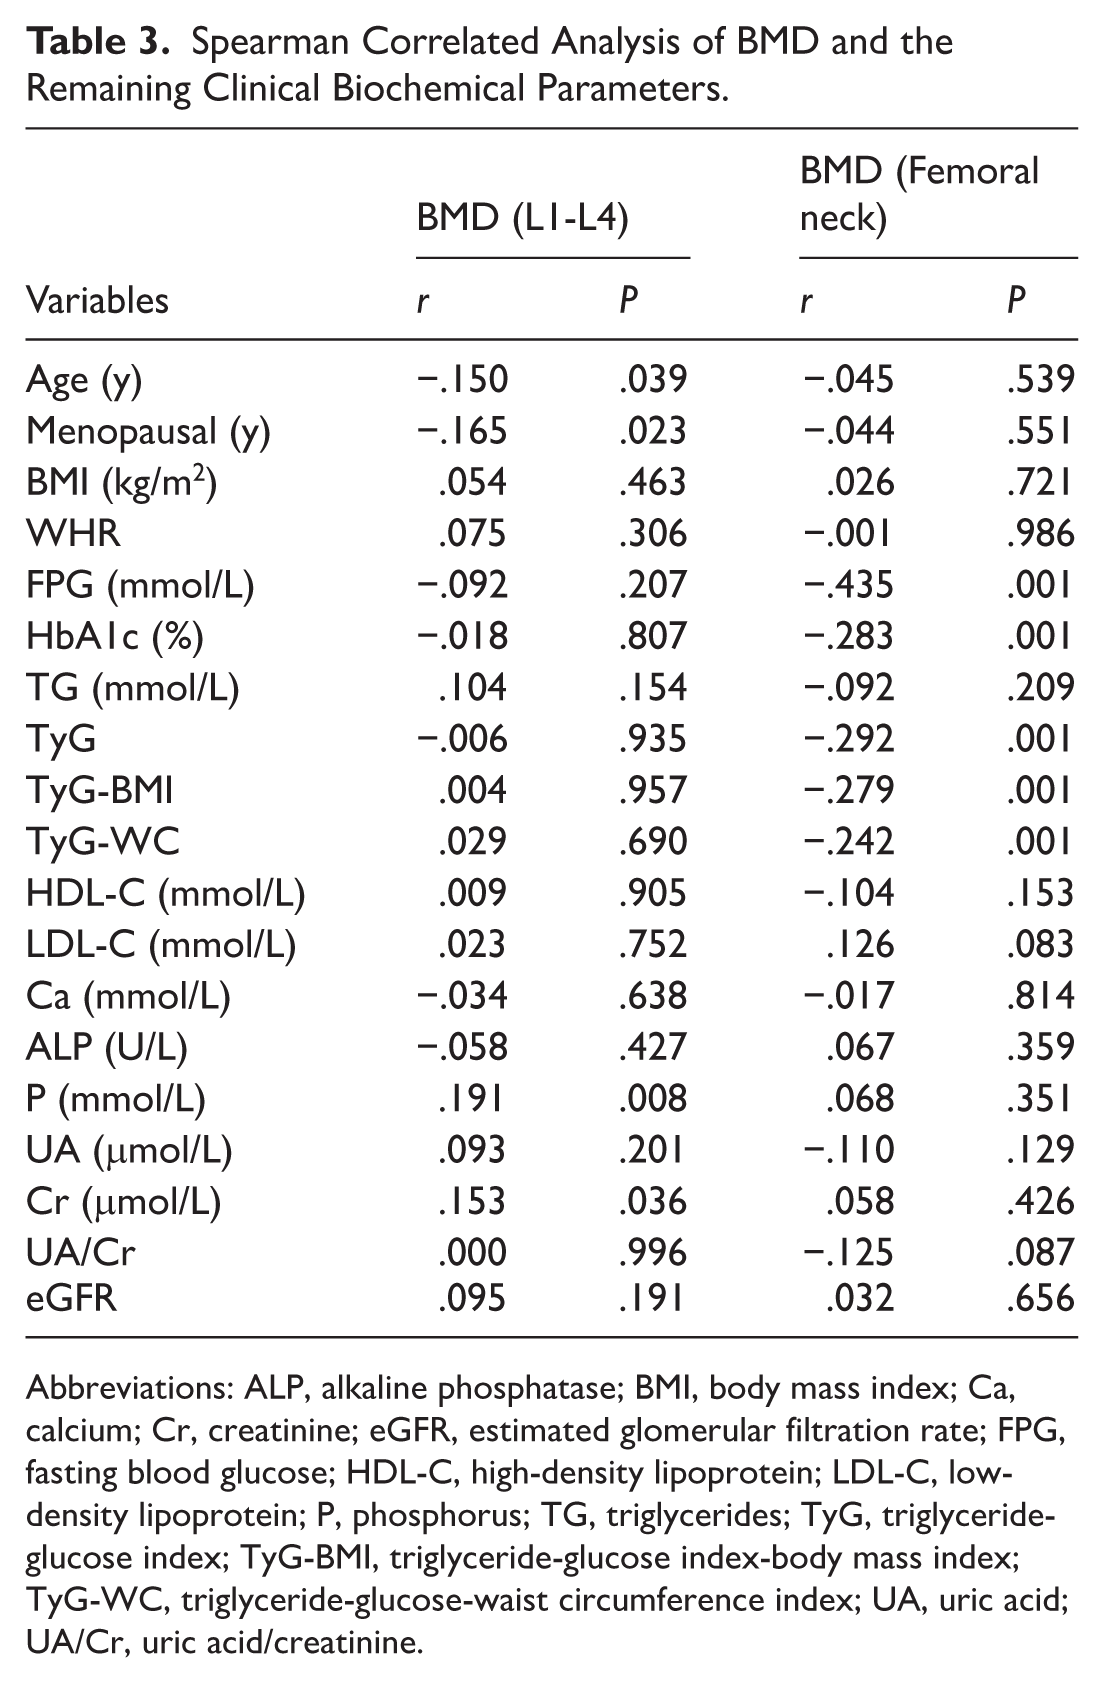
Abbreviations: ALP, alkaline phosphatase; BMI, body mass index; Ca, calcium; Cr, creatinine; eGFR, estimated glomerular filtration rate; FPG, fasting blood glucose; HDL-C, high-density lipoprotein; LDL-C, low-density lipoprotein; P, phosphorus; TG, triglycerides; TyG, triglyceride-glucose index; TyG-BMI, triglyceride-glucose index-body mass index; TyG-WC, triglyceride-glucose-waist circumference index; UA, uric acid; UA/Cr, uric acid/creatinine.
Analysis of Intermediation Effects
Causal mediation analysis was used to investigate whether the effect of melatonin on lumbar spine L1 to L4 BMD and femoral neck BMD was mediated by T2DM as a mediating variable. The analysis of lumbar spine L1 to L4 BMD showed a significant total effect (estimate = 0.002248, P = .010), but the average causal mediating effect (ACME) was not statistically significant (estimate = −0.000165, P = .766), the direct effect (ADE) was significant (estimate = 0.002083, P = .018), and the mediating effect as a percentage of the total effect was −8.16% (95% CI, −90.39 to 57.00), suggesting that T2DM did not play a significant mediating role in the relationship between melatonin and lumbar spine L1 to L4 BMD. Analysis of femoral neck BMD showed a significant total effect (estimate = 0.003928, P < .001), a significant average causal mediating effect (ACME; estimate = 0.001341, P = .014), a significant direct effect (ADE; estimate = 0.002587, P = .002), and the mediating effect as a percentage of the total effect was 33.95% (95% CI, 5.38-70.00), suggesting that T2DM plays a significant mediating role in melatonin’s influence on femoral neck BMD (Figure 3).
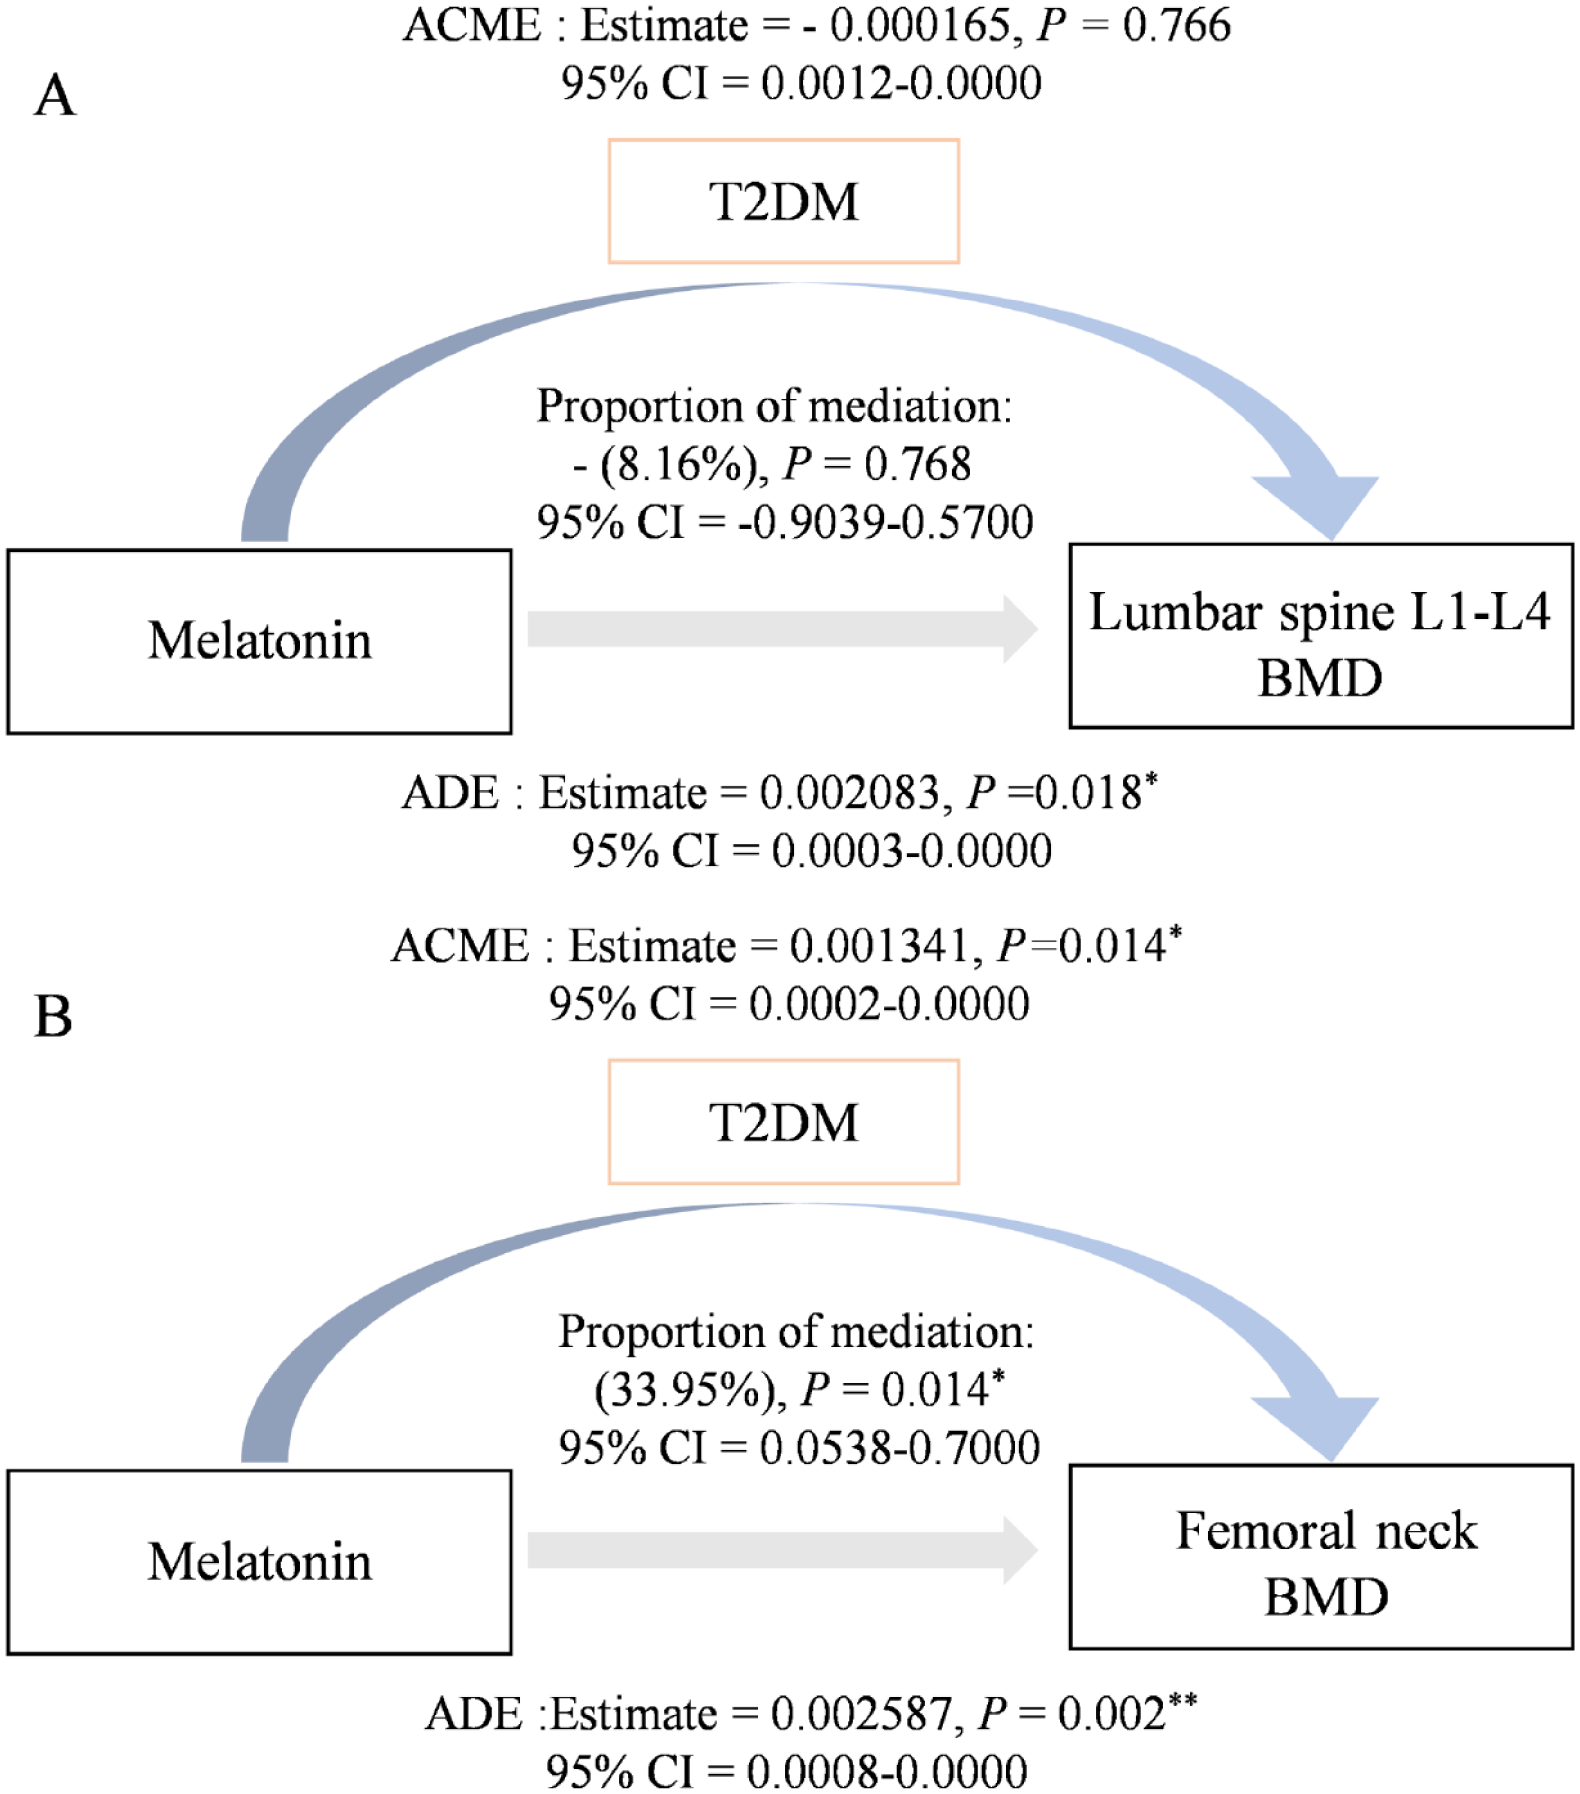
Mediated effect analysis: (A) mediated effect analysis of the effect of Melatonin on BMD in lumbar spine L1 to L4 and (B) mediated effect analysis of the effect of melatonin on BMD in the femoral neck.
Diagnostic Efficacy of Melatonin Levels in Postmenopausal T2DM Combined with Bone Mass Abnormality
ROC curve analysis showed that the AUC of serum melatonin levels for the diagnosis of bone mass abnormalities was 0.942 in the postmenopausal T2DM population. The optimal threshold value determined according to the principle of maximization of the Jordon’s index was 124.29 pg/mL, which corresponded to a Jordon’s index of 0.571, which had a diagnostic sensitivity of 57.8% and a specificity of up to 99.3% (Figure 4).
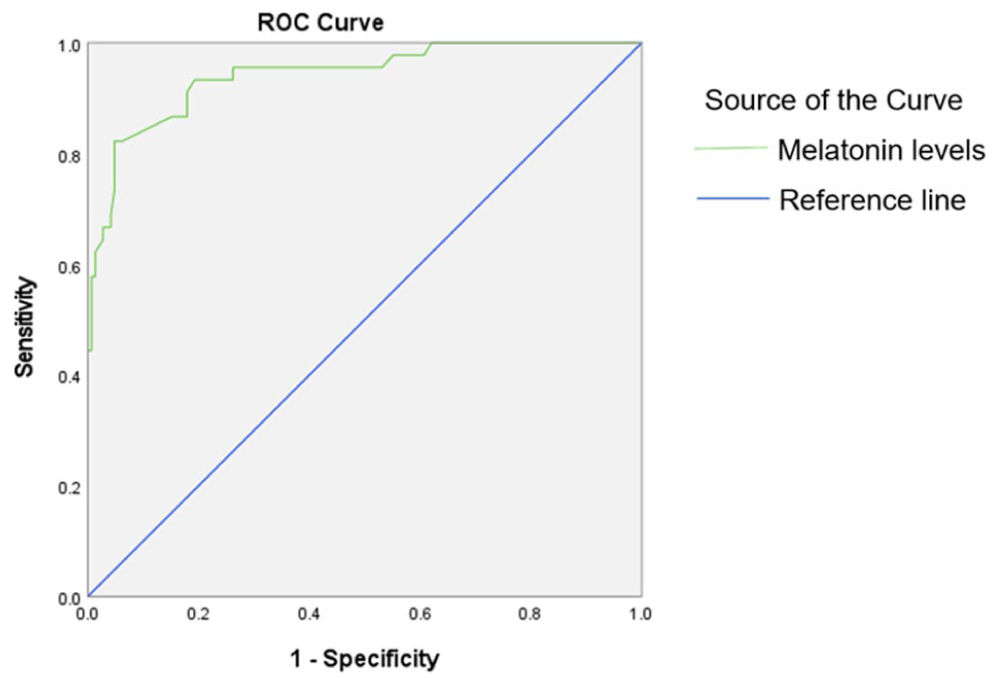
ROC analysis of melatonin levels.
Multiple Linear Regression Analysis of Factors Influencing BMD
One-way linear regression analysis was performed on the data of baseline information, clinical biochemical indexes, and BMD to screen for variables with significant associations with BMD, which were subsequently included in the multiple linear regression model to assess their independent influences. Regression equation: Y1 = 0.652 + 0.003 × (Melatonin levels). Y2 = 0.102 + 0.002 × (Melatonin levels). The results showed that decreased melatonin levels was a risk factor for causing lumbar spine L1 to L4 BMD and femoral neck BMD (Table 4).
Analysis of Factors Influencing BMD of Lumbar Spine L1 to L4 and Femoral Neck.

Discussion
Against the backdrop of the deepening aging process in China, T2DM and OP, as 2 highly prevalent metabolic disorders, show a significant trend of co-morbidity in the elderly population. Disorders of glucose metabolism can significantly increase the risk of OP development and the incidence of fragility fracture by disrupting bone remodeling homeostasis. 21 Postmenopausal patients with T2DM have a higher incidence and lethality of OP due to the sudden drop in estrogen levels. 22 Therefore, it is of great significance to study the pathogenesis of postmenopausal patients with T2DM combined with OP.
Melatonin, as a neuroendocrine hormone that can be distributed throughout the body with blood circulation, has a positive effect on the maintenance of BMD. 23 Melatonin has a bidirectional regulatory effect on the bone remodeling process, which promotes osteoblast differentiation and function by activating osteogenic signaling pathways such as Wnt/BMP,24,25 and also maintains BMD by inhibiting inflammation-related pathways such as NF-κB, which effectively suppresses osteoclast activity and reduces bone resorption. 26 This dual action of promoting formation and inhibiting resorption is crucial in pathological states. Studies have confirmed that melatonin can induce bone trabecular regeneration through signaling pathways such as PI3K/AKT and significantly enhance BMD in OP models. 27 Tian and Ming 28 found that melatonin increased BMD by increasing the expression of OPG. Thus, melatonin can regulate bone metabolic homeostasis and promote the increase of BMD through multi-targets. The present study showed that serum melatonin levels were reduced in both the abnormal bone mass group and the T2DM with abnormal bone mass group, which was consistent with previous studies, 29 suggesting that there is an association between melatonin levels and bone metabolism disorders and that this phenomenon is more prominent in those with T2DM combined with abnormal bone mass. The results of Spearman correlation analysis performed in this study showed that melatonin levels were positively correlated with femoral neck BMD and lumbar spine L1 to L4 BMD, and multiple linear regression analysis further indicated that reduced melatonin levels were an independent risk factor for decreased femoral neck BMD and lumbar spine L1 to L4 BMD. This suggests that the decreased melatonin levels observed in this study are likely to play an important role in the pathologic process of diabetic osteoporosis through mechanisms such as exacerbated oxidative stress and chronic inflammation, consistent with previous studies. 30 A study by Mohammadi et al 31 demonstrated that although short-term supplementation with exogenous melatonin reduced body fat percentage and waist circumference in overweight adults, no association was found between endogenous melatonin levels and anthropometric indices, nor were indices related to BMD detected. In contrast, the present study demonstrated in postmenopausal women with T2DM that a reduction in endogenous melatonin was an independent risk factor for reduced BMD. This discrepancy suggests that exogenous supplementation and endogenous physiologic levels may have different mechanisms of bone regulation and that bone in postmenopausal women with T2DM is more sensitive to melatonin deficiency.
Correlation analysis in this study showed that femoral neck BMD was negatively correlated with FPG, HbA1c, TyG, TyG-BMI, and TyG-WC. Previous studies have shown that poor glycemic control in diabetic patients can lead to decreased femoral neck BMD, 32 and the results of this study are consistent with them. Together, these indicators reflect the state of insulin resistance and dysglycemic metabolism, the latter of which can impair bone health through multiple pathways such as hyperglycemic toxicity, chronic inflammation, and adipokine imbalance. 33 In addition, the central obesity factor integrated by TyG-BMI and TyG-WC further amplifies the adverse effects of metabolic disorders on bone, and the accumulation of visceral fat not only exacerbates systemic inflammation but may also indirectly contribute to BMD loss through mechanisms such as altered mechanical loading and interference with vitamin D activation. 34 The results of this study suggest that maintaining good blood glucose and lipid levels has a protective effect on femoral neck BMD. Therefore, in the comprehensive management of bone health in patients with T2DM, strict glycemic control and improvement of insulin resistance and lipid metabolism disorders should be regarded as equally important as guaranteeing adequate calcium and vitamin D intake, adhering to regular exercise, quitting smoking, and limiting alcohol consumption, as well as preventing falls, and these multidimensional measures collectively constitute the most effective strategy for the prevention of bone loss and fracture in patients with diabetes mellitus. Meanwhile, the results of this study also provide a direction for the optimization of clinical practice in the quantitative assessment of fracture risk. According to the WHO recommendations, when using the FRAX tool for fracture risk prediction in T2DM patients, the accuracy of risk assessment can be significantly improved by checking the rheumatoid arthritis (RA) box or directly adopting the newer FRAX plus tool. The theoretical basis for this adaptation is that T2DM and RA share core pathologic mechanisms such as inflammation in fracture risk modulation. Therefore, combining the biomarker of melatonin levels identified in this study with the optimized FRAX assessment model is expected to enable earlier and more precise identification of individuals at high risk of fracture among postmenopausal women with T2DM, leading to more targeted and stratified interventions.
The mediation analysis of the present study reveals that the regulatory effect of T2DM in the relationship between melatonin and BMD may be site-specific. About 33.95% (95% CI, 5.38-70.00) of the effect of melatonin on femoral neck BMD was mediated through the T2DM pathway, showing a significant mediating effect. However, no significant mediating effect was observed in lumbar spine L1-L4 BMD (percentage of mediating effect: −8.16%, 95% CI, −90.39 to 57.00). This difference may be related to the different bone tissue composition and metabolic regulation mechanisms in different skeletal sites. Lumbar spine L1 to L4 are dominated by cancellous bone with a high bone conversion rate, and their bone mass is more susceptible to direct regulation by endocrine hormones (eg, estrogen, vitamin D) and calcium-phosphorus metabolism, 35 so the indirect effects of disorders of glucolipid metabolism resulting from T2DM may be relatively weak or masked by other, stronger direct modulators. In contrast, the structural integrity of the femoral neck, as a migratory zone between cortical and cancellous bone, is more dependent on collagen quality and local microcirculation. 36 Hyperglycemia and deposition of AGEs due to T2DM can directly damage collagen, weaken bone strength, and interfere with bone marrow blood supply, 37 and these pathological processes are antagonistic to the osteoprotective effects of melatonin, thus making the status of T2DM an important intermediate variable influencing the effects of melatonin in the femoral neck. In addition, the cross-sectional design and mediation analysis methods used in this study may not be sufficient to fully resolve the complex multifactorial regulation of femoral neck BMD, which may be the methodological reason for the failure to detect a significant mediating effect at this site addition, the cross-sectional design and mediation analysis methods used in this study may not be sufficient to adequately resolve the complex multifactorial regulation of femoral neck BMD, which may be the methodological reason for the failure to detect a significant mediating effect at this site. The ROC curve showed that melatonin levels had a good predictive value for the occurrence of bone mass abnormalities in postmenopausal T2DM patients (AUC = 0.942, 95% CI, 0.902-0.982). When the cut-off value was 124.29 pg/mL, the specificity was as high as 99.3% and the sensitivity was 57.8%, which suggests that early detection of melatonin levels in high-risk individuals can help to identify the risk of bone loss and provide a basis for implementing targeted interventions.
This study also has some limitations. First, serum melatonin testing is not a routine clinical test and has limited clinical accessibility, a methodological peculiarity that may limit the extrapolation of this study’s findings to broader clinical scenarios and the comparability of results. Second, this study was exploratory in nature, with a limited sample size and no a priori sample size estimation, resulting in insufficient statistical validity, and therefore results that are borderline significant or non-significant in this study should be interpreted with caution. In addition, as described in the text, research evidence that is not entirely consistent with the findings of this study has been reported in the literature, suggesting that the preliminary findings of this study need to be further validated in larger, multicenter cohort studies. Future studies should perform formal sample size calculations and employ multiple comparison correction methods to minimize the risk of false-positive results and to improve the reliability and reproducibility of results.
Conclusion
In summary, lower melatonin levels are closely associated with abnormal bone metabolism in postmenopausal T2DM patients, and lower levels are an important risk factor for decreased BMD. The protective effect of melatonin on bone may be site-specific, and its positive effect on femoral neck BMD is partly realized by modulating the pathological process of T2DM. Based on this, regular monitoring of melatonin levels in postmenopausal women with T2DM accompanied by risk factors for OP may help to identify the risk of rapid bone loss at an early stage, thereby slowing down the pathological process of bone loss.
Glossary Table

Supplemental Material
sj-docx-1-end-10.1177_11795514261432381 – Supplemental material for Relationship Between Serum Melatonin Levels and Bone Mineral Density in Postmenopausal Women with Type 2 Diabetes Mellitus
Supplemental material, sj-docx-1-end-10.1177_11795514261432381 for Relationship Between Serum Melatonin Levels and Bone Mineral Density in Postmenopausal Women with Type 2 Diabetes Mellitus by Jun Li, Yaxin Li, Yecheng Zhu, Siyuan Li, Yunqiu Lu and Hangning Tian in Clinical Medicine Insights: Endocrinology and Diabetes
Supplemental Material
sj-docx-2-end-10.1177_11795514261432381 – Supplemental material for Relationship Between Serum Melatonin Levels and Bone Mineral Density in Postmenopausal Women with Type 2 Diabetes Mellitus
Supplemental material, sj-docx-2-end-10.1177_11795514261432381 for Relationship Between Serum Melatonin Levels and Bone Mineral Density in Postmenopausal Women with Type 2 Diabetes Mellitus by Jun Li, Yaxin Li, Yecheng Zhu, Siyuan Li, Yunqiu Lu and Hangning Tian in Clinical Medicine Insights: Endocrinology and Diabetes
Footnotes
Acknowledgements
Jun Li is the corresponding and first author, and Yaxin Li, Yecheng Zhu, and Siyuan Li are the co-first authors. We thank all the authors for their participation and support.
Ethical Considerations
This study was approved by the Ethics Committee of the First Affiliated Hospital of Shihezi University in China (Ethical Approval No. KJ-2023-114-01) and adhered strictly to the principles of the Helsinki Declaration. The corresponding ethical approval document is provided as Supplementary Material.
Consent to Participate
All patients agreed to participate in the study and signed the research statement.
Consent for Publication
All subjects provided comprehensive written informed consent and agreed to the publication of data prior to the study.
Author Contributions
Jun Li: Conceptualization; Funding acquisition; Project administration. Yaxin Li: Data curation; Investigation; Writing - original draft. Yechen Zhu: Data curation; Investigation; Writing - original draft. Siyuan Li: Methodology; Supervision; Writing - review & editing. Yunqiu Lu: Data curation; Investigation. Hangning Tian: Data curation; Investigation.
Funding
The authors disclosed receipt of the following financial support for the research, authorship, and/or publication of this article: National Science and Technology Major Program (2024ZD0532303); Corps Guiding Science and Technology Program Projects (S2024ZD041); Science and Technology Tackling Program in Key Areas (2026YD027).
Declaration of Conflicting Interests
The authors declared no potential conflicts of interest with respect to the research, authorship, and/or publication of this article.
Data Availability Statement
All data used in the course of the study were obtained from the corresponding authors.
Supplemental Material
Supplemental material for this article is available online.