
Abstract
Objective:
Type 2 diabetes mellitus complicated with microvascular diseases can be used as a model to study the relationship between bone health and the microvascular situation.
Methods:
A total of 2,170 patients with type 2 diabetes mellitus (1,188 postmenopausal females and 982 males aged ⩾50 years) were included in our cross-sectional study. These patients were grouped according to 24-hour urine protein level: Group I (<30 mg), Group II (30-299 mg) and Group III (≥300 mg). Bone mineral density of the lumbar spine, hip and femoral neck was evaluated by dual-energy X-ray absorptiometry. Fundus oculi photography for diabetic retinopathy and 24-h urine protein for diabetic nephropathy were used as markers of microangiopathy in type 2 diabetes mellitus. Characteristics of the patients and bone mineral density were compared. Multivariate analysis was used to study the association between bone mineral density and microangiopathy. Statistical analysis was performed using SPSS 20.0. p < 0.05 was considered statistically significant.
Results:
Group III had the lowest bone mineral density level in both genders. Multivariate analysis revealed that microangiopathy was negatively correlated with bone mineral density in females (lumbar: r = –0.522, p < 0.001; hip: r = –0.301, p = 0.010; femoral neck: r = –0.314, p = 0.009), but not in males, after adjustment for age, body mass index, hypertension, hyperlipidemia, diabetic status, hepatic function, kidney function, sex hormones and 25(OH) vitamin D.
Conclusion:
These results demonstrate an independent negative correlation between microangiopathy and bone mineral density in postmenopausal female type 2 diabetes mellitus patients.
Introduction
In the past decades, the pathophysiological study of osteoporosis has focused on bone cells including osteoblasts and osteoclasts. Some studies showed that vasculature degeneration may affect bone quality. A study 1 conducted in Hong Kong, China, that included 103 subjects revealed that vertebral marrow perfusion indexes had a significantly decreased trend in the osteoporotic group as compared with the osteopenic and the normal bone density group. This provided useful evidence that vasculature degeneration may affect bone health. In addition, many previous laboratory studies have suggested that angiogenesis promoted osteogenesis.2,3 Choi et al. 4 reported that the urine albumin-creatinine ratio (ACR) was negatively correlated with bone mineral density (BMD) at the lumbar spine and femoral neck in females. Another survey 5 with follow-up lasing 8.4 years from Norway demonstrated that ACR was associated with non-vertebral fractures in females without diabetes. The prospective study found that the relative risk of fracture was 1.01 in males (p = 0.94) and 1.15 in females (p = 0.005) for a 1-standard deviation (SD) higher value for log-transformed ACR. 5 These findings suggest that vasculature could affect BMD.
However, clinical evidence of the association between vasculature and bone disease is limited. Type 2 diabetes mellitus (T2DM) patients were vulnerable to vasculopathy and were especially complicated with microangiopathy. This provided a proper clinical model to investigate the relationship between the microvascular situation and bone health. Diabetic microvascular disease includes diabetic retinopathy and nephropathy. Fundus oculi photographs and proteinuria are traditional signs of early diabetic microvascular disease, and 24-h urine protein is an accurate, convenient, stable and reliable screening method to estimate urine protein excretion. 6 The ocular fundus photographic changes and 24-h urine protein in T2DM patients might provide a clue of microangiopathy.7–10
In this study, we sought to investigate the correlation between microangiopathy and BMD in postmenopausal women with T2DM and age-matched male patients using ocular fundus photographic changes and 24-h urine protein as surrogate microangiopathy markers.
Patients and methods
Patients
The study protocol was approved by the local ethics review committee at the authors’ affiliated institution, and the research was conducted according to the Declaration of Helsinki. Patient consent was not required due to the retrospective nature of the study.
In this retrospective study, we reviewed the medical records of patients with T2DM who visited the Department of Endocrinology and Metabolism, Shanghai Tenth People’s Hospital (Shanghai, P.R. China) between July 2011 and January 2016. Diabetes was defined according to the ADA standards. 6 Male patients who were at least 50 years of age and postmenopausal women were included. Major exclusion criteria were kidney disease like nephritis and nephropathy, infections, fever or other conditions that could influence urine protein content, concurrent diseases that may affect bone metabolism like rheumatic arthritis and hyperparathyroidism, diabetic ketoacidosis and hyperglycemic hyperosmotic state, and concurrent medications that may influence bone metabolism such as bisphosphonates. Patients with incomplete data on BMD or 24-h urine protein or unknown menopausal status were also excluded.
Information was collected on age, gender, diabetic duration, menstrual history, previous history and current medications. Body mass index (BMI, kg/m2) was calculated as mass divided by height in metre squared. Women were defined as postmenopausal if they were reported having a natural menopause. 11 Hypertension was defined as systolic blood pressure (SBP) greater than 140 mmHg and/or diastolic pressure higher than 90 mmHg. Hyperlipidemia was considered present if total cholesterol (TC) was >5.2 mmol/L, triglyceride (TG) >1.7 mmol/L or low-density lipoprotein (LDL) >3.4 mmol/L. Hepatic function was considered impaired if alanine transaminase (ALT) was >40U/L or aspartate transaminase (AST) was >40 U/L or total bilirubin was >17.1 μmol/L or conjugated bilirubin >5.0 μmol/L. Kidney function was considered impaired if serum creatinine >106 μmol/L.
Biochemical analysis
Overnight fasting blood was collected. The fasting plasma glucose was determined by the glucose oxidase method. Haemoglobin A1 C (HbA1 C) was measured by high-performance liquid chromatography (HPLC) with the coefficient of variation (CV) of 1.11%. 12 Plasma insulin (Biosource, Nivelles, Belgium) was determined by immunoradiometric assays with the intra- and inter-assay CVs of 1.6%–2.2% and 6.1%–6.5% and 2.3%–3.0% and 3.5%–5.1%, respectively. 13 The homeostasis model assessment–insulin resistance (HOMA-IR) index was calculated as fasting glucose (mmol/L) multiplied by fasting insulin (U/mL) divided by 2.25. TC, TG, high-density lipoprotein (HDL), and LDL were all measured by the electrochemical luminescence [enzyme-linked immunosorbent assay (ELISA)] method. 14 Serum osteocalcin, C-terminal telopeptide fragments of type-I collagen (β-CTX) and 25 (OH) vitamin D were measured using radioimmunoassay (RIA). 15 Serum calcium and phosphorus, ALT, AST, total bilirubin, conjugated bilirubin, serum creatinine (Cr), estradiol and testosterone were analysed with a routine autoanalyzer (Modular DP analyzer, Roche Diagnostics, Mannheim, Germany).
Microangiopathy
Ocular fundus photography
Patients with available ocular fundus photographs were evaluated for diabetic retinopathy. They were diagnosed as diabetic retinopathy microaneurysm formation, intraretinal haemorrhages, retinal capillary nonperfusion, cotton wool spots, increased numbers of haemorrhages, venous abnormalities and intraretinal microvascular abnormalities (IRMA). Photographs were tested by Digital Retinal CR-2.3 operated by experienced ophthalmologists.
2. 24-h urine protein
After a 24-h timed urine sample collection, 24-h proteinuria (mg) was measured by an automated nephelometric immunochemical method using reagents and a calibrator from Beckman Coulter (Fullerton, CA, USA). Internal reference samples were used in each analytical run.
3. Severity of microangiopathy
To examine the relationship between BMD and microangiopathy, we evaluated each patient for microangiopathy. So we collected the data of ocular fundus photography of these patients. Since 24-h urine protein was more objective than the grade of ocular fundus photographic changes, we used it to represent the degree of microangiopathy in multivariate analysis. Thus, severity of microangiopathy was graded as follows: (1) grade 0: no diabetic microangiopathy (no diabetic retinopathy); (2) grade 1: with diabetic retinopathy and 24-h urine protein < 30 mg; (3) grade 2: with diabetic retinopathy and 24-h urine protein 30–299 mg; and (4) grade 3: with diabetic retinopathy and 24-h urine protein ≥ 300 mg.
Dual-energy X-ray absorptiometry
BMD in the lumbar spine (L1 L4), hip and femoral neck was analysed using a Hologic QDR 4500 W densitometer with software version 9.03 (Hologic, USA). All BMD scans were conducted on the same device operated by a well-trained technologist under the same parameter settings following standard procedures. The dual-energy x-ray absorptiometry (DXA) device provided BMD (g/cm2), and T-score or Z-score. Osteoporosis was defined as a T-score value of ⩾2.5 SDs below the young adult mean (T-score <2.5 SD) according to the diagnostic criteria of the World Health Organization for osteoporosis in postmenopausal women and men ⩾50 years old.
Statistical analysis
Normally distributed data were presented as mean ± SD, non-normally distributed data were expressed as median (interquartile range, IQR), and categorical variables were expressed as percentage. All analyses were performed using SPSS 20.0 (SPSS Inc., Chicago, IL, USA) and stratified by gender owing to some physiological difference. Comparisons of three groups were made using analysis of variance (ANOVA) for continuous and homogeneous variables, nonparametric test (Kruskal–Wallis Test) for inhomogeneous variables and X2 for categorical variables. Multivariate analysis was used to analyse the association between BMD at the lumbar spine, hip and femoral neck and other variables. In the model, the following variables were entered, including hypertension, hyperlipidemia, diabetic status, hepatic and kidney function, sex hormones, 25(OH) vitamin D, and microangiopathy. p < 0.05 was considered statistically significant.
Results
Demographic and baseline characteristics of the study population
The study flow chart is shown in Figure 1. A total of 3480 patients were enrolled. Forty-four patients were excluded due to kidney disease, 210 patients were excluded because of infection and fever or other conditions that might influence urine protein content and 513 patients were excluded due to medications or concurrent diseases that may impact bone metabolism. Fifty-two patients were excluded due to diabetic ketoacidosis and hyperglycemic hyperosmotic state. Furthermore, 491 patients were excluded due to lack of data on BMD, 24-h urine protein, or unknown menopausal status. Finally, 2,170 patients including 982 men and 1188 women were included. Patient demographic and baseline characteristics are shown in Table 1.
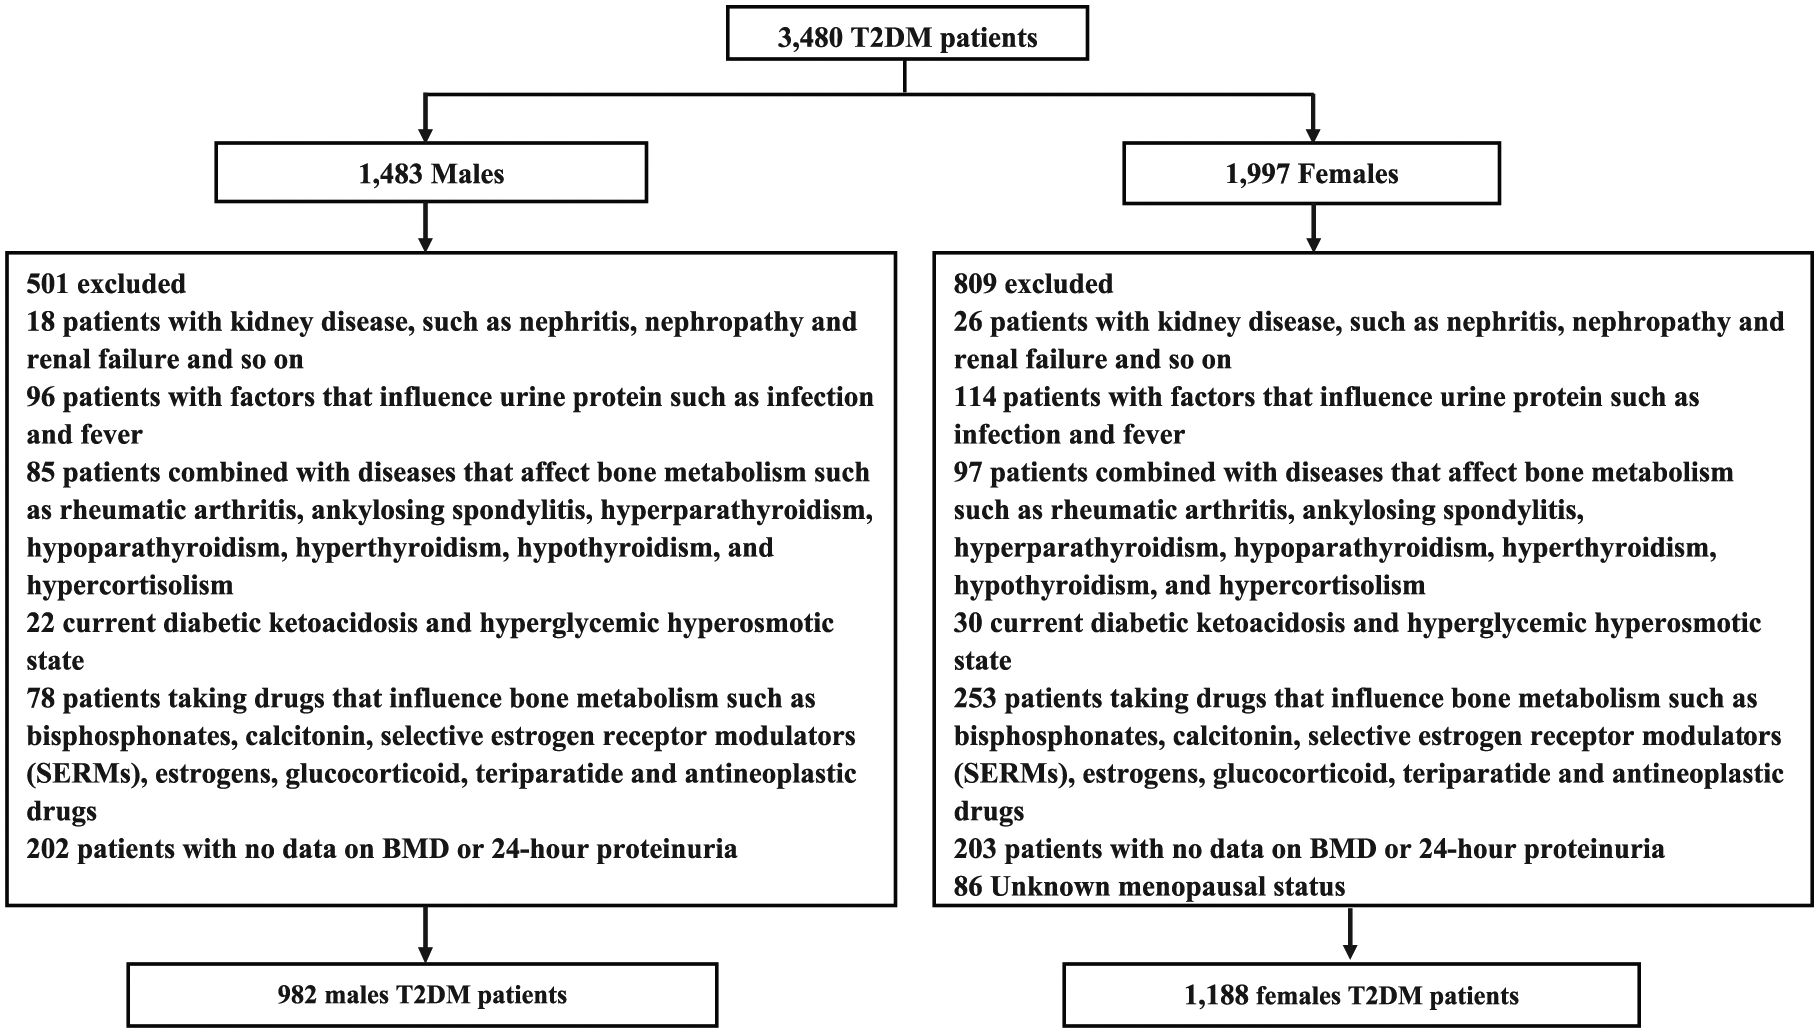
The flow chart of study. A total of 3,480 T2DM patients were enrolled. According to the exclusion criteria, 1,310 patients were excluded. Finally, 2,170 T2DM patients (1,188 postmenopausal females and 982 age-matched males) were included.
Demographic and baseline characteristics of the study population.
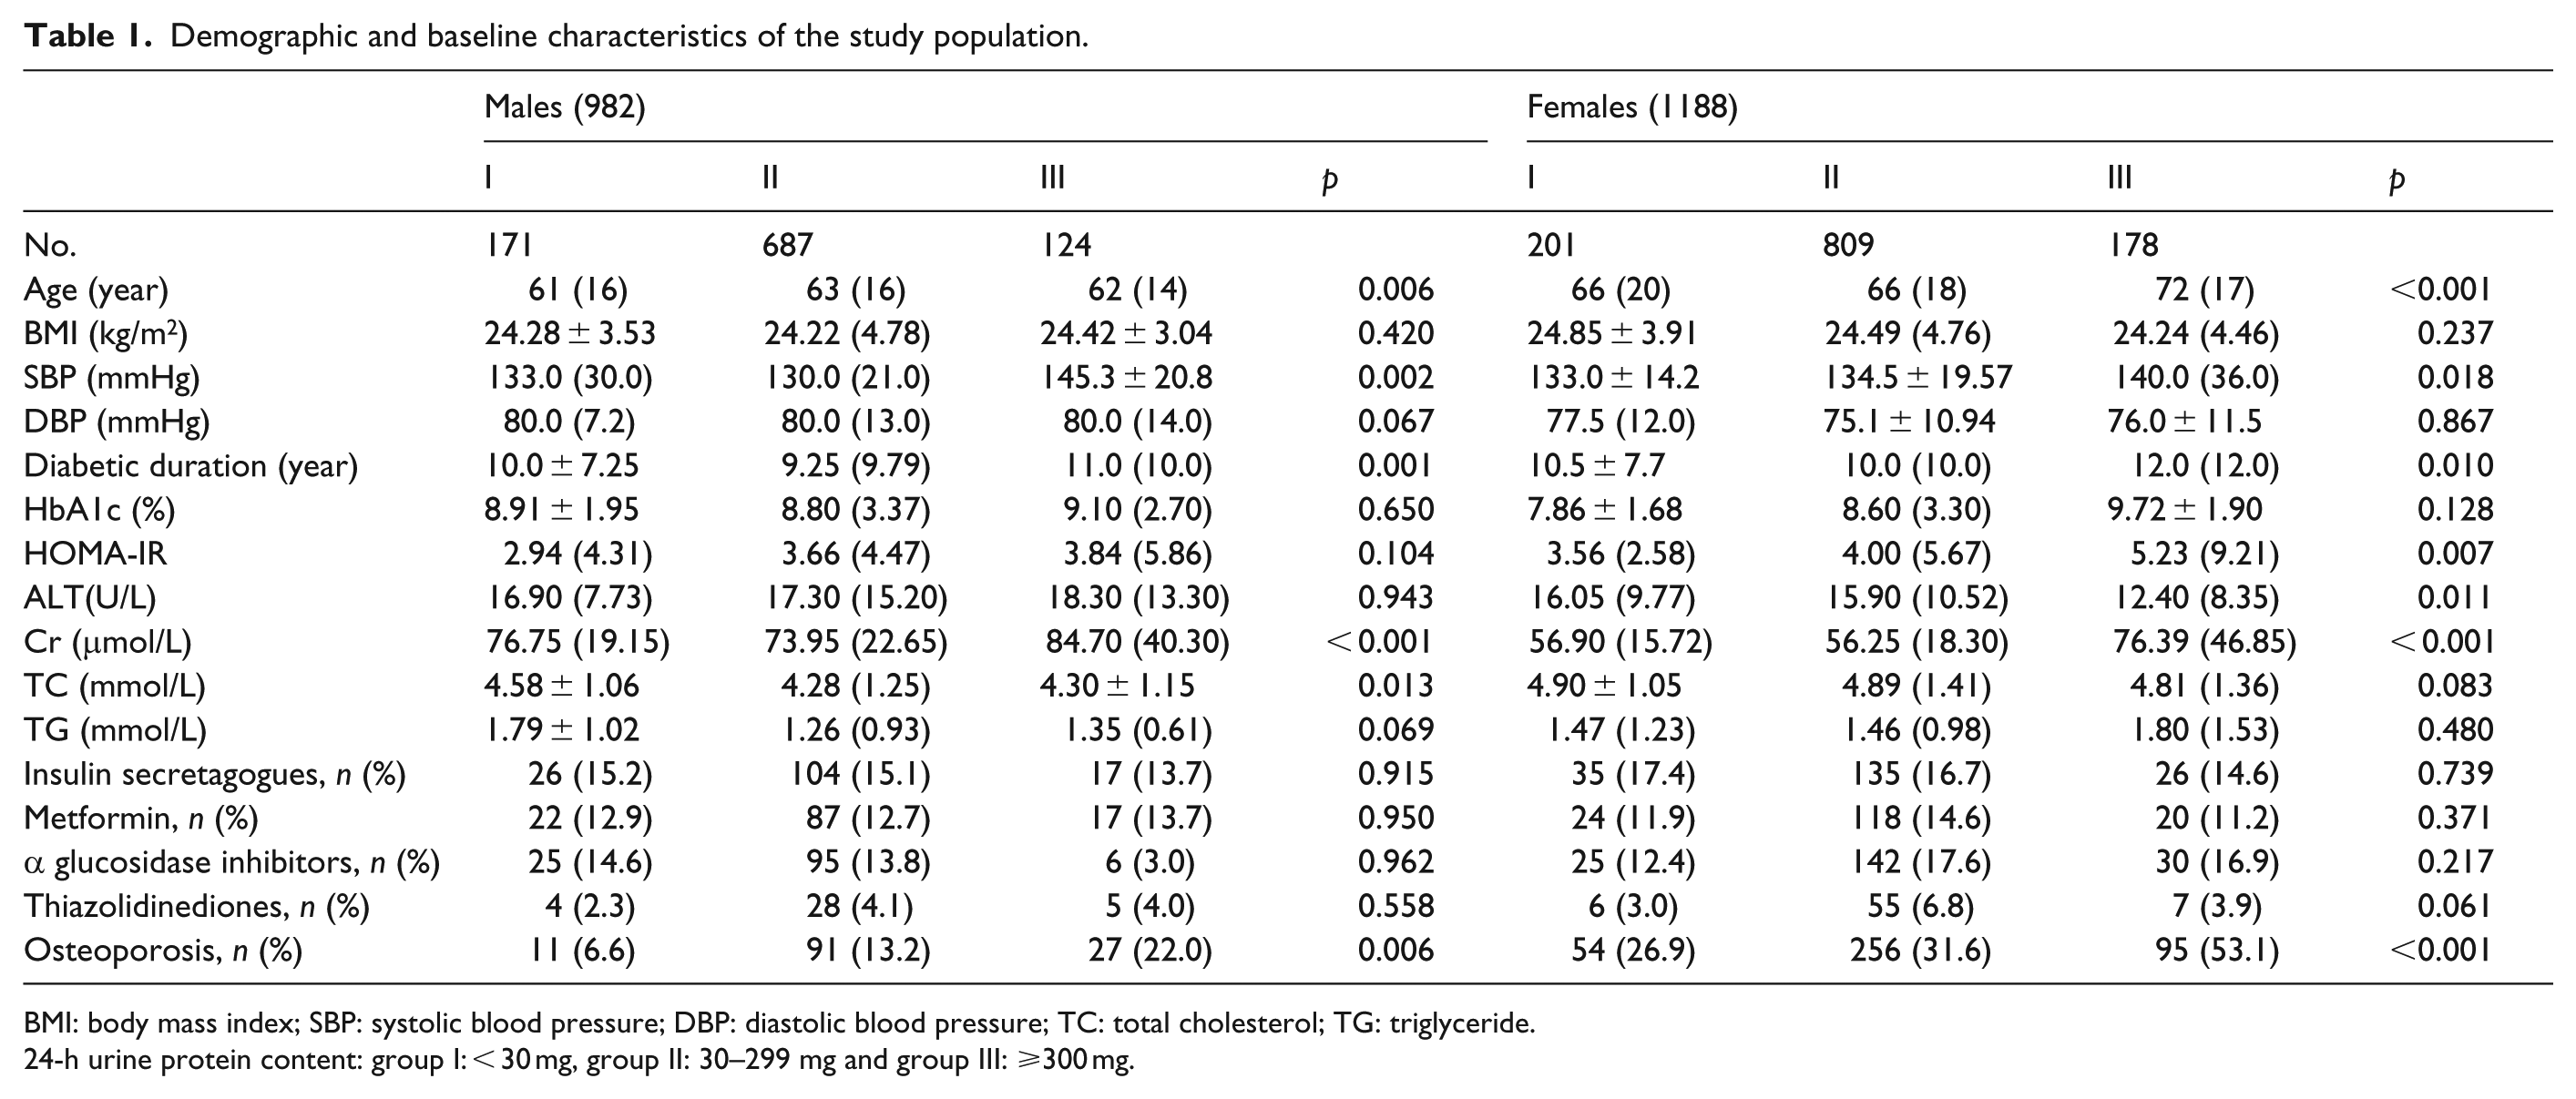
BMI: body mass index; SBP: systolic blood pressure; DBP: diastolic blood pressure; TC: total cholesterol; TG: triglyceride.
24-h urine protein content: group I: < 30 mg, group II: 30–299 mg and group III: ⩾300 mg.
In men, there were 171 patients in group I, 687 patients in group II and 124 patients in group III. Statistically significant differences were observed in age, SBP, duration of diabetes, serum creatinine and TC among the three groups. In women, there were 201 patients in group I, 809 patients in group II and 178 patients in group III. Statistically significant differences were observed in age, SBP, duration of diabetes, serum creatinine, ALT and HOMA-IR among the three groups. We observed no statistically significant difference in the prescription of anti-diabetic medications (insulin secretagogues, metformin, α-glucosidase inhibitors and thiazolidinediones) in the three groups in both genders.
BMD and bone metabolism
The proportion of patients with osteoporosis was significantly different among the three groups in both men and women (male: p = 0.006, female: p < 0.001). Higher 24-h urine protein content was associated with a greater proportion of patients with osteoporosis. Both men and women in group III had significantly lower BMD at the lumbar spine, the hip and femoral neck than men and women in group II or I, respectively (p < 0.05 in all) (Figure 2). We found no statistically significant difference in calcium, phosphorus, testosterone, and osteocalcin among the three groups in both men and women (Table 2). Both men and women in group III had significantly lower 25(OH) VD levels than their counterparts in group II or I, respectively (p < 0.05 in all). Furthermore, women in group III had significantly higher estradiol or β-CTX than women in group II or I (p < 0.05 in all).
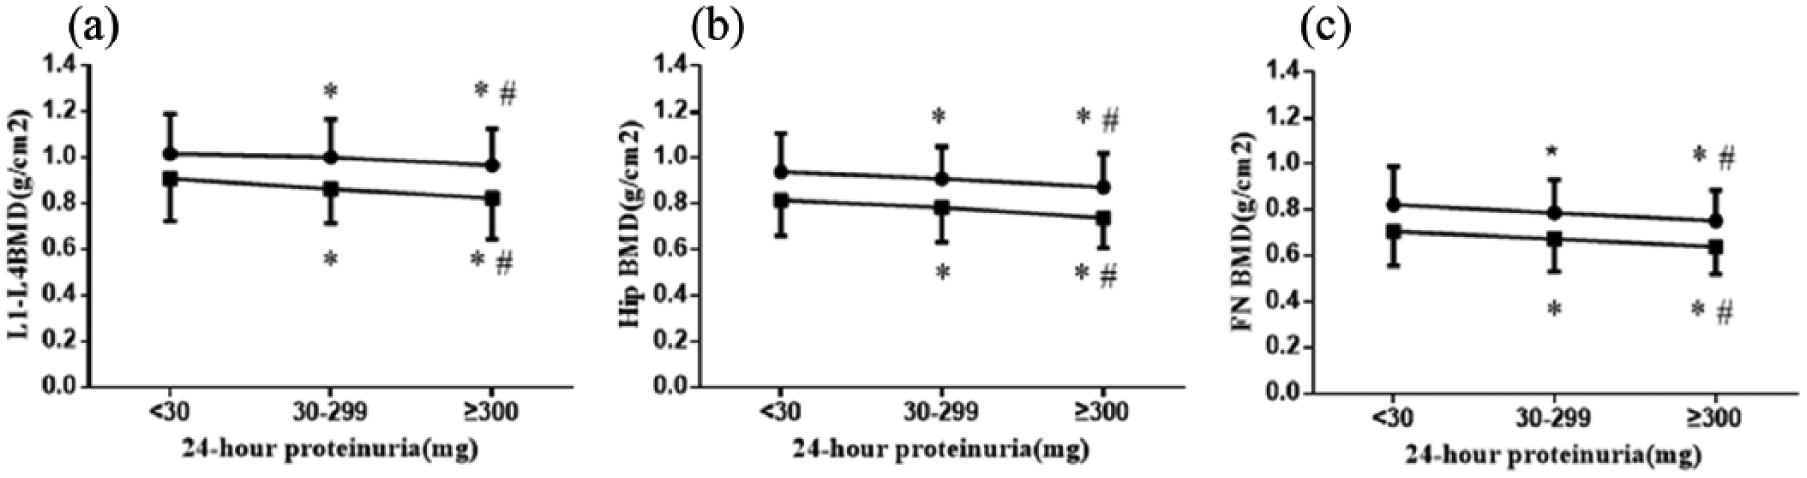
BMD among different proteinuria groups in males and females. The circle (•) represented the male and the box (■) represented the females. The punctuation ‘
Biochemical profile of the study patients stratified by 24-h urinary protein content.
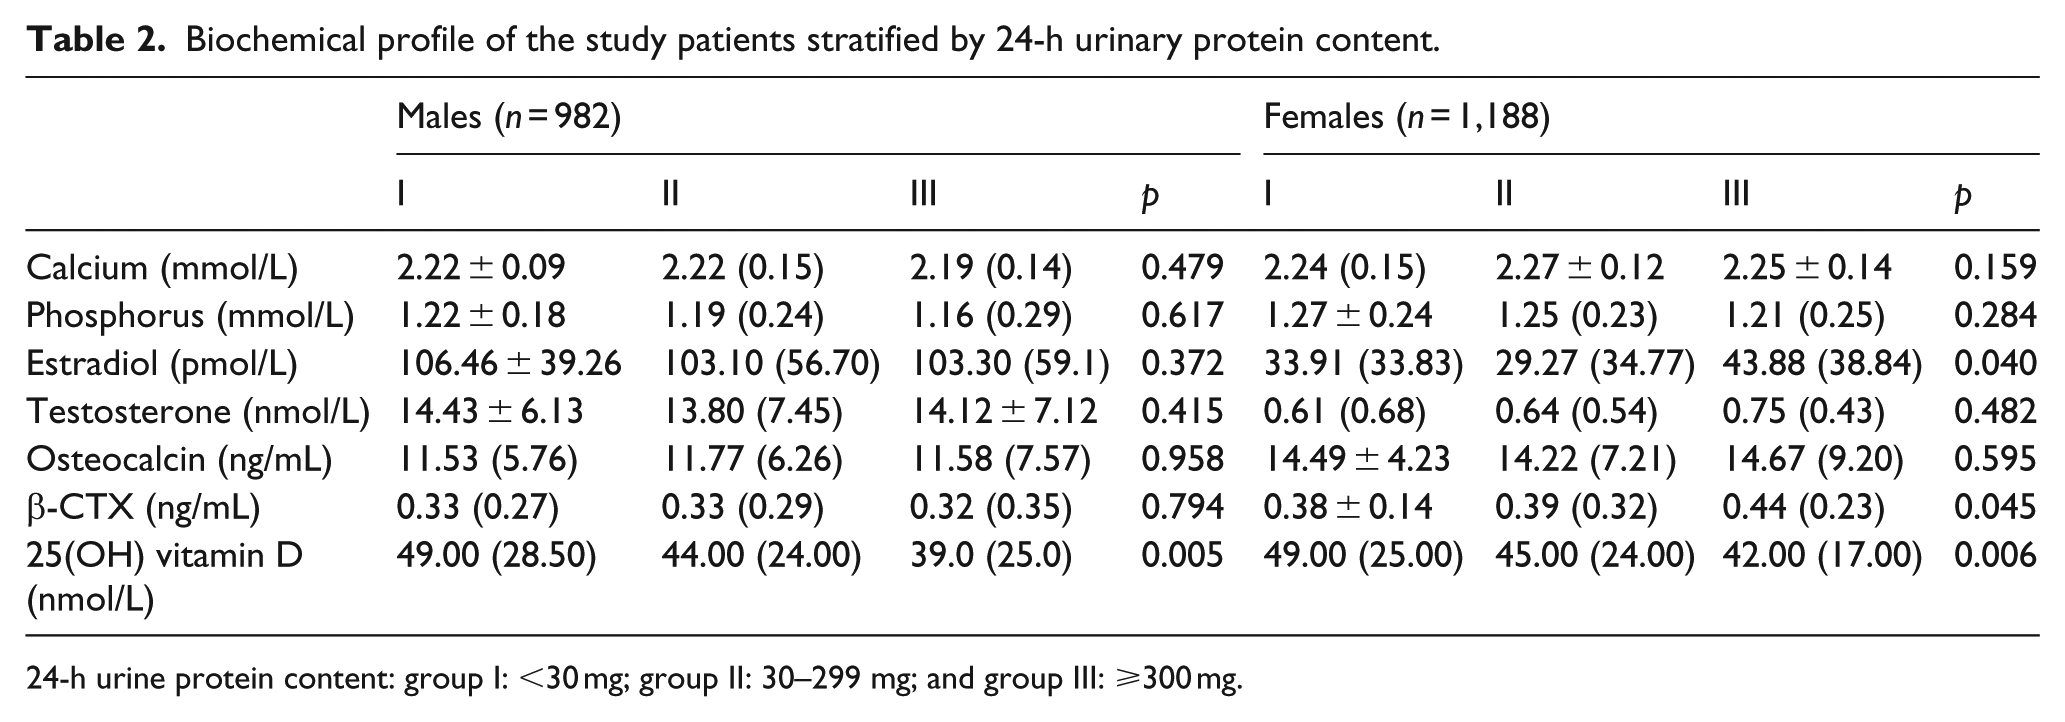
24-h urine protein content: group I: <30 mg; group II: 30–299 mg; and group III: ⩾300 mg.
Microangiopathy negatively correlates with BMD of the lumbar spine, hip and femoral neck in women
Diabetic retinopathy which is considered more specific should be assessed. So we collected the data of ocular fundus photography of these patients. However, since the patients were from July 2011 to January 2016, most of their ocular fundus photographic data could not be found. At last, only 1,244 patients were collected, and 661 of them had complete data. Four hundred and eight of them were diagnosed with diabetic retinopathy, 253 patients were without diabetic retinopathy. Severity of microangiopathy was graded as follows: (1) grade 0: no diabetic microangiopathy (no diabetic retinopathy, 151 males and 102 females); (2) grade 1: with diabetic retinopathy and 24-h urine protein <30 mg (35 males and 37 females); (3) grade 2: with diabetic retinopathy and 24-h urine protein 30–300 mg (133 males and 160 females); and (4) grade 3: with diabetic retinopathy and 24-h urine protein >300 mg (23 males and 20 females).
Other independent variables such as age, BMI, hypertension, hyperlipidemia, diabetic status, hepatic function, kidney function, sex hormones and vitamin D were also included in multivariate analysis. The result showed that among these patients (661 patients), microangiopathy was negatively correlated with BMD in females.
Our multivariate analysis revealed that age negatively correlated with BMD of the hip (r = −0.239; p = 0.018) and the femoral neck (r = –0.307; p = 0.003) in men and only with BMD of the hip in women (r = –0.313, p = 0.016) (Table 3). BMI only positively correlated with BMD of the lumbar spine in men (r = 0.266; p = 0.021) while hypertension only negatively correlated with BMD of the lumbar spine in women (r = –0.233; p = 0.027). Furthermore, total testosterone was negatively correlated with BMD of the hip (r = –0.352, p = 0.002) and the femoral neck in men (r = –0.372, p = 0.002). Moreover, we found that, after adjustment for age, BMI, hypertension, hyperlipidemia, diabetic status, sex hormones and 25(OH) vitamin D, microangiopathy were independently and negatively correlated with BMD of the lumbar spine (r = –0.522, p
Multivariate analysis of correlation between BMD and other patient variables.
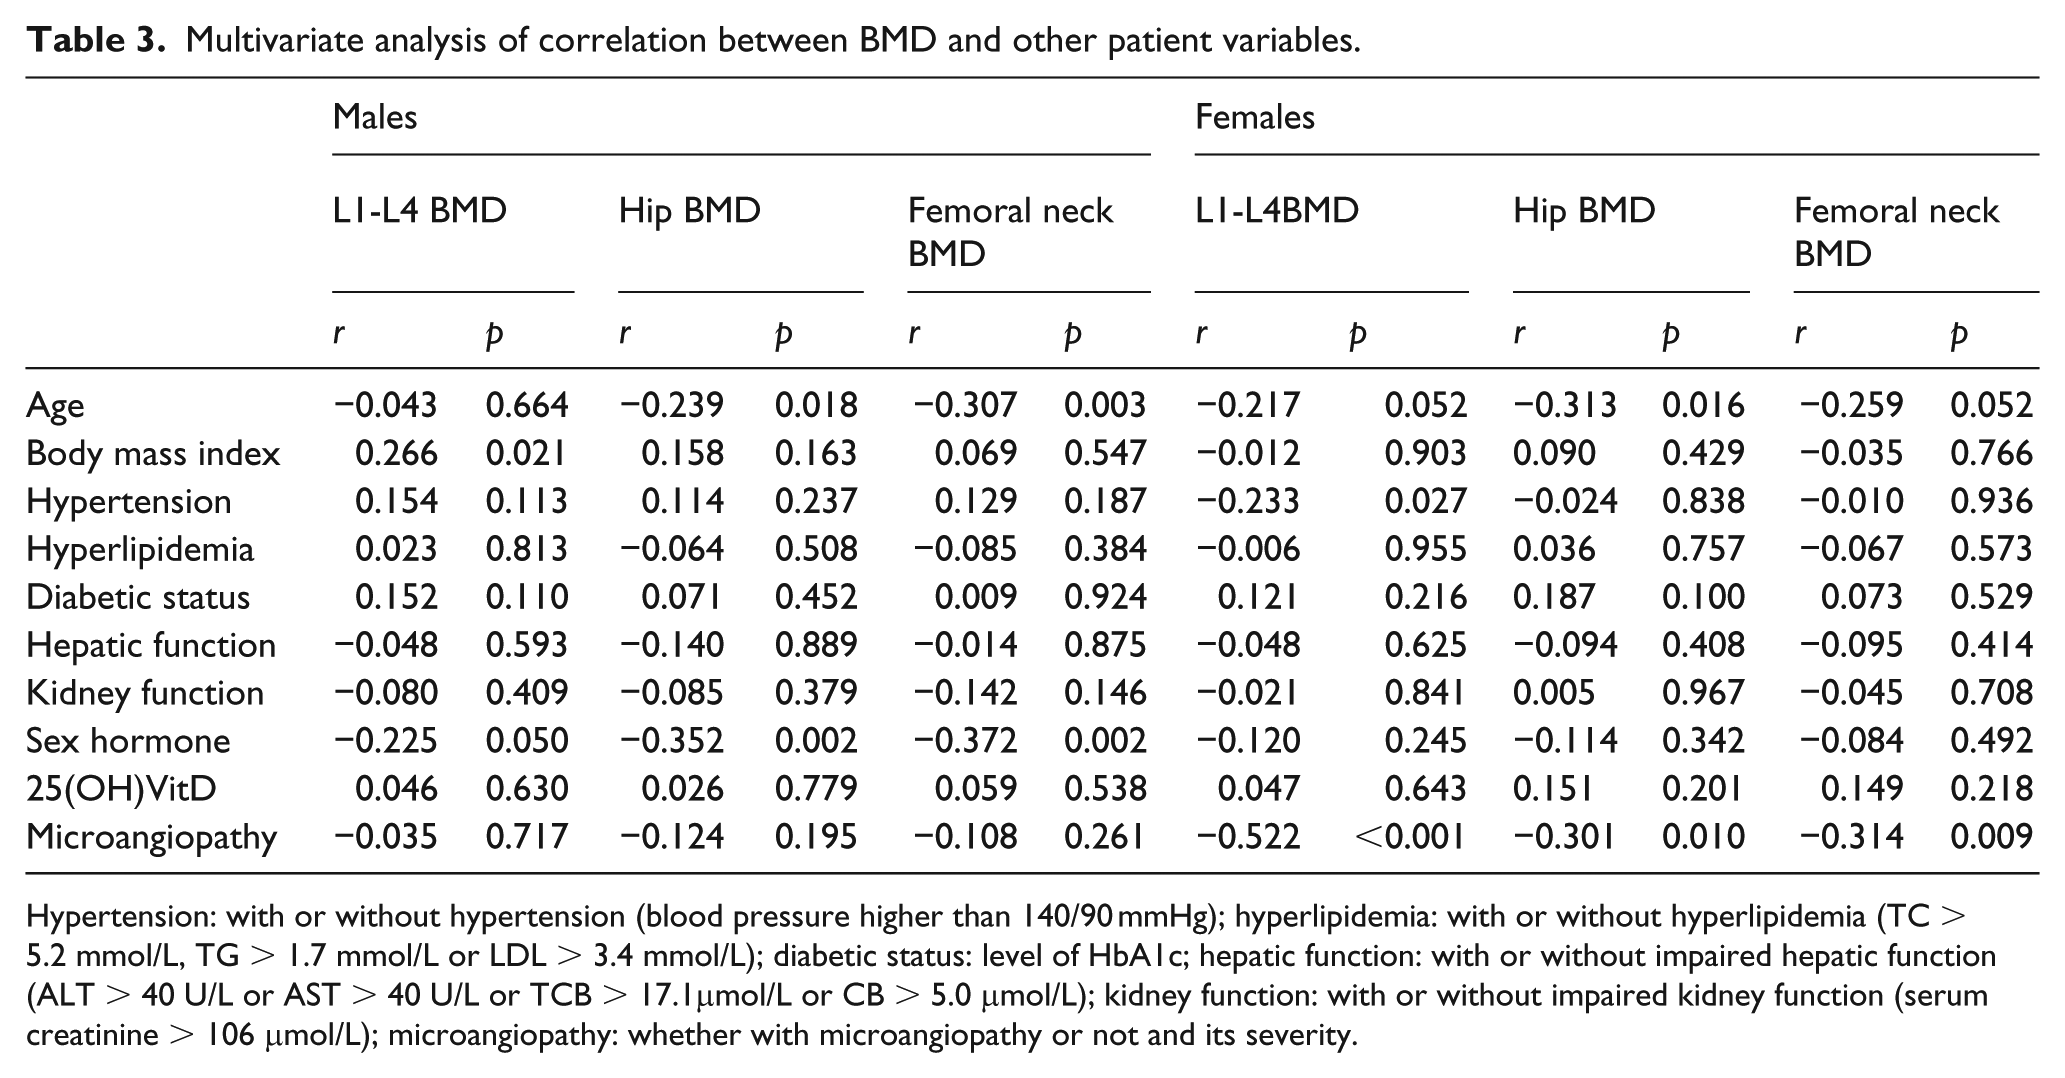
Hypertension: with or without hypertension (blood pressure higher than 140/90 mmHg); hyperlipidemia: with or without hyperlipidemia (TC > 5.2 mmol/L, TG > 1.7 mmol/L or LDL > 3.4 mmol/L); diabetic status: level of HbA1c; hepatic function: with or without impaired hepatic function (ALT > 40 U/L or AST > 40 U/L or TCB > 17.1μmol/L or CB > 5.0 μmol/L); kidney function: with or without impaired kidney function (serum creatinine > 106 μmol/L); microangiopathy: whether with microangiopathy or not and its severity.
Discussion
We found that BMD was the lowest at the lumbar spine, hip and femoral neck, and that the rate of osteoporosis was the highest in group Ⅲ of T2DM patients (both males and postmenopausal females) who had the highest 24-h urine protein concentration. It remains possible that BMD in the three groups may be affected by medication with glucose-lowering agents. It has been shown that metformin could increase the BMD of diabetic patients, 16 while thiazolidinediones may lower the BMD of diabetic patients and increase their risk of fracture. 17 However, we observed no statistically significant difference in the prescription of anti-diabetic medications in the three groups in both genders, suggesting that differences in BMD across the three groups of our study population were unlikely due to anti-diabetic medications. BMD is determined by different factors. Age has been negatively associated with BMD in previous studies.18,19 Our study confirmed these results (Table 3). The slightly protective effect of high BMI on BMD in our finding is also similar to that found in other studies. 11 In addition, hypertension and diabetes are known risk factors for bones. Sex hormone is a well-known protective factor for BMD. However, our multivariate analysis revealed the total testosterone was negatively correlated with BMD in men, while estradiol was not correlated with BMD in women. Our results are in conflict with the fact that sex hormones are well-established factors for bone health. We speculate that it may be attributed to the following factors: (1) in this study, the sex hormones we tested were total testosterone and estradiol which included free forms and those bound to sex hormone-binding globulin (SHBG). In males, free testosterone, SHBG and total testosterone were different with regard to correlation with BMD in most studies.20–22 Similar results were found in females. 23 We speculated that total testosterone and estradiol used in the current study may partially explain the differences in our findings from other studies. (2) The population of the current study consisted of diabetic patients, while most studies demonstrated a clear correlation between sex hormones and BMD were in non-diabetic patients. Abnormal fasting plasma glucose level in our study population could blunt such a correlation. Similar results were also found in other studies. 24 Even most of the independent variables such as age, BMI, hypertension, hyperlipidemia, diabetic status, hepatic function, kidney function, sex hormones, vitamin D and microangiopathy were included in the multivariate analysis, our results showed that among these patients (661 patients), microangiopathy was independently and negatively correlated with BMD in females. Interestingly, BMD was negatively associated with microangiopathy in postmenopausal female T2DM patients, whereas there was no such association in male T2DM patients. Furthermore, β-CTX, as the bone resorption marker, was the highest in Group III, which represented the highest bone resorption level. Thus, we assumed that microangiopathy was associated with bone loss in postmenopausal women. However, the underlying mechanism for sexual difference is unclear. It can be speculated that different sex hormones directly lead to difference in BMD itself. Bone loss in postmenopausal women was 1.7 times faster than that in men in the same age. 25 It may be speculated that females are more sensitive to the detrimental effect of vasculature on BMD than males.
Diabetic microangiopathy mainly manifests as diabetic nephropathy and diabetic retinopathy. Classification based on both 24-h urine protein and ocular fundus photography takes into consideration both diabetic nephropathy and diabetic retinopathy and may offer a useful scheme to better understand and stratify patients with diabetic microangiopathy. Our study demonstrated that the 24-h urine protein as a surrogate marker of microangiopathy independently and negatively correlated with BMD; however, it remains to be investigated whether diabetic microangiopathy correlated with lower bone density. We found that the bone resorption marker β-CTX increased with reducing BMD suggesting that the mechanism of bone loss was through increased bone resorption. A prospective randomized controlled study showed that calcitriol reduced proteinuria and improved BMD in patients with diabetic nephropathy. 25 Currently, we have no direct evidence for association of low bone mass and microangiopathy in diabetic patients. Burkhardt et al. 26 found that the number of arterial capillaries and sinuses per unit area decreased in osteoporotic bones. In turn, the number of capillaries next to remodelling sites in adult human bone increased. Kusumbe et al. 27 found that type H vessels promoted bone formation. Furthermore, a considerable body of laboratory studies demonstrated that molecular signals between bone and blood vessels are essential to bone growth and bone reconstruction. For example, pro-angiogenic factors including vascular endothelial growth factor (VEGF),2,3 fibroblast growth factors (FGF),28,29 platelet-derived growth factor (PDGF) 30 promoted blood vessel development and contributed to bone formation. Ovariectomized mice, as in mouse osteoporosis model, revealed a significant decrease in angiogenic stimulator VEGF 31 or PDGF 30 expression in bones. After injecting angiogenic stimulator PDGF-BB to ovariectomized mice, the bone quality of the mice significantly improved. 30 These findings suggest that microvascular changes in the body may be associated or concurrent with bone loss in diabetic postmenopausal women, but clinical and laboratory evidence is required to establish whether such an association is present between microangiopathy and low bone mass in diabetic postmenopausal women.
There are several potential limitations in this study. The biomarkers in our study were all clinical parameters which were affected by many factors and histopathological studies should be undertaken to support the conclusion of the study findings. Moreover, this is only a cross-sectional study highlighting a phenomenon of higher bone loss in postmenopausal women with diabetic microangiopathy and could not establish a cause-and-effect relationship between microangiopathy and BMD. The causal relationship and the underlying mechanism remain to be elucidated. Furthermore, 24-h urine protein is an indirect marker for evaluating vasculopathy. A more direct tool for evaluating vascular function such as the functional perfusion magnetic resonance imaging (MRI) technique should be used to assess the association between vascular function and BMD in the future study.
In summary, these results demonstrate a negative correlation between BMD and microangiopathy in postmenopausal women with T2DM. However, more prospective studies are needed to confirm this.
Footnotes
Acknowledgements
N.Z., Y.Z., and X.P. contributed equally to this work.
Declaration of conflicting interests
The author(s) declared no potential conflicts of interest with respect to the research, authorship, and/or publication of this article.
Funding
This study was supported by the National Natural Science Foundation of China (NSFC 81500650), the Fund for Distinguished Young Scholars in Tongji University (2015KJ053), the Shanghai Municipal Natural Science Foundation (13ZR1432100) and the National High Technology Research and Development Programme 863 (2013AA032203).