
Abstract
Background:
The prevalence of ‘low bone mineral density (BMD)’ in Type 2 diabetes (T2DM), especially stratified by body mass index, is seldom reported. The relation of the euthyroid range and low BMD in T2DM remains to be further elucidated.
Objectives:
We aim to investigate the thyroid hormones’ impact on BMD among euthyroid patients with T2DM.
Design and methods:
A total of 1452 hospitalized T2DM patients with normal thyroid function (43.6% males aged over 50 and 56.4% postmenopausal females) were enrolled in this cross-sectional study. BMD was measured at lumbar spine by GE lunar dual-energy X-ray absorptiometry system, and ‘low BMD’ was defined as T-score <−1.0 SD. The prevalence of ‘low BMD’ was compared between obese and nonobese (body mass index < 25 kg/m2) groups for both sexes, and the relation of low BMD and free T4 quartiles was explored by multiple logistic regression.
Results:
The general prevalence of ‘low BMD’ was 12.3% for male patients aged over 50 (15.5% in the nonobese group and 8.0% in the obese group) and 49.8% for postmenopausal females (56.7% in the nonobese group and 48.9% in the obese group). After adjustment in multiple linear regression, free T4 level remained significantly related to decreased BMD in nonobese male subgroup. Multiple logistic regression revealed that BMD of the highest free T4 quartile (1.12–1.48 ng/dL) decreased significantly than other three quartiles after adjusting for confounding factors including age, body mass index, serum calcium and creatinine level, fasting glucose, alkaline phosphatase, glycosylated hemoglobin, total cholesterol, and smoking history (OR = 2.724, 95% CI = 1.085–6.840, p = 0.033). No significant relation was found in obese male or postmenopausal female groups.
Conclusion:
High-normal free T4 is a potential independent risk factor for ‘low BMD’ in nonobese male T2DM patients aged over 50. Close attention should be paid to thyroid function profile, even within normal range, in nonobese men with underlying higher fracture risks on diabetes status.
Introduction
Type 2 diabetes (T2DM) and osteoporosis are two rapidly growing public health problems in the aging population. China has both the largest T2DM population and the fastest increase of elderly people in the world. The proportion of the elderly population in China is 15.5% at present and will increase to 31.2% by 2050, 1 while the estimated population with osteoporosis will increase from 60 million to over 120 million. In 2019, a nationwide, multicenter dual-energy X-ray absorptiometry (DXA) survey estimated the age-standardize prevalence of osteoporosis in China to be 6.46% for men and 29.13% for women aged 50 years and older. 1 Lee and colleagues 2 in 2014 have reported the prevalence of osteoporosis in Koreans as 12.2% and 32.8% for men and women over 50, respectively, based on similar DXA measurement, which were higher than those of the Chinese study probably due to their lower body mass index (BMI) in average. Compared with the well-documented studies and management of postmenopausal female osteoporosis, male osteoporosis, which is lacking risk factor data, remains to be underscreened, underdiagnosed, and undertreated both in primary and secondary prevention of fragility fractures. 3
Previously, a number of meta-analyses have reported an increase in the risk of fractures in T2DM. There is a 1.3- to 2.1-fold increased risk of hip fracture,4,5 and odds ratios (ORs) for spine fractures have ranged across studies from 1.16 to 2.03.4–8 Interestingly, a study conducted in Japan found that T2DM was associated with a stronger increased risk of vertebral fractures in men (OR 4.7; 95% CI 2.19–10.20) than in women (OR 1.9, 95% CI 1.11–3.12). 9 Another meta-analysis showed that the pooled prevalence of osteoporosis in male patients (37.0%) with T2DM in China mainland was even close to that of female patients (44.8%). 10 On the other hand, T2DM is associated with higher bone mineral density (BMD) and lower bone turnover. The discrepancies in BMD and fracture risk and the underestimated prevalence of low BMD among patients with T2DM are partly due to obesity or overweight, since BMI is positively associated with BMD. Although the different designs and characteristics of the populations have been studied, the prevalence of low BMD and the pathophysiology of bone fragility in T2DM remain to be further elucidated.
Thyroid hormones were well documented as essential regulators for bone health maintenance. 11 Interestingly, a meta-analysis including data from 12 prospective cohort studies demonstrated that lower thyroid-stimulating hormone (TSH) and higher free thyroxine (T4) levels within the reference range were associated with 22–25% increased risk of hip fractures. 12 Another study showed that even in healthy men at the age of peak bone mass, physiological variation in thyroid hormone concentrations affects bone density, with higher levels of triiodothyronine (T3) and T4 being associated with less favorable bone density and content. 13 These findings suggest the possibility that thyroid status even across the normal reference range is a continuous variable related to BMD and bone strength. Nevertheless, the relation of the euthyroid range and low BMD in T2DM is not fully understood. A recent retrospective study from Shanghai including 226 male and 213 female subjects aged over 65 years old showed that low TSH levels within euthyroid range are associated with decreased BMD at the femoral neck and hip joint in postmenopausal T2DM women. 14 However, the impact of obesity on BMD was neglected in the analysis. Another prospective cohort study conducted in Brazil claimed that the thyroid hormone profile was not associated with variations in BMD and body composition after 1 year follow-up in euthyroid healthy women who were both normal weight and overweight. 15
Taken together, we aim to investigate the physiological thyroid hormones’ impact of T2DM patients on bone density between different BMI categories in a single center of East-South China, providing a new insight of the association between euthyroid status and impaired skeletal metabolism within diabetes.
Materials and methods
Study design and participants
We conducted a cross-sectional study at the Department of Endocrinology, Sir Run Run Shaw hospital, Hangzhou, China. During the period of 2013 January and 2018 July, 5481 hospitalized patients with T2DM were screened in our study. Middle-aged and older subjects, defined as postmenopausal female and male patients aged over 50, 16 were included for further analysis based on bone density. The excluded criteria were as follows: (1) lack of entire data of thyroid function test or BMD measurement; (2) previously diagnosed as thyroid dysfunction or osteoporosis; (3) had abnormal serum TSH, free T4, total T4, total T3, or free T3 levels; (4) women with early menopause before 40 years, hysterectomy, and/or bilateral oophorectomy; (5) accept medication of glucocorticoid, anti-osteoporosis treatment, and thyroid or gonadal hormone replacement; (6) patients with severe hepatic or renal dysfunction, accompany malignant neoplasm, history of fractures; and (7) patients having calcium or vitamin D supplementation. They were excluded due to the low rate of prophylactic usage for osteoporosis in China (0.27% in men and 0.29% in women), 17 so we could barely investigate their impacts on the relation of thyroid and bone density. Finally, the remaining 1452 patients with normal thyroid function were enrolled in the current study (Figure 1).

Screen flowchart of the study population.
Clinical examination and laboratory variables
All patients underwent routine history collection and physical examination. Key variables of interest were obtained as follows: gender, age, height, weight, waist, blood pressure, duration of T2DM, smoking history, alcohol uptake, medication history, menstrual state, and history of fracture. BMI was calculated as weight (kg) divided by height squared (m2), and subjects were categorized into obese group (BMI
Bone density measurements
BMD (g/m2) of lumbar spine was evaluated by DXA (Prodigy; GE Healthcare, Madison, WI. USA). Measurement was always performed by the same experienced operator according to the recommendation of the International Society for Clinical Densitometry in 2007. 19 Scans were analyzed using Lunar equipment software (enCORE 2009). The coefficient of variation was 0.91% at the lumbar spine (L1-L4). According to the Chinese Society of Osteoporosis and Mineral Research (CSOBMR) criteria, 16 osteoporosis was diagnosed based on the T score of bone density for postmenopausal women and men aged over 50. In this study, ‘low BMD’ was defined as a T score < −1.0 SD and normal BMD as T score ⩾ −1.0SD.
Statistical analysis
Variables were expressed as median (first to third quartile) or numbers (frequency). To compare between the subjects with normal or low BMD, we used the Mann–Whitney test for continuous variables and the chi-square (χ2) test for categorical ones. We investigated the correlation between bone density and thyroid function parameters by performing Pearson’s correlation analysis. The association between serum free T4 and BMD was analyzed in a multiple linear regression model with BMD as the dependent variable. Free T4 levels were further categorized into quartiles (first quartile, second quartile, third quartile, and fourth quartile) for one-way analysis of variance. Multiple logistic regression (OR, 95% CI) was undertaken to explore the prevalence of ‘low BMD’ across free T4 quartiles, with age, BMI, serum creatinine, serum calcium, serum ALP, fasting glucose, HbA1c, TC, and smoke history adjusted. All statistics were conducted upon SPSS 20.0, and a value of <0.05 was considered statistics significantly.
Results
Clinical characteristics
This study enrolled 1452 euthyroid T2DM patients, including 819 male patients aged over 50 (56.4%) and 633 postmenopausal female patients (43.6%) with balanced diabetes duration, BMI, waist and PTH or 25-hydroxyvitamin D level in average (Table 1). Compared to postmenopausal women, men had higher levels of BMD, serum creatinine and uric acid, and lower levels of TSH, free T4, free T3, serum calcium, phosphorus, serum LDL, fasting glucose, and HbA1c.
Clinical characteristics of the middle aged and older T2DM patients with normal thyroid function.

Data were expressed as median (first to third quartile) or frequency (%). p values at the Mann–Whitney test or chi-square test, as appropriate.
ALP, alkaline phosphatase; BMD, bone mineral density; D-25(OH), 25 hydroxyvitamin D; free T3, free triiodothyronine; free T4, free thyronine; HbA1c, glycosylated hemoglobin; HDL-c, high-density lipoprotein-cholesterol; LDL-c, low-density lipoprotein-cholesterol; NA, not available; PTH, parathyrin; T2DM, Type 2 diabetes; total T3, total triiodothyronine; TSH, thyroid stimulating hormone; total T4, total thyroxine; TG, triglyceride; TC, total cholesterol; VLDL-c, very low-density lipoprotein-cholesterol.
p value < 0.01, *p value < 0.05.
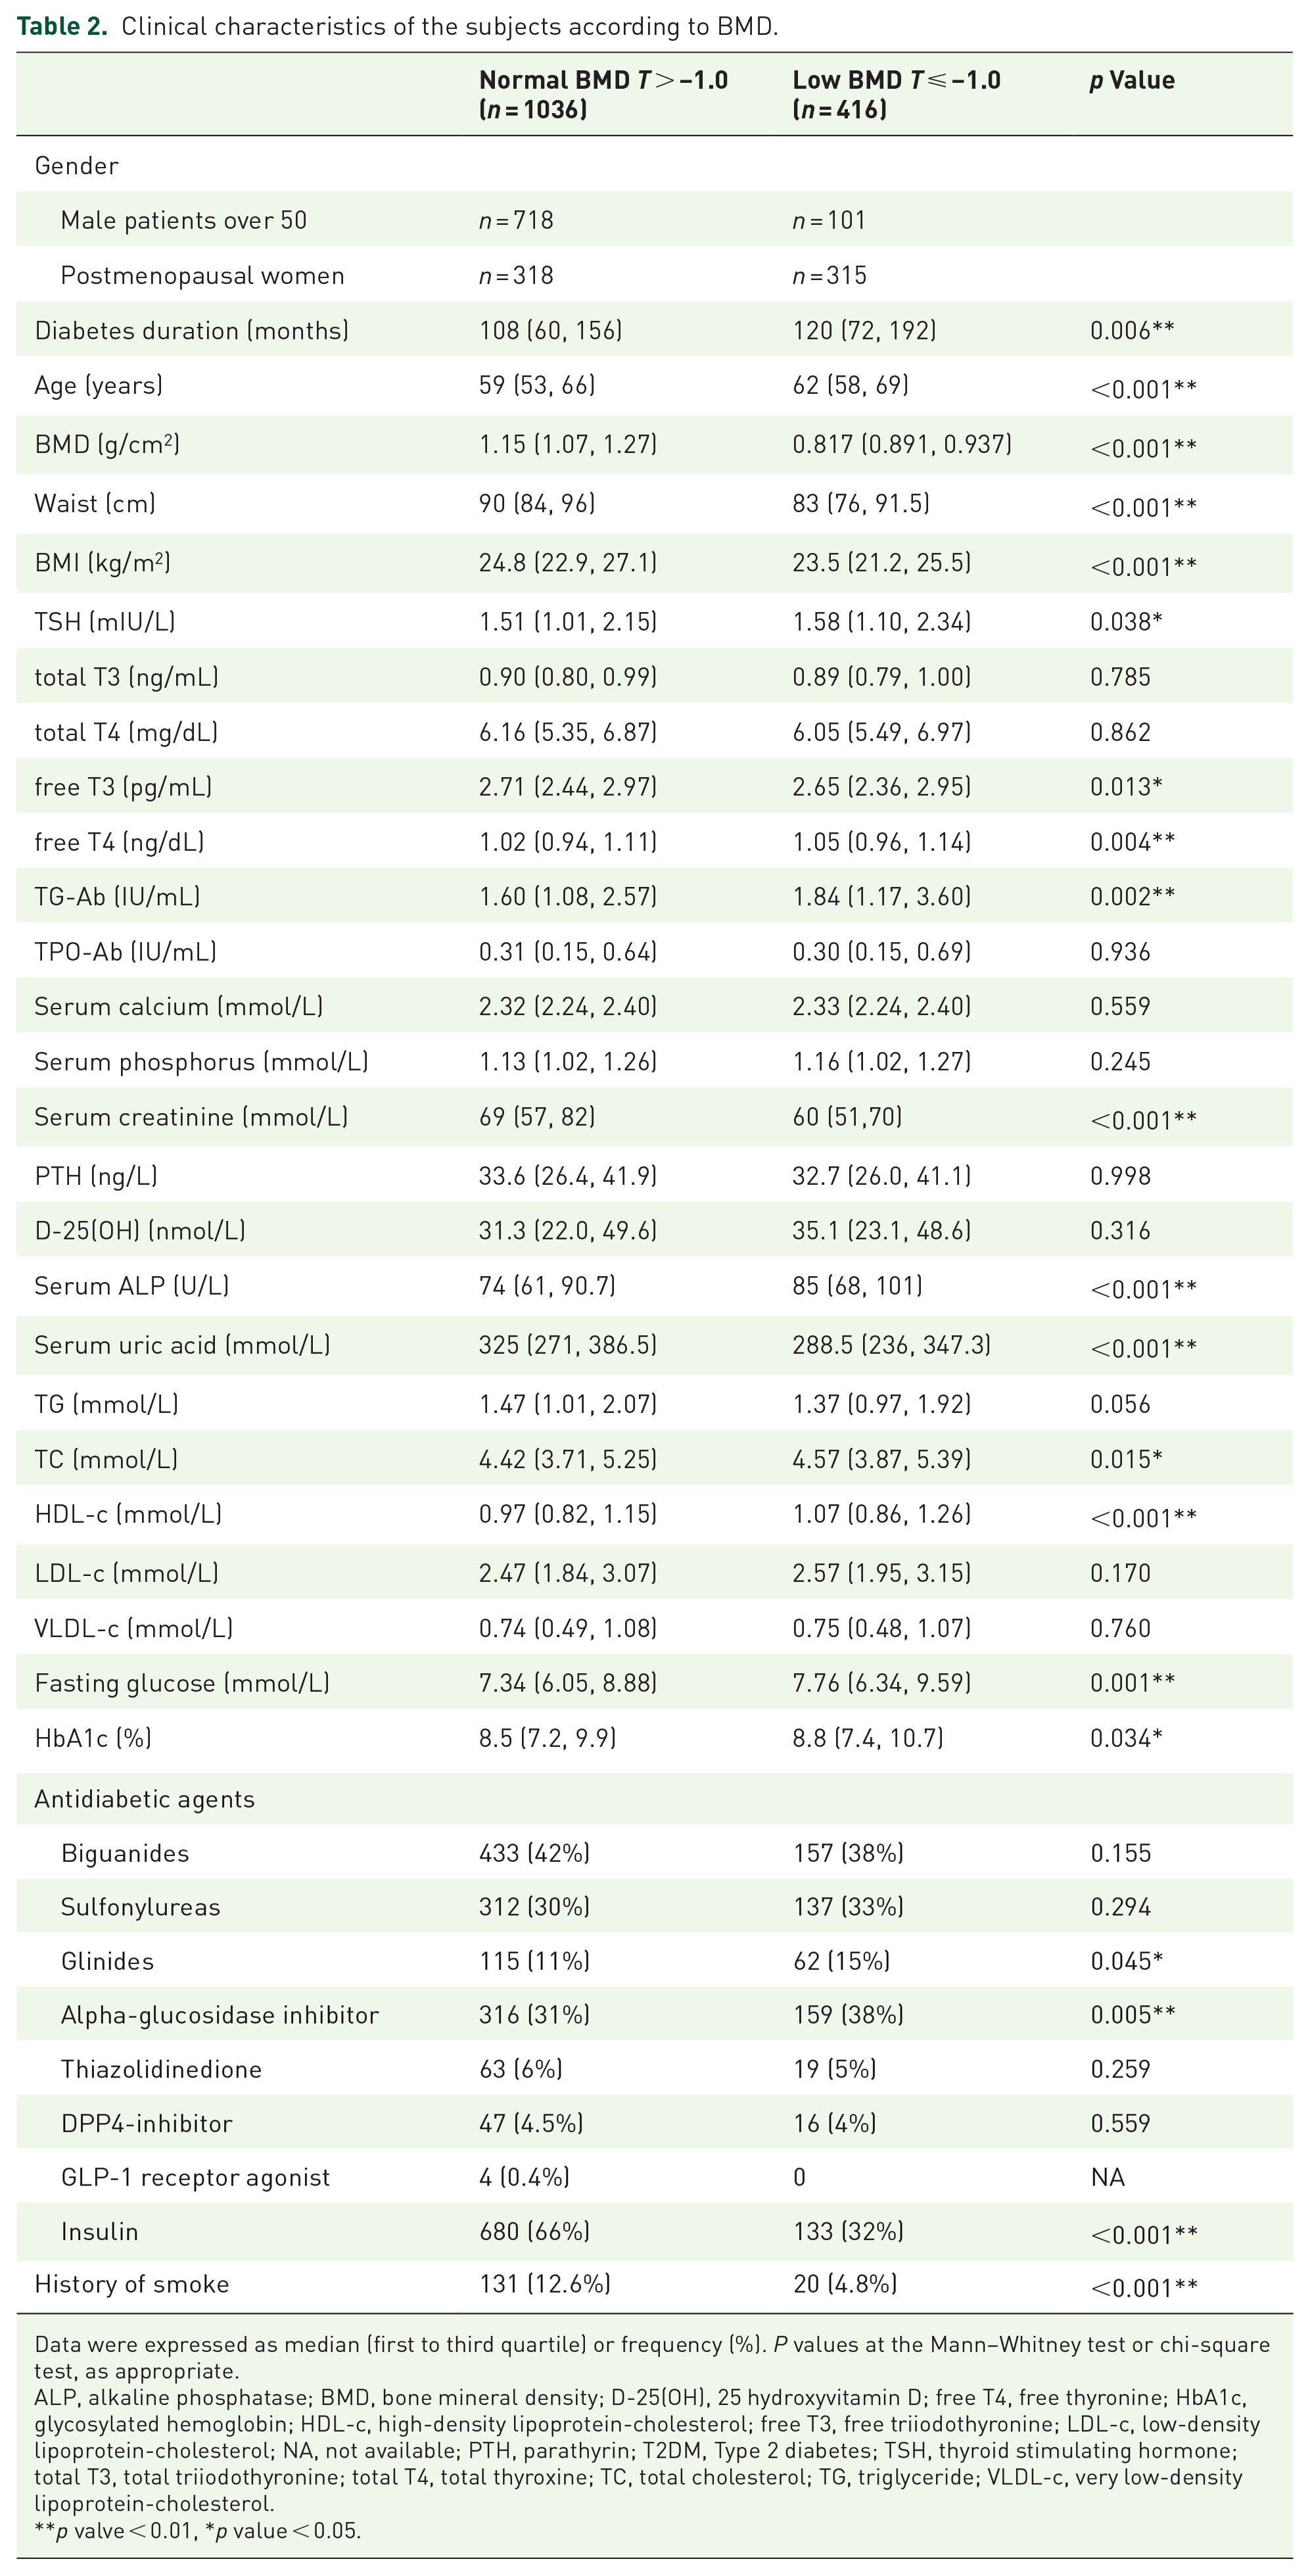
To investigate the underlying risk factors of low BMD, subjects were further divided into normal BMD group (n = 1036) and low BMD group (n = 416). The general prevalence of ‘low BMD’ was 12.3% for male patients and 49.8% for postmenopausal female patients. As shown in Table 2, the concentrations of TSH, free T4, and TG-Ab were significantly higher in low BMD, while free T3 levels were slightly lower. The low BMD group had significantly higher levels of age, diabetes duration, serum ALP, serum TC, serum HDL-c, fasting glucose, and HbA1c, and lower levels of the waist, BMI, serum creatinine, and uric acid, compared with normal BMD group. Further analysis showed a significant positive correlation between age and diabetic duration (Table S1 in the Supplemental section). Besides, there was no difference in free FT4 level between female and male subgroups (Table S2 in the Supplemental section). Among the eight categories of antidiabetic agents, glinides and alpha-glucosidase inhibitor were more frequently applied in the low BMD group, while insulin injection was more common in the normal BMD group. There was no difference in serum calcium, phosphorus, PTH or 25-hydroxyvitamin D between the two groups.
Clinical characteristics of the subjects according to BMD.
Data were expressed as median (first to third quartile) or frequency (%). P values at the Mann–Whitney test or chi-square test, as appropriate.
ALP, alkaline phosphatase; BMD, bone mineral density; D-25(OH), 25 hydroxyvitamin D; free T4, free thyronine; HbA1c, glycosylated hemoglobin; HDL-c, high-density lipoprotein-cholesterol; free T3, free triiodothyronine; LDL-c, low-density lipoprotein-cholesterol; NA, not available; PTH, parathyrin; T2DM, Type 2 diabetes; TSH, thyroid stimulating hormone; total T3, total triiodothyronine; total T4, total thyroxine; TC, total cholesterol; TG, triglyceride; VLDL-c, very low-density lipoprotein-cholesterol.
p valve < 0.01, *p value < 0.05.
Relation between serum free T4 and BMD
In consideration of the strong effect of obesity on bone health, patients were further stratified by BMI in both genders. The prevalence of ‘low BMD’ in nonobese (BMI < 25 kg/m2) and obese (BMI ⩾ 25 kg/m2) male subjects was 15.5% and 8.0%, respectively. 56.7% nonobese females had low BMD, while 48.9% obese females had the status. Correlation analysis showed the free T4 level correlated negatively with the BMD of lamber spine in nonobese men over 50 (r = −0.125, p = 0.007), and this relation remained significant after adjustment of age and BMI (r = −0.102, p = 0.029). No correlation was found in postmenopausal female subgroups after adjustment. Besides, BMD did not correlate with TSH or free T3 level in either subgroup (data not shown).
Multiple linear regression revealed reverse association between free T4 and BMD in nonobese men (BMI < 25 kg/m2) over 50 in Model1 (unadjusted, β = −0.175, p = 0.007). This association remained significant after further adjustments in Model2 (adjustment of age and BMI, β = −0.146, p = 0.027) and Model3 (adjustment of age, BMI, serum creatinine, serum calcium, serum ALP, fasting glucose, HbA1c, TC, and smoke history, β = −0.166, p = 0.048). No association was found between other thyroid hormone parameters and BMD in obese groups for both sexes or nonobese postmenopausal female patients in Model3 (Figure 2).

Multiple linear regression of the association between thyroid hormone parameters and BMD in non-obese male patients (a), obese male patients (b), non-obese female patients (c) and obese female patients (d).
Subsequently, levels of free T4 were cataloged into quartiles, namely first quartile (Q1, 0.70–0.95 ng/dL, n = 395), second quartile (Q2, 0.95–1.03 g/dL, n = 363), third quartile (Q3, 1.03–1.12 ng/dL, n = 336), and fourth quartile (Q4, 1.12–1.48 ng/dL, n = 358). Post hoc analysis revealed that for male patients over 50, the BMD of the highest quartile differed significantly from the other three quartiles. The prevalence of ‘low BMD’ in nonobese male subgroup was 20.9% in the highest quartile (n = 130) and 11.5% in the lowest quartile (n = 115) (χ2 = 0.385, df = 3, p = 0.011) [Figure 3(a)]. No significance was found in obese male or postmenopausal female groups [Figure 3(a) and (b)].

Percentage of low BMD in euthyroid T2DM patients according to free T4 quartiles in obese and nonobese subjects. BMD of male T2DM patients aged over 50 (a) and postmenopausal female T2DM patients (b) Nonobese group: BMI < 25 kg/m2, obese group: BMI ⩾ 25 kg/m2.
High physiological free T4 level is an independent risk factor of low BMD in nonobese male patients with T2DM
Multivariate-adjusted ORs for ‘low BMD’ across free T4 quartiles are shown in Figure 4. The ORs for ‘low BMD’ were significantly higher in the fourth quartile of serum free T4 levels compared with the first quartile in nonobese male subjects (BMI < 25 kg/m2) in Model1 (unadjusted, OR = 2.022, 95% CI = 1.003–4.007) and Model 3 [adjusted for age, BMI, serum creatinine, serum calcium, serum ALP, fasting glucose, HbA1c, TC, and smoke history, OR = 2.724, 95% CI = 1.085–6.840, shown in Figure 4(a)]. No significant difference was found in other groups in Model1 (data not shown) or Model3 [Figure 4(b)–(d)].

Multivariate odds ratios for the low BMD of lumbar spine in middle-aged and older T2DM patients according to free T4 quartiles by BMI stratification. Data were expressed as odds ratios (95% confidence interval) in nonobese (a) and obese (b) male T2DM patients aged over 50 and in nonobese (c) and obese (d) female patients with postmenopausal state. Multiple logistic regression analysis was undertaken using Model3 (adjusted with age, BMI, serum creatinine, serum calcium, serum ALP, fasting glucose, HbA1c, total cholesterol, and smoke history). Nonobese group: BMI < 25 kg/m2, obese group: BMI ⩾ 25 kg/m2.
Discussion
There is limited clinical research that assesses the interactions among diabetes, thyroid function, and skeletal metabolism, especially with stratified analysis of BMI. Our large-scale, cross-sectional study showed the negative correlation between thyroxine and bone density at the lumbar spine in T2DM patients with euthyroidism including males aged over 50 and postmenopausal females. To be specific, bone density was decreased significantly in the highest normal free T4 category among nonobese male patients.
Previous clinical studies that exploring relation between thyroid hormones and osteoporosis always excluded subjects with diabetes,20–22 partly due to the higher BMD levels (lumbar spine Z-score+0.41, total hip Z-score+0.27) of diabetic patients reported previously. 8 More recent large population-based study identified the higher fracture risk of osteoporotic patients with T2DM, as compared to those without T2DM. 6 A meta-analysis even reported more than one-third (37.8%) of T2DM patients suffered from osteoporosis (26.5% in younger patients) in China mainland by BMD measurement, although much more women were involved in this analysis and 29 out of 41 involved studies enrolled subjects aged 60 or older. 10 In the present study that included 1452 hospitalized T2DM patients, the prevalence of ‘low BMD’ reached 12.3% for males over 50 and 49.8% for postmenopausal females, almost twice as high as the age-standardize prevalence of osteoporosis in general Chinese people aged 50 years and older by the multicenter DXA survey. Despite the increasing prevalence, male osteoporosis remains largely undiagnosed and undertreated. Our study also reported 15.5% of nonobese male patients had ‘low BMD’, whereas 8.0% of obese males had the problem, highlighting the importance of detecting the underlying osteoporotic male patients aged over 50 with T2DM, especially those who were nonobese.
Both T4 and TSH were considered probable regulators for bone remodeling in general population, but the confusion regarding the effect of thyroid hormones within normal range on skeletal health has a long history. Zantut-Wittmann and colleagues suggested that in young euthyroid women (aged 20–39) with no diabetes, thyroid hormone had no relation with BMD and body composition after one-year follow-up. 15 More research has examined this impact among middle-aged and elderly individuals. A meta-analysis involving 12 prospective studies in euthyroid adults (average age: 64) revealed that lower TSH and higher free T4 levels were associated with an increased risk of hip fracture. 12 Evidence from the USA and Korea have showed that in healthy postmenopausal women, low-normal TSH levels were associated with higher prevalence of osteoporosis of hip, lumbar spine, and femoral neck.22–24 A retrospective study from Shanghai also showed that low-normal TSH levels were associated with decreased BMD at the femoral neck and hip joint in postmenopausal T2DM women. 14 However, their subjects had a higher BMI of over 25 kg/m2 and an older age of over 65 in average. On the other hand, Hwangbo’s team from Korea reported the negative correlation of high-normal free T4 and trabecular bone scores in postmenopausal women, and TSH levels were not related to trabecular bone scores in either gender. 20 These studies together suggested that high-normal free T4 concentration, rather than low-normal TSH, was associated with impaired bone metabolism, which was in line with our T2DM data that included both male patients aged over 50 and postmenopausal females. Therefore, we stratified the subjects as obese and nonobese groups by BMI in both genders to exclude the impact of body weight on BMD and identified that the highest free T4 quartile (1.12–1.48 ng/dL) might be an independent risk factor for ‘low BMD’ in nonobese male patients with T2DM.
There were two models supporting our results. One was a mice model lacking of thyroid hormone receptor beta 25 to investigate the molecular mechanism of osteoporosis in thyroid disease. It showed that adult (TRβ−/−) mice, with elevated thyroid hormone levels, displayed the phenotype of osteoporosis with accelerated bone resorption independent of high circulating TSH concentrations. The other was the ideal clinical model to test whether low TSH induces osteoporosis. 26 They determined BMD and markers of bone metabolism in two male siblings aged 9.8 and 6.8 years with isolated TSH deficiency, due to a mutation of the TSH β-subunit gene. Both patients had extremely low to undetectable TSH levels, in the face of normal thyroid hormone levels under L-T4 replacement therapy. However, their BMD and markers of bone metabolism were within the normal range, suggesting that TSH deficiency has no deleterious effect on BMD in the human, at least in childhood. It is noteworthy that both the TRβ−/− mice model and the isolated TSH deficiency clinical model were males, consistent with our findings in male patients with T2DM.
The possible mechanism to explain our findings is the interaction between thyroid and sex hormones. Thyroxine directly reduces bone density and bone quantity, 27 while it improves bone health indirectly by promoting testosterone production in men. Testosterone, on the other hand, is considered to be a protective factor of bone maintenance 28 and hence plays a role in thyroxine-bone metabolic balance. However, about 33–64% patients with T2DM had lower testosterone concentration than nondiabetic individuals.29–31 In this case, even high-normal free T4 level seemed to fail in acquiring enough testosterone for counterbalance, thus resulting in low BMD. Second, endocrine factors produced by adipose tissue regulate skeletal metabolism. For instance, adiponectin could modulate RANK/RANK-ligand/OPG signaling and indirectly increase osteoclast formation, hence promoting osteoporosis, 32 circulating leptin secreted by adipocytes directly increase bone formation and inhibit bone modeling through activation of sympathetic nervous system, resulting in a net effect of positive balance. 22 Therefore, the relatively higher thyroxine resulting in a lower bone density in nonobese male patients might be explained by the lack of protective effect of adipose tissue.
Another interesting finding of our study was the underlying impacts of antidiabetic medications on low BMD. We compared the application of eight kinds of drugs between BMD categories and found that insulin injection was more frequently used in normal BMD group, while glinides and alpha-glucosidase inhibitor were more commonly applied in the low BMD group. It was well documented previously that thiazolidinediones and, to a lesser extent, sodium-glucose cotransporter inhibitors might have adverse effects on bone, whereas metformin, GLP1 analogs, or DPP4 inhibitors may have beneficial effects.33,34 But we have reported for the first time that glinides and alpha-glucosidase inhibitor may be associated with low BMD. Future studies are needed to confirm their impacts on BMD in a prospective design, together with data of hypoglycemia events and intestinal flora change, therefore sorting out the confounding factors and the possible mechanism. On the other hand, these two drugs should be used with caution in T2DM patients at high risk of fractures.
There were several limitations in our study. First, under a cross-sectional design, the casual relation between free T4 level within normal range and BMD loss could not be definitely determined. Besides, sample size calculation and adjustment were not performed due to the study design. Second, we evaluated bone health in T2DM mainly by BMD. BMD measured by DXA is higher in obese people, since higher BMI and soft tissue thickness cause error in DXA measurement through assumptions about abdominal thickness and beam hardening effects. 35 Third, data of physical activity of the patients were not collected in the present study. Optimal exercise like intense walking or resistance exercise is beneficial for the improvement of bone mass, especially for patients with diabetes.36–38
Conclusions
The present study revealed the significant correlation of high-normal free T4 level (1.12–1.48 ng/dL) and low BMD in euthyroid T2DM male patients over 50, highlighting the potential risk of high-normal free T4 on early bone fragility. Close attention should be paid to thyroid function profile, even within normal range, in nonobese men aged over 50 with underlying higher fracture risks on diabetes status. Further long-term prospective studies are warranted to establish our results.
Supplemental Material
sj-docx-1-taj-10.1177_20406223231195627 – Supplemental material for High-normal free thyroxine level is related with decreased bone mineral density in nonobese male patients with type 2 diabetes over 50 years old
Supplemental material, sj-docx-1-taj-10.1177_20406223231195627 for High-normal free thyroxine level is related with decreased bone mineral density in nonobese male patients with type 2 diabetes over 50 years old by Hanxin Zhao, Dike Shi, Guoxing Wang, Yu Ruan, Xiaocheng Feng, ChengFang Jia, Qingqing Wang and Xuehong Dong in Therapeutic Advances in Chronic Disease
Footnotes
References
Supplementary Material
Please find the following supplemental material available below.
For Open Access articles published under a Creative Commons License, all supplemental material carries the same license as the article it is associated with.
For non-Open Access articles published, all supplemental material carries a non-exclusive license, and permission requests for re-use of supplemental material or any part of supplemental material shall be sent directly to the copyright owner as specified in the copyright notice associated with the article.