
Abstract
Background:
Emerging lipid-related biomarkers, including the Visceral Adiposity Index (VAI), Lipid Accumulation Product (LAP), and Atherogenic Index of Plasma (AIP), have demonstrated potential in predicting metabolic disorders such as diabetes mellitus (DM) and associated microvascular complications, particularly diabetic kidney disease (DKD) and diabetic retinopathy (DR).
Objectives:
This systematic review and meta-analysis aims to evaluate the association between these biomarkers and microvascular complications in individuals with DM, as well as to assess their diagnostic performance.
Data sources and methods:
A systematic literature search was performed in PubMed, Scopus, Embase, and Web of Science following PRISMA guidelines. Eligible studies examined the relationship between VAI, LAP, and AIP and microvascular complications in DM. The meta-analysis synthesized data using pooled weighted mean differences (WMDs) and area under the receiver operating characteristic curve (AUC) values to evaluate the predictive utility of these biomarkers for DKD and DR.
Results:
A total of 23 studies were included. Patients with DKD had significantly higher levels of LAP (WMD: 12.67; 95% CI: 7.83–17.51; P < .01), AIP (WMD: 0.11; 95% CI: 0.03–0.19; P < .01), and VAI (WMD: 0.63; 95% CI: 0.38–0.89; P < .01) compared to those without DKD. Additionally, each 1-unit increase in LAP (OR: 1.005; 95% CI: 1.003–1.006; P < .01), AIP (OR: 1.08; 95% CI: 1.04–1.12; P < .01), and VAI (OR: 1.05; 95% CI: 1.03–1.07; P < .01) was associated with an elevated risk of DKD. In contrast, no significant associations were identified between these biomarkers and DR. The diagnostic performance of VAI, LAP, and AIP was limited for both DR and DKD, with low discriminatory power.
Conclusion:
VAI, LAP, and AIP are significant predictors of DKD in individuals with DM but exhibit limited relevance for the detection of DR. Although these biomarkers show potential in identifying DKD risk, their overall diagnostic accuracy for DKD and DR remains modest, underscoring the need for further studies to enhance their clinical applicability.
Plain Language Summary
Why This Study Was Done: Diabetes diabetes can lead to serious complications like kidney disease and vision problems. Researchers are looking for new ways to predict these complications early on. Emerging lipid biomarkers, such as VAI, LAP and AIP show promise in predicting metabolic issues. What the Researchers Did: The team conducted a comprehensive review and analysis of studies that looked at how these lipid biomarkers are linked to kidney disease and vision problems in people with diabetes mellitus. What They Found: The analysis included data from 23 studies. It showed that patients with kidney disease had higher levels of these biomarkers compared to those without. However, these biomarkers were not as effective in predicting vision problems. What It Means: This study suggests that certain lipid biomarkers can help identify people with diabetes mellitus who are at risk of developing kidney disease. However, more research is needed to see if these biomarkers are better than traditional methods for managing diabetes and predicting other complications.
Keywords
Introduction
Diabetes mellitus (DM) is a complex disorder characterized by insulin resistance (IR), often accompanied by varying degrees of defects in insulin secretion. This condition ultimately leads to impaired insulin release from pancreatic beta cells. 1 The increasing incidence of diabetes has coincided with a rise in related complications that significantly affect morbidity and mortality, particularly in countries with low and middle socioeconomic status.2,3 Chronic hyperglycemia is known to inflict damage on small blood vessels, thereby increasing the likelihood of microvascular complications in patients with DM, especially those with longer disease duration. 4 These complications, such as diabetic retinopathy (DR), diabetic kidney disease (DKD), and diabetic neuropathy (DN), substantially threaten patient health and compromise quality of life (QoL). 5 Microvascular complications predominantly arise in tissues where glucose uptake does not rely on insulin, such as the kidneys, retina, and vascular endothelium. These tissues are particularly vulnerable as they experience glucose concentrations closely aligned with blood glucose levels. 6 Addressing these comorbidities necessitates a comprehensive and interdisciplinary approach to diabetes management, emphasizing the need for coordinated care strategies to improve patient outcomes. 7
Adipose tissue plays a significant role in the pathophysiology of DM and its associated complications. Adipose tissue can be found as subcutaneous adipose tissue (SCAT) and visceral adipose tissue (VAT) throughout the body. SCAT differs from VAT in several aspects, including anatomical, cellular, and molecular characteristics. 8 VAT contains more inflammatory and immune cells, a lower preadipocyte differentiating capacity, and a greater proportion of large adipocytes. These adipocytes exhibit increased sensitivity to lipolysis and greater insulin resistance than those in SCAT.8,9 VAT adipocytes are also more metabolically active and secrete a range of bioactive substances that influence systemic metabolism, making VAT a stronger predictor of adverse outcomes.8,10
As part of the endocrine system, adipose tissue regulates several biological processes involved in energy homeostasis and metabolic function in target organs such as the liver, muscle, and pancreas. 11 Excess fat accumulation in non-adipose tissues has been linked to the induction of insulin resistance and impaired beta-cell function. 11 Recent investigations have emphasized the pivotal role of VAT in the onset of complications associated with diabetes. 12 Novel lipid parameters, including the visceral adiposity index (VAI), lipid accumulation product (LAP), and atherogenic index of plasma (AIP), have been proposed as better predictors of adverse outcomes, including metabolic syndrome, 13 obstructive sleep apnea, 14 and cardiovascular diseases. 15 The VAI combines body mass index (BMI), waist circumference (WC), and lipid profiles to assess visceral fat distribution, which poses greater metabolic risks due to fat accumulation around internal organs. 16 This index effectively reflects insulin resistance, inflammation, dyslipidemia, and diminished beta-cell function, providing valuable insights for patient management.11,17 Similarly, the LAP integrates WC and triglyceride (TG) levels and has been identified as an early indicator of metabolic impairments and disruptions in lipid metabolism. 18 This parameter has been associated with increased metabolic risk factors and is a biomarker for visceral adiposity. 17 The AIP, calculated as the logarithmic ratio of TG to high-density lipoprotein cholesterol (HDL-C), illustrates the balance between protective and harmful lipoproteins and strongly predicts atherosclerosis and coronary heart disease. 19
Therefore, the primary aim of this systematic review and meta-analysis is to assess the associations between these specific lipid biomarkers and the risk of key diabetic microvascular complications, including DKD, DR, and DN. Additionally, the study evaluates the diagnostic performance of these markers in identifying such complications. By systematically synthesizing current evidence, this study seeks to determine the clinical relevance of these biomarkers for early identification and risk assessment of microvascular complications in individuals with DM.
Methods and Materials
Protocol Registration
This study was carried out according to the PRISMA guidelines (PROSPERO registration: CRD42024596607). 20
Search Strategy
A comprehensive search of the electronic databases PubMed, Scopus, Embase and Web of Science was performed from the beginning to 25st April 2025. Keywords and MeSH terms related to “diabetic kidney disease,” “diabetic retinopathy,” “diabetic neuropathy,” “visceral adiposity index,” “lipid accumulation product,” and “atherogenic index of plasma” were combined using OR and AND operators, restricted to the “title/abstract” field. No limitations were placed on publication date. Study language was limited to English studies. The complete search strategy is provided in Supplemental Table 1. Two independent investigators (D.Z. and P.S.) screened studies by title and abstract in the initial stage, followed by a full-text review. Disagreements were resolved by a third reviewer (S.S.). All the screening process was conducted in EndNote version 21. The reference lists of the included studies were also reviewed to ensure that all relevant studies were incorporated.
Eligibility Criteria
Studies were included if they met the following criteria: (1) Population: Patients with diabetes mellitus (DM); (2) Intervention (Exposure): Evaluation of microvascular complications in relation to lipid profiles measured by lipid biomarkers, including the LAP, AIP and VAI; (3) Comparison/Control: Patients without microvascular complications or patients with lower ranges of biomarkers as comparison group; (4) Outcome: Comparing the lipid biomarker levels in patients with and without microvascular complications or reporting the risk of microvascular complications associated with these biomarkers.
Studies were excluded if they met any of the following criteria: (1) Absence of lipid biomarker measurements in the comparison/control group; (2) Studies including patients without DM; (3) Case reports, case series, conference abstracts, studies without full-text availability, and studies lacking control groups.
Definitions of Exposures
Included studies used the following formula to calculate lipid biomarkers:
LAP:
For men: [WC (cm)−65]×TG (mmol/L)
For women: [WC (cm)−58]×TG (mmol/L)
WC is the waist circumference, and TG is the triglyceride levels.
VAI:
For men: (WC/39.68 + BMI/1.88) × (TG/1.03) × (1.31/HDL-C)
For women: (WC/36.58 + BMI/1.89) × (TG/0.81) × (1.52/HDL-C)
WC is waist circumference, BMI is body mass index, TG is triglycerides, and HDL-C is high-density lipoprotein cholesterol.
AIP:
AIP = log10(TG/HDL-C)
Outcomes of Interest
The primary outcome of this study was to assess the association between specific lipid biomarkers (VAI, LAP, and AIP) and microvascular complications in patients with DM, specifically:
Diabetic Kidney Disease (DKD)
Diabetic Retinopathy (DR)
Diabetic Neuropathy (DN)
This outcome was measured through pooled comparisons of biomarker levels between patients with and without each complication, along with odds ratios (ORs), hazard ratios (HRs), and weighted mean difference (WMD).
The secondary outcome was the diagnostic performance of each lipid biomarker (VAI, LAP, and AIP) in detecting these complications. This was evaluated using metrics such as:
Area Under the Receiver Operating Characteristic Curve (AUC)
Sensitivity
Specificity
Cut-off values
Data Extraction
A structured data extraction sheet was developed in Excel, allowing 2 investigators, S.S. and A.M., to extract data for each study independently. The data included various study characteristics such as the first author, year of publication, study design, sample size, and country. Additionally, participant characteristics were recorded, including age, gender, BMI, systolic blood pressure (SBP), diastolic blood pressure (DBP), presence of hypertension, and current smoking history. Data related to DM encompassed the type and duration of DM. The extraction also covered lipid biomarker values like VAI, LAP, and AIP, as well as the presence and type of microvascular complications. Lastly, the diagnostic power of each marker was assessed, including metrics such as the area under the receiver operating characteristic curves (AUCs), sensitivity, specificity, and cut-offs.
Quality Assessment
The quality of the included studies was assessed using the Newcastle-Ottawa Scale (NOS), a tool designed to evaluate observational studies. 21 Each study was eligible for a maximum score of 9 points: 4 points for participant selection, 2 points for comparability, and 3 points for the assessment of outcomes and exposures. NOS scoring was independently conducted by P.S., and any discrepancies or uncertainties were resolved through consultation with H.R. to maintain consistency and objectivity in the evaluation process. Studies receiving 7 to 9 points were classified as high quality (low risk of bias), those with 4 to 6 points as moderate quality (moderate risk of bias), and those with 0 to 3 points as low quality (high risk of bias). 22
Statistical Analysis
Lipid marker values were reported as means (standard deviation, SD) or medians (interquartile range, IQR). For studies reporting continuous outcomes as medians and IQRs, the methods described by Luo et al 23 and Wan et al 24 were applied to convert these values to means and SDs, assuming an approximately normal distribution. This conversion facilitated consistent analysis across studies with varying summary statistics. Weighted mean differences (WMDs) were employed to compare the mean lipid marker values between patients with and without diabetic microvascular complications using restricted maximum likelihood (REML) estimation. AUC values from individual studies were pooled to obtain a single overall estimate of diagnostic performance, applying the restricted maximum likelihood (REML). 25 For diagnostic accuracy, AUC values were interpreted as follows: 0.50–0.59: poor, 0.60–0.69: fair, 0.70–0.79: good, and ⩾0.80: excellent discriminative ability, based on established guidelines. 26 Hazard ratios (HRs) from Cox regression models and odds ratios (ORs) from logistic regression models with corresponding 95% confidence intervals (CIs) were pooled separately to determine a combined effect size for the relationship between lipid biomarkers and microvascular complications. The degree of heterogeneity among the studies was assessed using Cochran’s Q test and the I² statistic, with an I² value greater than 50% and a P-value <.05 indicating substantial heterogeneity. A random-effects model was utilized to account for both within-study and between-study variability for analyses with more than 3 studies. We used fixed-effect model for analyses with only 2 studies. Meta-regression and sensitivity analyses were conducted to identify sources of heterogeneity, with each study excluded in turn to evaluate its impact on the overall estimate. Publication bias was assessed using Egger’s test. 27 Statistical analyses were performed using STATA version 17.0 (STATA Corp). A P-value <.05 was considered statistically significant.
Certainty of Evidence
The certainty of evidence for the analyses was assessed using the Grading of Recommendations Assessment, Development, and Evaluation (GRADE) approach. This method assesses the strength of the body of evidence across 5 domains: risk of bias, inconsistency, indirectness, imprecision, and publication bias. For each outcome, the quality of evidence was categorized as high, moderate, low, or very low. A Summary of Findings (SoF) table was constructed to present the pooled estimates, number of participants, number of studies, and the GRADE certainty rating for each analysis.
The overall certainty of evidence, as assessed by GRADE, was rated as very low across all outcomes (Supplemental Table 3, Summary of Findings; Supplemental Table 4, GRADE Evidence Profile). This was primarily due to concerns regarding risk of bias and inconsistency (high heterogeneity across studies). Although the Newcastle-Ottawa Scale (NOS) classified 21 of the 23 included studies as low risk of bias, the GRADE assessment considers additional dimensions beyond NOS, including inconsistency of results (I² values >90% in most comparisons), publication bias (noted for several outcomes), and the predominance of cross-sectional study designs, which may introduce residual confounding. Therefore, despite individual study quality ratings, the body of evidence was downgraded in GRADE for serious risk of bias and inconsistency.
Results
Search Process
The search resulted in 1351 studies across all databases. After excluding 156 duplicates (using EndNote), 1195 records were screened based on titles and abstracts. We removed 1163 studies from consideration as irrelevant to the review topic. A total of 32 full-text studies were retrieved and evaluated according to the inclusion and exclusion criteria. Following a full-text review, 23 studies fulfilled the criteria to be included. The search and screening process is summarized in Figure 1.
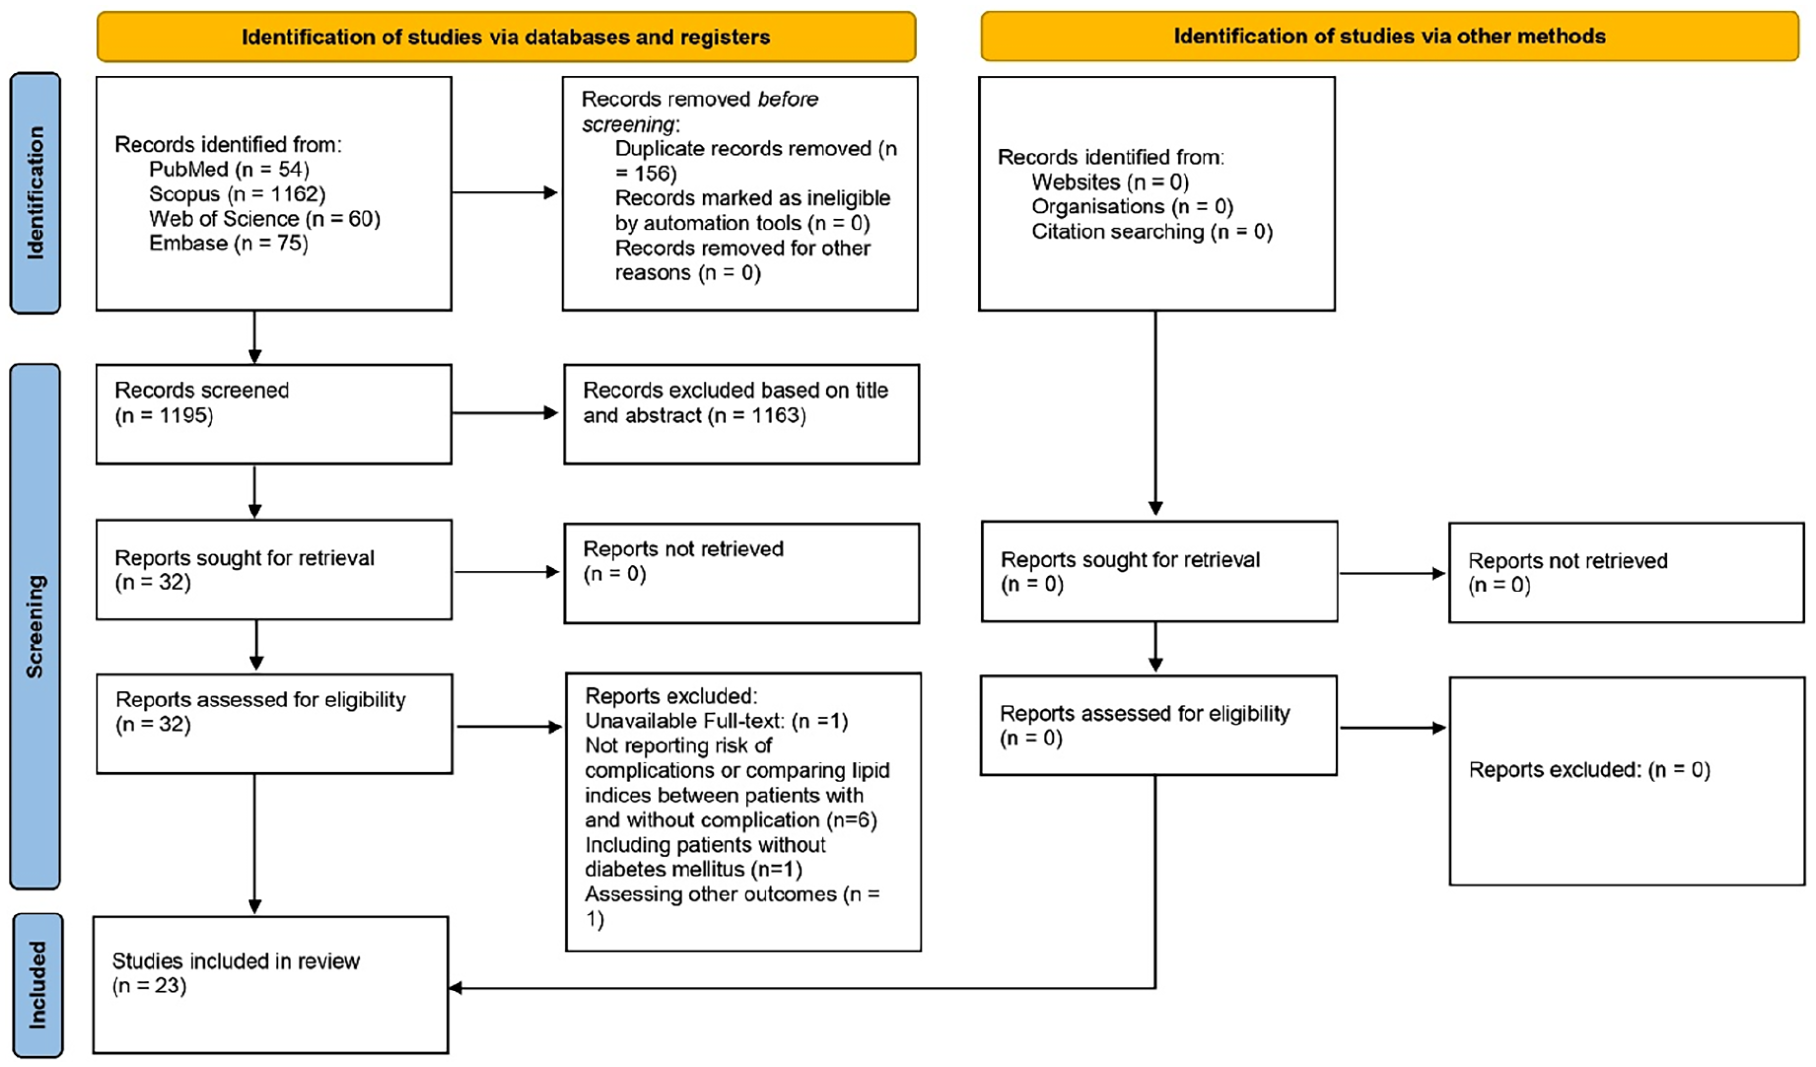
Overview of the search and screening process.
Study Characteristics
A total of 23 studies were included. These studies originated from the Middle East (n = 3),28 -30 India (n = 1), 31 and China (n = 19)32 -50 and were published between 2016 and 2025. The included studies used cross-sectional (n = 17), cohort (n = 5), and case-control (n = 1) designs. The duration of follow-up in the prospective cohorts varied, with an average range from 2 to 4.82 years.32,44,47,51 In total, 52,214 patients were included, with 27,501 male participants accounting for 52.6% of the participants. The mean age of the included population ranged from 43 to 67 years (Table 1).
Baseline Characteristics of Included Studies.

Abbreviations: AIP, atherogenic index of plasma; DKD, diabetic kidney disease; DPN, diabetic peripheral neuropathy; DR, diabetic retinopathy; LAP, lipid accumulation product; MA, macroalbuminuria; MI, microalbuminuria; NO, no albuminuria; VAI, visceral adiposity index.
Lipid biomarker values were expressed as mean ± standard deviation or median (interquartile range).
Three studies did not report values of lipid biomarkers in patients with microvascular complications compared to controls. These studies were used in the analysis of OR and HR.
Diabetic Kidney Disease (DKD) and Lipid Biomarkers
Meta-Analysis of Lipid Biomarkers in Participants with and Without DKD or Albuminuria
Sixteen studies reported lipid biomarker values in individuals with DKD and albuminuria, compared to control groups.28,30,31,33 -35,37,38,40,41,44 -47,49,51 The analysis revealed significantly higher values of LAP (WMD: 12.67, 95% CI: 7.83–17.51, P < .01, Figure 2A), AIP (WMD: 0.11, 95% CI: 0.03–0.19, P < .01, Figure 2B), and VAI (WMD: 0.63, 95% CI: 0.38–0.89, P < .01, Figure 3) in patients DKD compared to those without DKD. Due to high heterogeneity, sensitivity analyses and meta-regression were performed. The omission of each study did not significantly alter the overall effect size for LAP (Supplemental Figure 1), AIP (Supplemental Figure 2), and VAI (Supplemental Figure 3) values in individuals with DKD, in contrast with those without it. Egger’s test indicated no publication bias among studies assessing LAP (P = .196) and AIP (P = .922). However, studies assessing VAI showed a significant publication bias (P = .003). Meta-regression identified mean diastolic blood pressure and HbA1c as sources of heterogeneity among studies comparing AIP in patients with and without DKD or albuminuria (Table 2).

(A) Forest plot for analysis comparing the LAP levels in patients with DKD and albuminuria compared to those without these complications and (B) forest plot for analysis comparing the AIP levels in patients with DKD and albuminuria compared to those without these complications.

Forest plot for analysis comparing the VAI levels in patients with DKD and albuminuria compared to those without these complications.
Findings from the meta-regression on the analyses comparing lipid biomarker values.
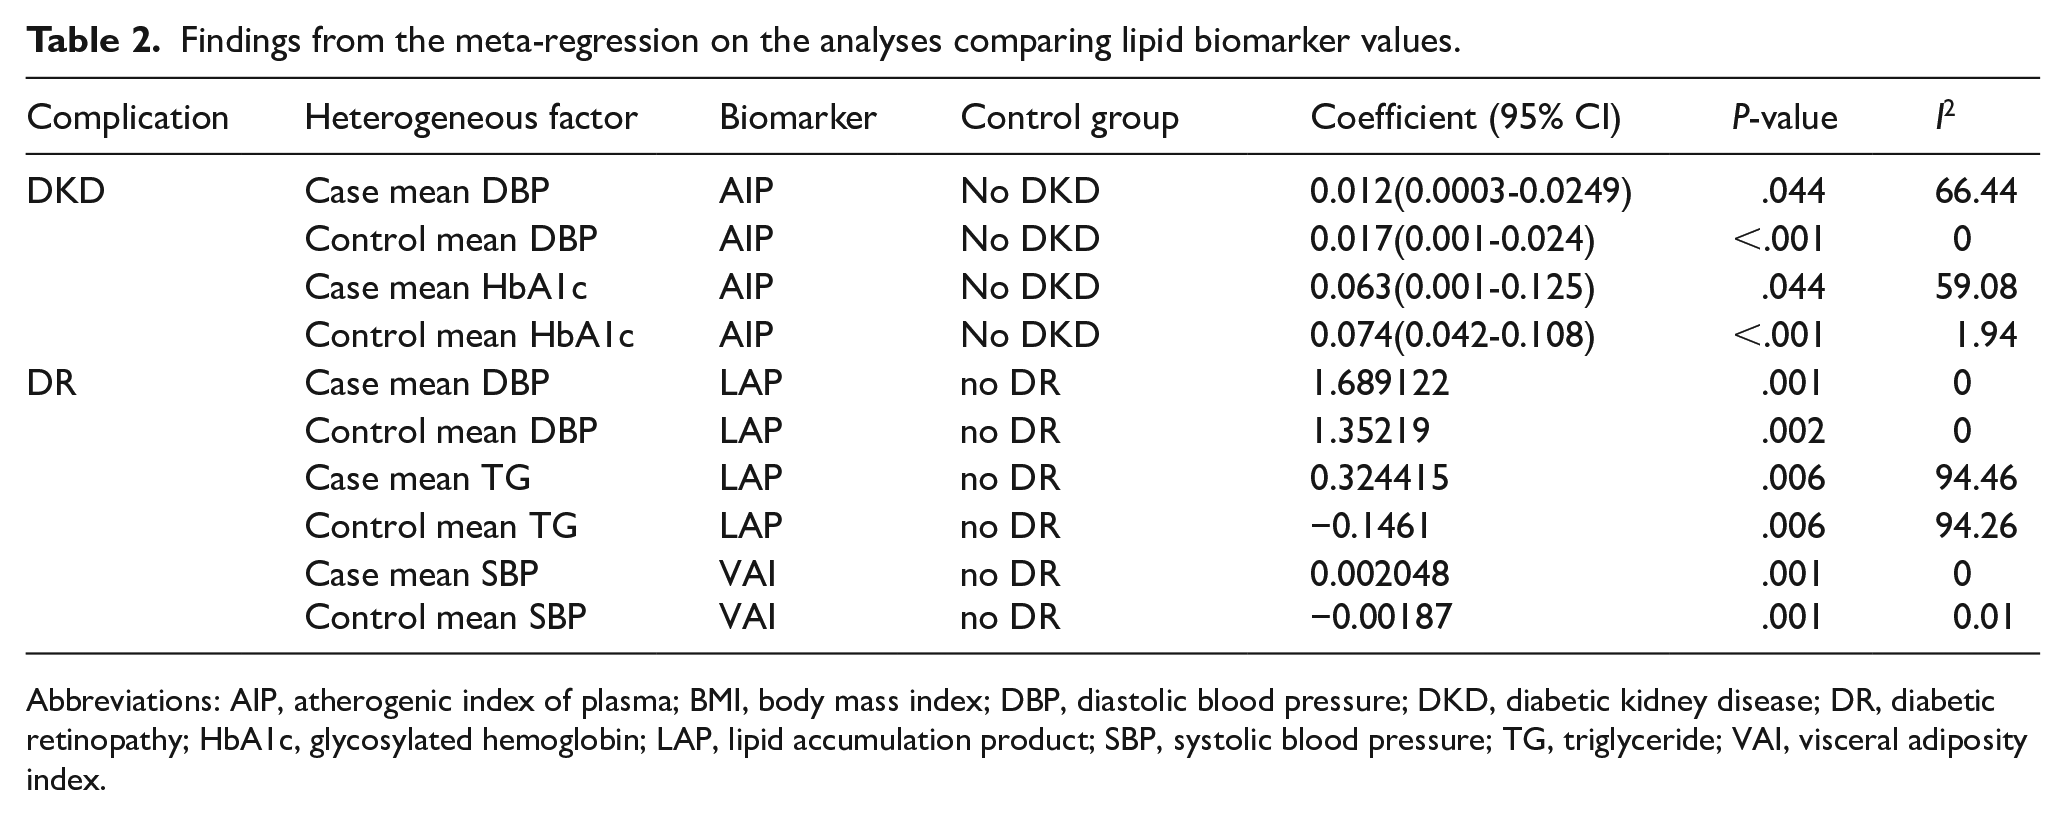
Abbreviations: AIP, atherogenic index of plasma; BMI, body mass index; DBP, diastolic blood pressure; DKD, diabetic kidney disease; DR, diabetic retinopathy; HbA1c, glycosylated hemoglobin; LAP, lipid accumulation product; SBP, systolic blood pressure; TG, triglyceride; VAI, visceral adiposity index.
Additionally, some studies provided the risk values and 95% CIs.30,34,37,38,40,42,44
-48,50,51 The analysis indicated increased risk of DKD and albuminuria per one-unit increase of LAP (OR: 1.005, 95% CI: 1.003–1.006, P < .01, Figure 4A), AIP (OR: 1.08, 95% CI: 1.04–1.12, P < .01, Figure 4B) and VAI (OR: 1.05, 95% CI: 1.03–1.07, P < .01, Figure 4C). Sensitivity analysis showed robust results for LAP, AIP, and VAI (Supplemental Figures 4–6,
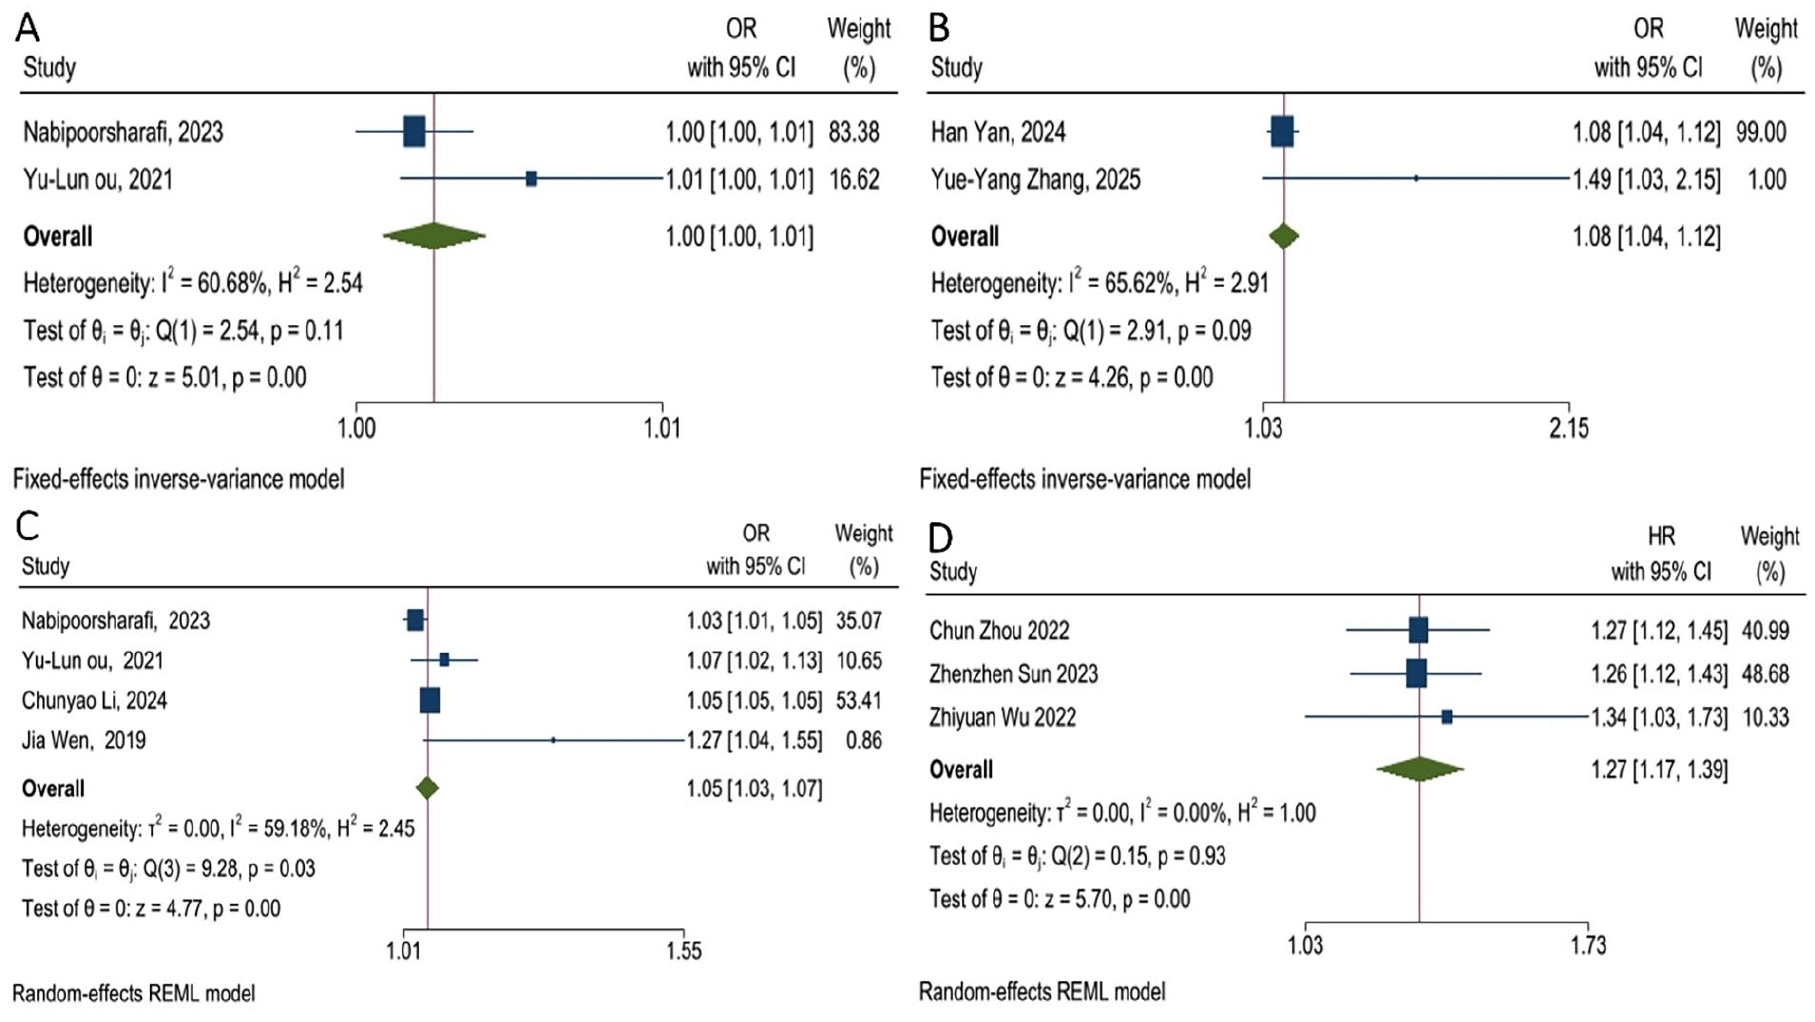
(A) Forest plot for assessing the risk of DKD and albuminuria per 1 unit increase of LAP, (B) Forest plot for assessing the risk of DKD and albuminuria per 1 unit increase of AIP, (C) Forest plot for assessing the risk of DKD and albuminuria per 1 unit increase of VAI, and (D) Forest plot for assessing the risk of DKD and albuminuria in patients with highest group of VAI compared to the reference group as the lowest group.
Diagnostic Efficacy of Lipid Biomarkers for DKD and Albuminuria
Six studies reported the AUC values and corresponding 95% CIs to assess the diagnostic power of lipid biomarkers for DKD and albuminuria.30,38,44 -46,51 The analysis demonstrated an overall AUC of 0.63 for diagnosing DKD and albuminuria (AUC: 0.63, 95% CI: 0.58–0.68; Figure 5). Subgroup analysis showed no significant difference between LAP (AUC: 0.62, 95% CI: 0.52–0.72), VAI (AUC: 0.62, 95% CI: 0.54–0.69) and AIP (AUC: 0.64, 95% CI: 0.52–0.76; P of difference = .93). Nabipoorashrafi et al reported a sensitivity of 48% and a specificity of 61% at a cut-off of 6.9 for VAI. 30 They also showed lower sensitivity (39%) and higher specificity (75%) at 93.19 for LAP in detecting albuminuria. 30 Moreover, Qi et al 38 found a sensitivity of 64.8% and a specificity of 82.8% with a cut-off of 0.415 for AIP in patients with albuminuria. In contrast, lower values (sensitivity: 58.8%, specificity: 55%) with a cut-off of 0.126 were found in another study for AIP in patients with DKD. 45
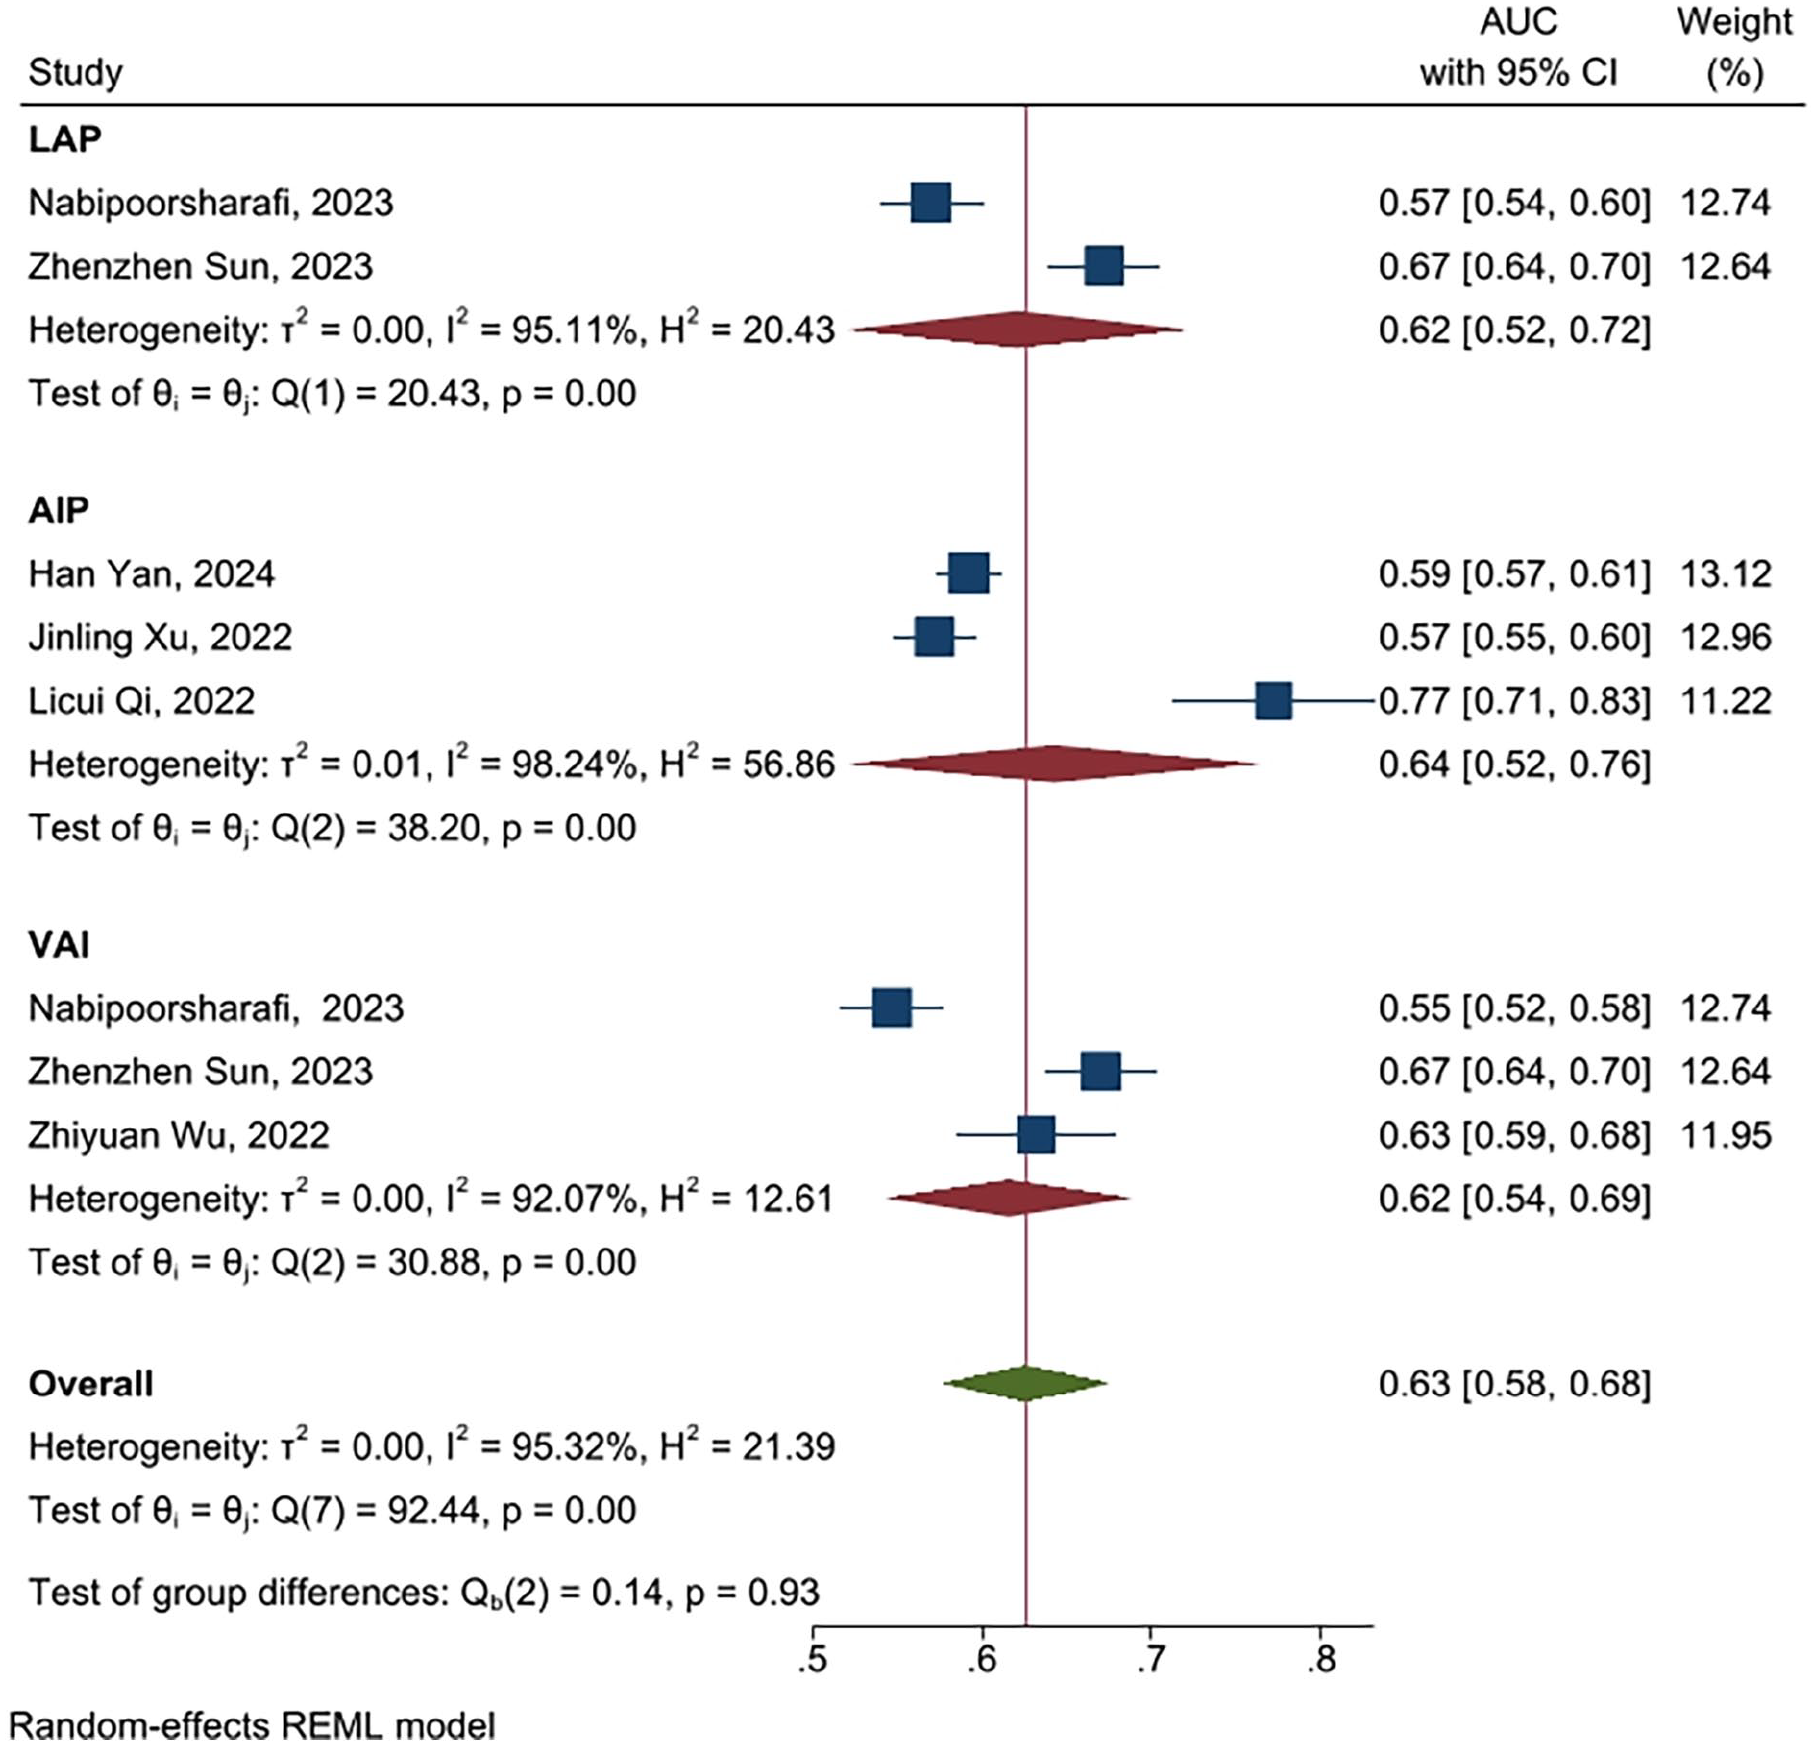
Forest plot for pooling AUCs for diagnosis of DKD and albuminuria.
Diabetic Retinopathy (DR) and Lipid Biomarkers
Meta-Analysis of Lipid Biomarkers in Patients with and Without DR
Seven studies were identified that compared lipid biomarker values in patients with and without DR.32,36,41,43 -45,47 Analysis demonstrated no substantial differences in LAP (WMD: 5.18, 95% CI: −12.40 to 22.76, P = .56; Figure 6A), AIP (WMD: 0.02, 95% CI: −0.02 to 0.05, P = .33; Supplemental Figure 6B), and VAI (WMD: −0.01, 95% CI: −0.22 to 0.20, P = .91; Figure 7) between patients with and without DR. Given the significant heterogeneity across studies, sensitivity analyses and meta-regression were performed. Sensitivity analysis suggested that the findings of each study comparing LAP (Supplemental Figure 8) and VAI (Supplemental Figure 9) in patients with and without DR were robust. However, sensitivity analysis for AIP showed a non-robust finding (Supplemental Figure 10). Additionally, Egger’s test indicated no publication bias among studies comparing LAP (P = .246), AIP (P = .492), and VAI (P = .343). Meta-regression identified mean SBP, DBP, and triglyceride in patients with and without DR as potential sources of heterogeneity (Table 2).
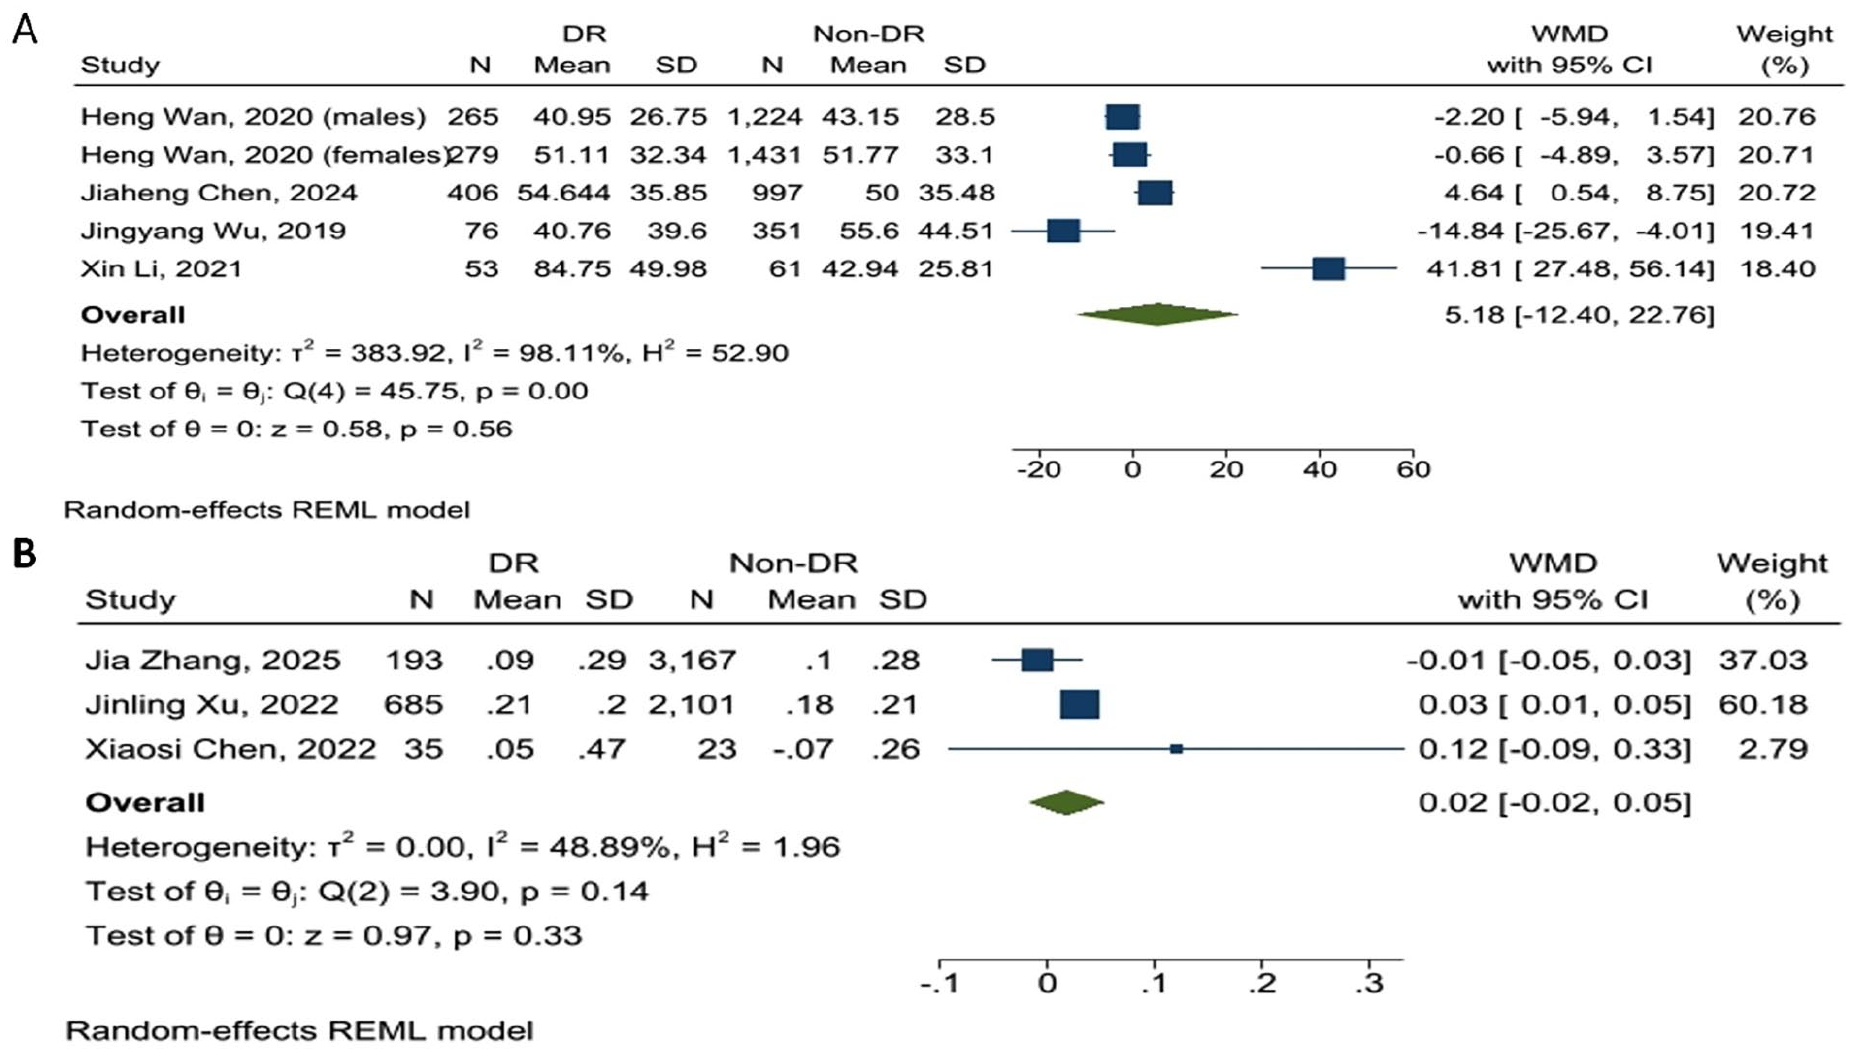
(A) Forest plot for analysis comparing the LAP levels in patients with DR and albuminuria compared to those without these complications and (B) forest plot for analysis comparing the AIP levels in patients with DR and albuminuria compared to those without these complications.

A forest plot for analysis comparing the VAI levels in patients with DR and albuminuria compared to those without these complications.
Diagnostic Efficacy of Lipid Biomarkers for DR
Three studies evaluated the diagnostic efficacy of lipid biomarkers in detecting DR.36,44,45 A meta-analysis of AUC values indicated an AUC of 0.60 for diagnosing DR (AUC: 0.60, 95% CI: 0.47–0.72; Figure 8). LAP demonstrated the highest diagnostic power (AUC: 0.73, 95% CI: 0.65–0.80), with a sensitivity of 84.3% and a specificity of 49.2% at a cut-off value of 37.56. 36 This was followed by the AIP (AUC: 0.54, 95% CI: 0.52–0.57) and VAI (AUC: 0.53, 95% CI: 0.45–0.60). The analysis showed a significant difference between the discriminatory power of the markers (P < .01).

Forest plot for pooling AUCs for diagnosis of DR.
Diabetic Neuropathy (DN) and Lipid Biomarkers
Only 2 studies met the inclusion criteria for assessing lipid biomarkers in patients with and without DN.29,48 Miric et al reported significantly higher AIP values in patients with diabetic peripheral neuropathy (DPN) compared to those without DPN (0.366 ± 0.238 vs 0.270 ± 0.229; P < .05). 29 However, Zhang et al found no significant association between AIP and risk of DN (OR: 0.78, 95% CI: 0.59–1.04, P = .18).
Quality Assessment
21 studies were considered as low risk of bias or high-quality, and 2 studies were categorized as moderate risk of bias. Supplemental Table 2 shows the quality assessment of the included studies. The GRADE Summary of Findings and GRADE Evidence Profile tables (Supplemental Tables 3 and 4) present a detailed overview of the certainty of evidence across all outcomes.
Discussion
Recently, researchers have increasingly investigated the relationship between novel lipid biomarkers and complications associated with DM, specifically DR and DKD. This study compiled available data to assess the lipid biomarkers in individuals with and without microvascular complications. The analysis demonstrated significantly higher levels of lipid biomarkers, including VAI, LAP, and AIP, in patients with DKD and albuminuria than in patients without these complications. Conversely, no notable differences were detected between patients with and without DR. Additionally, the study assessed the discriminatory power of these biomarkers, revealing that these markers exhibited a poor ability to differentiate patients with DR and DKD.
The AIP, representing the log TG/HDL-C ratio, serves as an independent marker that can improve cardiovascular risk assessment compared to traditional lipid markers. 52 The AIP reflects the balance between elevated TG and reduced HDL-C, both of which are common in dyslipidemia. Additionally, it might act as a useful screening method in the early stages of the detection of diseases associated with dyslipidemia.
The LAP was first introduced as a cost-effective indicator of visceral fat, utilizing measurements of WC and HDL-C to assess the risk of metabolic disorders, particularly those related to obesity. An elevated LAP indicates a higher accumulation of WC and lower HDL-C levels, which are linked to IR, oxidative stress, and inflammation in DM. 53 Evidence suggests that LAP acts as a better indicator of metabolic syndrome (MetS) compared to traditional lipid markers, such as BMI, WC, and the waist-to-hip ratio (WHR). 54 These findings support the utility of LAP as a unique and valuable marker for assessing and detecting MetS-related conditions, including the microvascular complications associated with DM.
Among the lipid biomarkers mentioned, the VAI is the most recently developed. It integrates components from both the LAP and the AIP, including WC, HDL-C, and TG. Elevated VAI levels reflect increased WC and TG, along with decreased HDL-C. By incorporating multiple lipid indicators, VAI provides a more accurate tool for assessing cardiometabolic risk and phenotypes. 55
Diabetic Kidney Disease and Lipid Biomarkers
Investigations have revealed that individuals suffering from DKD exhibit notable alterations of lipid profiles, characterized by increased TG and low-density lipoprotein cholesterol (LDL-C), alongside reduced HDL-C levels. 56 Elevated TG levels are mediated through the activation of hormone-sensitive lipase, which releases free fatty acids (FFA) from adipose tissue, and is subsequently converted into TG in the liver. 57 Additionally, DKD is associated with increased levels of apolipoprotein B100 (APO-B100) produced in the liver and incorporated into LDL-C particles. 58 Consequently, elevated APO-B100 contributes to the formation and increased numbers of LDL-C particles. 59 The mechanisms underlying reduced HDL-C levels in patients with DKD remain unclear. However, the production of apolipoprotein A1 (APO-A1), a primary component of HDL-C, is insulin-dependent. 60 IR may therefore decrease HDL-C levels by impairing APO-A1 activation. TG binds to specific receptors on mesangial cells and podocytes, triggering the release of pro-inflammatory cytokines and reactive oxygen species (ROS), which promote the synthesis of extracellular matrix (ECM). 61 This process contributes to glomerulosclerosis and tubulointerstitial fibrosis. 59 Moreover, the accumulation of ECM enhances foam cell formation via the uptake of oxidized LDL-C, further exacerbating the inflammatory state. 59 These mechanisms illustrate how lipid profile alterations contribute to the development of DKD.
Increased DKD risk in relation to higher AIP levels is supported by observations of higher TG and lower HDL-C in individuals with DKD, which was explained previously. A linear J-shaped association exists between the risk of DKD and AIP levels,46,47 with higher baseline AIP levels significantly increasing the probability of DKD.35,46,47 Included studies also indicated that patients with the highest AIP levels exhibit a meaningful higher DKD risk as opposed to the lowest group.46,48 In addition to significantly higher levels of AIP in patients with DKD and albuminuria, existing findings also support this meaningful association and probable predictive role of AIP in relation to DKD.
Similarly, an elevated VAI is linked to a higher risk of DKD and albuminuria, driven by elevated TG and WC, combined with reduced HDL-C in individuals with DM. Apart from the markedly higher VAI values detected in individuals with DKD and albuminuria, pooled ORs calculated from logistic regression analyses confirmed that VAI is independently associated with DKD risk even when controlling for potential cofounders. Furthermore, patients in the highest VAI group had an elevated DKD risk against individuals with lower VAI values.34,51 These findings underscore the importance of VAI in assessing both the diagnosis and prognosis of individuals with DKD.
Despite significantly higher LAP values in individuals with DKD and albuminuria, the analysis demonstrated only a very weak increase in the risk of albuminuria per one-unit rise in LAP. A similar observation was made regarding the prevalence of DKD concerning LAP, even following the correction for cofounders.41,51 Conversely, a retrospective study reported a notable positive correlation between LAP levels and DKD risk, where the highest quartile of LAP showed the greatest OR for DKD risk. 40 Comparable findings were also reported by Sun et al. 51 However, several limitations in studies examining the association between LAP levels and DKD must be considered. First, all these studies were cross-sectional, which complicates the establishment of causal relationships. Second, some studies acknowledged not adjusting their findings for certain confounding variables due to insufficient data. These limitations highlight the necessity of prospective studies involving larger cohorts and detailed patient information to accurately evaluate the association between LAP values and DKD.
The correlation between lipid biomarker values and DKD severity has not been extensively studied. Patients with macroalbuminuria exhibited significantly higher levels of AIP, VAI, and LAP compared to those with microalbuminuria, indicating that these biomarkers may serve as indicators of DKD severity.45,49 Furthermore, patients with an estimated glomerular filtration rate (eGFR) of less than 30 mL/min had elevated VAI and LAP values compared to other patient groups.37,49 Notably, the prognostic risk of DKD was positively correlated with VAI and LAP values. 49 Future research should explore the specific cut-off values of these markers to aid in staging the severity of DKD and albuminuria.
The analysis demonstrated that lipid biomarkers had poor discriminatory power for DKD and albuminuria. The analysis also showed no significant difference between the discriminatory power of these biomarkers (P = .91). Additionally, LAP and the VAI showed higher AUCs compared to traditional indicators, such as BMI and WC. 51 Similar results were observed for the AIP when compared to the WHR, TG, and HDL-C.38,41 However, conflicting evidence exists regarding other novel markers, such as the triglyceride-glucose (TyG) index. While two studies reported slightly higher AUCs for the TyG index compared to AIP, LAP, and VAI,30,46 a pooled analysis of the included studies revealed similar or even higher AUC values for LAP and VAI than TyG index and homeostasis model assessment of insulin resistance (HOMA-IR). 62 Consequently, although a significant association was observed between DKD and albuminuria with these lipid biomarkers, their discriminatory power was categorized as poor, indicating that they may not perform as effectively as other metabolic markers
Diabetic Retinopathy and Lipid Biomarkers
There are inconsistent findings regarding the association between AIP levels and DR. According to Xu et al, 46 individuals exhibiting elevated AIP levels showed a notably higher risk of DR, while other studies found no substantial association.33,47,63 The analysis of the included studies did not reveal significant differences in AIP values between the DR and non-DR individuals. This may be explained by the complex interactions between plasma lipids and microvascular complications. Lipid alterations in DM are tissue-specific, and the levels of various lipids do not consistently change in the same manner across different tissues, such as the kidney, nervous system, and retina. 64 Additionally, diabetic mice exhibit a reduction in overall lipid content in renal and retinal tissues.64,65 This evidence points to the requirement for the continuation of biological studies to clarify the intricate relationships between lipid profile components and the development of microvascular complications.
The included studies demonstrated inconsistent findings regarding the association of obesity-related markers, such as the LAP and VAI, with DR. While some studies reported no significant association,41,44 others identified both positive and negative associations between the DR risk and the levels of these indices.32,36,43 The analysis showed no meaningful differences in LAP and VAI values in the DR and non-DR patient groups. These findings may be influenced by disease duration. Adults with a longer duration of DM often exhibit a meaningful reduction in fat mass (FM), which is linked to decreased levels of these markers. Furthermore, longer disease duration statistically contributed to increased risk of DR.39,66 Consequently, it is plausible to observe an inverse association between the risk of DR and these markers’ values in individuals with long-term DM. Conversely, patients in the early stages of DM are typically under stringent control of hemoglobin A1c (HbA1c) and fasting blood sugar (FBS), which can be associated with a lower risk of DR despite elevated marker levels. 44 Additionally, these markers have demonstrated a stronger association with DKD and overall renal function, which may reduce their observed correlation with DR. 67 Therefore, a significant relationship may become apparent when analyses adjust for disease duration.
The LAP demonstrated significantly higher diagnostic power for DR compared to other markers (P < .01). However, the overall diagnostic performance of these markers was classified as poor. Furthermore, these markers did not exhibit a substantial correlation with DR. Therefore, their prognostic and diagnostic value for DR should be interpreted with caution.
Strengths and Limitations
This study has several notable strengths. It is the first systematic review and meta-analysis to comprehensively evaluate the associations between novel lipid biomarkers, including VAI, LAP, and AIP, and microvascular complications in DM, providing an integrated overview of their diagnostic utility. The inclusion of a large and diverse sample across multiple studies enhances the generalizability of the findings. Furthermore, the systematic evaluation of both diagnostic performance and disease association offers valuable insights into the potential of these biomarkers for early detection and risk stratification, particularly in DKD. By addressing gaps in the existing literature and highlighting the predictive capabilities of these biomarkers, this study establishes a foundation for future research aimed at refining diagnostic strategies and improving clinical management in DM.
Despite the valuable findings, it is essential to consider the limitations. Firstly, there is a notable lack of data regarding diabetic nephropathy (DN), as only 2 studies met the criteria for assessing the relationship between lipid biomarkers and this microvascular complication. This gap highlights the need for further research focusing on this area. Second, the analyses exhibited high heterogeneity, driven by variations in study populations, biomarker measurement techniques, and confounding factors such as diabetes duration and metabolic control. This heterogeneity may have affected the precision and reliability of the pooled estimates. Third, the majority of the included studies employed a cross-sectional design, restricting the ability to infer causal relationships between lipid biomarkers and the development or progression of diabetic complications. Fourth, the included indices were measured in different laboratories, and varying cut-offs were reported for assessing microvascular complications. These inconsistencies may have led to discrepancies in the included findings and prevented the determination of specific cut-offs for each biomarker. Finally, there is a geographic bias in the study sample, with most studies originating from China and other parts of Asia. This regional concentration may affect the ability to apply the results to populations in other parts of the world, where genetic, environmental, and lifestyle factors may differ significantly.
Conclusion
This study demonstrates that novel lipid biomarkers are significantly associated with DKD and albuminuria in patients with DM. Despite their strong statistical association with renal complications, these markers exhibited limited diagnostic accuracy, as reflected by poor area-AUC values. This suggests that while they may serve as adjunct indicators of DKD risk, their standalone utility for clinical prediction remains constrained. In contrast, no significant association was observed between these biomarkers and DR, and their diagnostic performance for DR was similarly suboptimal. The lack of correlation underscores the tissue-specific nature of lipid-mediated pathology in diabetes, where systemic lipid alterations may disproportionately affect renal microvasculature compared to retinal tissues.
These findings highlight the potential role of VAI, LAP, and AIP in risk stratification for DKD, though their poor discriminative power necessitates further refinement to improve clinical applicability. Future research should prioritize longitudinal studies to validate causality and investigate whether integrating these markers with other metabolic indices enhances predictive value for microvascular complications.
Supplemental Material
sj-docx-1-end-10.1177_11795514251365301 – Supplemental material for Novel Lipid Biomarkers and Microvascular Complications in Patients with Diabetes Mellitus: A Systematic Review and Meta-analysis
Supplemental material, sj-docx-1-end-10.1177_11795514251365301 for Novel Lipid Biomarkers and Microvascular Complications in Patients with Diabetes Mellitus: A Systematic Review and Meta-analysis by Diar Zooravar, Shayan Shojaei, Asma Mousavi, Pedram Soltani, Bahareh Shateri Amiri and Hanieh Radkhah in Clinical Medicine Insights: Endocrinology and Diabetes
Supplemental Material
sj-docx-2-end-10.1177_11795514251365301 – Supplemental material for Novel Lipid Biomarkers and Microvascular Complications in Patients with Diabetes Mellitus: A Systematic Review and Meta-analysis
Supplemental material, sj-docx-2-end-10.1177_11795514251365301 for Novel Lipid Biomarkers and Microvascular Complications in Patients with Diabetes Mellitus: A Systematic Review and Meta-analysis by Diar Zooravar, Shayan Shojaei, Asma Mousavi, Pedram Soltani, Bahareh Shateri Amiri and Hanieh Radkhah in Clinical Medicine Insights: Endocrinology and Diabetes
Supplemental Material
sj-docx-3-end-10.1177_11795514251365301 – Supplemental material for Novel Lipid Biomarkers and Microvascular Complications in Patients with Diabetes Mellitus: A Systematic Review and Meta-analysis
Supplemental material, sj-docx-3-end-10.1177_11795514251365301 for Novel Lipid Biomarkers and Microvascular Complications in Patients with Diabetes Mellitus: A Systematic Review and Meta-analysis by Diar Zooravar, Shayan Shojaei, Asma Mousavi, Pedram Soltani, Bahareh Shateri Amiri and Hanieh Radkhah in Clinical Medicine Insights: Endocrinology and Diabetes
Supplemental Material
sj-docx-4-end-10.1177_11795514251365301 – Supplemental material for Novel Lipid Biomarkers and Microvascular Complications in Patients with Diabetes Mellitus: A Systematic Review and Meta-analysis
Supplemental material, sj-docx-4-end-10.1177_11795514251365301 for Novel Lipid Biomarkers and Microvascular Complications in Patients with Diabetes Mellitus: A Systematic Review and Meta-analysis by Diar Zooravar, Shayan Shojaei, Asma Mousavi, Pedram Soltani, Bahareh Shateri Amiri and Hanieh Radkhah in Clinical Medicine Insights: Endocrinology and Diabetes
Footnotes
Acknowledgements
None.
Ethical Considerations
Not applicable. This study is a systematic review and meta-analysis of previously published data and did not involve direct interaction with human subjects. Therefore, ethical approval and participant consent were not required.
Consent for Publication
Not applicable. No individual data or identifiable images are included in this article.
Author Contributions
Diar Zooravar: Conceptualization; Formal analysis; Investigation; Visualization; Writing - original draft. Shayan Shojaei: Conceptualization; Investigation; Methodology; Supervision; Writing - original draft. Asma Mousavi: Methodology; Project administration; Writing - original draft. Pedram Soltani: Writing - original draft. Bahareh Shateri Amiri: Writing - review & editing. Hanieh Radkhah: Methodology; Project administration; Supervision; Validation; Writing - review & editing.
Funding
The author(s) received no financial support for the research, authorship, and/or publication of this article.
Declaration of Conflicting Interests
The author(s) declared no potential conflicts of interest with respect to the research, authorship, and/or publication of this article.
Data Availability Statement
All data generated or analyzed during this study are included in this published article and its supplementary information files. Additional information is available from the corresponding author upon reasonable request.
Supplemental Material
Supplemental material for this article is available online.
References
Supplementary Material
Please find the following supplemental material available below.
For Open Access articles published under a Creative Commons License, all supplemental material carries the same license as the article it is associated with.
For non-Open Access articles published, all supplemental material carries a non-exclusive license, and permission requests for re-use of supplemental material or any part of supplemental material shall be sent directly to the copyright owner as specified in the copyright notice associated with the article.