
Abstract
Background:
Diabetic kidney disease (DKD) is the main cause of end-stage renal disease and has a high mortality rate. Currently, no effective treatments are available to reduce the progression of kidney damage associated with diabetes.
Objectives:
To explore the influence and predictive value of the atherogenic index of plasma (AIP) on early chronic kidney disease and liver injury in patients with type 2 diabetes mellitus (T2DM).
Methods:
Medical records of 1057 hospitalized adult patients with T2DM between January 2021 and December 2022 were collected. The predictive value of AIP, renal function, and liver injury in patients with T2DM were analyzed using Pearson’s correlation, multiple logistic regression, and receiver operating characteristic (ROC) curve analyses.
Results:
AIP was a sensitive indicator of early liver and kidney injury in patients with T2DM. Patients in the DKD group showed increased AIP that positively correlated with serum creatinine, uric acid, and β2-microglobulin levels. Increased AIP negatively correlated with estimated glomerular filtration rate (eGFR). AIP significantly correlated with alanine aminotransferase and aspartate aminotransferase levels and glutamyl transpeptidase-to-platelet ratio (GPR). An eGFR of 60-100 mL/min/1.73 m2 significantly increased the risk of DKD as the AIP increased. At lower GPR levels, the risk of DKD significantly increased with increasing AIP. However, no significant difference was found between the 2 groups when the GPR was >0.1407. The ROC curve analysis showed that AIP could predict early liver injury.
Conclusions:
AIP is directly involved in early liver and kidney injury in T2DM and may be a sensitive indicator for early detection.
Plain Language Summary
Diabetes and its complications are a global public health concern. Diabetic kidney disease (DKD) is the main cause of end-stage renal disease, and metabolism-related disease factors are found throughout the progression of DKD. This study identified common sensitive indicators of early metabolism-related damage to liver and kidney function in patients with T2DM.
Keywords
Introduction
Type 2 diabetes mellitus (T2DM) is the most common metabolic disease, causing acute and chronic complications in multiple body organs, 1 and the number of patients with diabetes is estimated to increase to 642 million by 2040. 2 Diabetes kidney disease (DKD) is the main cause of end-stage kidney disease worldwide 3 and has a high mortality rate. From 1990 to 2012, the number of deaths caused by DKD increased by 94%. 4 Currently, no effective treatment exists to reduce the progression of kidney damage associated with diabetes.
Metabolism-related pathogenic factors can independently predict DKD progression in patients with T2DM and are predictive of kidney function decline and albuminuria deterioration. 5 The liver is the primary organ involved in metabolism, and 70%-80% of patients with T2DM typically suffer from metabolic-associated fatty liver disease (MAFLD). 6 Even after adjusting for common risk factors of chronic kidney disease (CKD), MAFLD remains an independent risk factor for the progression of DKD. 7 Common risk factors for DKD and MAFLD include overweight, obesity, poor blood sugar control, and insulin resistance. Increased oxidative stress, abnormal lipid metabolism, and abnormal adipokines are the common pathological mechanisms leading to MAFLD and DKD. 8 Research indicates a significant correlation between MAFLD and elevated microalbuminuria in T2DM. 9 Furthermore, MAFLD is correlated with large vessel and microvascular lesions in T2DM 10 and is significantly associated with an increased risk of ⩾stage1 CKD, with a median follow-up of 3 years. 11 Several hypoglycemic drugs such as metformin hydrochloride, sodium glucose cotransporter-2 (SGLT2) inhibitors, and glucagon-like peptide-1 (GLP-1) receptor agonists are used to treat MAFLD and demonstrate significant renal protective effects. 12 However, sensitive indicators for early identification of high-risk DKD and metabolic liver disease are lacking in T2DM clinical practice. Identifying a marker that can accurately reflect metabolism-associated liver and kidney function injury at an early stage could be used as an intervention target and may help prevent the progression of DKD.
The atherogenic index of plasma (AIP) (log10 [triglycerides/high-density lipoprotein-cholesterol]), was first proposed by Dobiásová as a biomarker for plasma arteriosclerosis to predict the development of cardiovascular events and related mortality rates. 13 A higher AIP is significantly related to the increase in prevalence of prediabetes and diabetes. 14 Fatty liver disease is characterized by metabolic disorder of triglyceride (TG), which accumulate in the hepatocytes and liver tissue while diabetes-related dyslipidemia primarily manifests as hypertriglyceridemia and a low level of high-density lipoprotein cholesterol (HDL-C). 15
The ratio of glutamyl transpeptidase to platelets (GPR), proposed in 2016, is significantly correlated with liver stiffness measurements in the evaluation of liver fibrosis. Therefore, GPR can be used as a noninvasive indicator for evaluating liver injury in patients with nonalcoholic fatty liver disease. 16 Zhao et al. 17 showed that GPR can act as an inflammatory marker and an independent predictor of adverse outcomes in patients with coronary heart disease after percutaneous coronary intervention. 18 This may be because platelets, which are atypical first-line inflammatory biomarkers that attach to white blood cells and endothelial cells, can alter the activity of these cellular inflammatory components. Herein, the GPR was used as a predictive indicator of early liver injury.
Evaluation of glomerular filtration rate (eGFR) is crucial for the diagnosis and monitoring of CKD. A decrease in the eGFR remains a criterion for determining acute kidney injury (AKI) or CKD. Li et al. 19 showed that CKD events were associated with MAFLD and T2DM (odds ratio [OR], 1.33; 95% confidence interval [CI]: 1.20-1.48). In the Chinese population, higher AIP levels show a strong positive correlation with fatty liver disease. 20 However, studies are lacking on the relationship between AIP and CKD associated with T2DM. Our study aimed to explore whether AIP can serve as a sensitive indicator of early metabolism-related liver and kidney function in T2DM.
Methods
Study population
This retrospective study included patients with T2DM admitted to the Endocrinology Department of Hebei Yi Ling Hospital, affiliated with Hebei Medical University, between January 2021 and December 2022.
Inclusion criteria were: (1) Diagnosis of T2DM according to the American Diabetes Diagnostic Criteria International Diagnostic Standards or confirmed based on treatment for T2DM and hypoglycemia for over 6 months; and (2) age between 40 and 85 years. Exclusion criteria were: (1) Patients without T2DM; (2) patients with T2DM and concomitant lactic acid acidosis, ketoacidosis, severe infection, or critical illness (such as organ failure, acute myocardial infarction, or cerebral infarction), abnormal liver function, or autoimmune diseases; (3) incomplete laboratory inspection data; and (4) urinary protein creatinine ratio >1000 mg or estimated GFR (eGFR) <30 mL/min/1.73 m2. This study was approved by the Ethics Committee of Hebei Yi Ling Hospital, which is affiliated with Hebei Medical University. All participants provided informed consent.
Study variables and measurements
Clinical and biochemical indicators were retrieved from patient admission records and results of the first laboratory test after hospitalization. Blood and urine samples were collected in the morning after the participants had fasted for at least 8 hours. Fasting blood glucose (FBG), TG, total cholesterol, HDL-C, low density lipoprotein-cholesterol (LDL-C), uric acid (UA), and serum creatinine (Crea) testing was performed using a fully automated biochemical analyzer (AU5800; Beckman Coulter). An automatic coagulation analyzer (CS-5100; Sysmex Europe GmbH) was used to measure the coagulation indicators fibrinogen (Fib), D-dimer (D-D), and fibrin degradation products (FDP).
Formulae and definitions
AIP = log10 [TG (mmol/L)/high-density lipoprotein cholesterol (mmol/L)]; GPR = r−glutamyl transpeptidase (GTT) (U/L)/platelet count (PLT) (×109/L); systemic immune inflammation index (SII) = platelet count (PLT) × neutrophil count (NE)/lymphocyte count (Lym) (×109/L); the eGFR was calculated based on the Crea and gender (CKD-EPI); triglyceride glucose (TyG) = ln [TG (mg/dL) × FBG (mg/dL)]; prognostic nutritional index (PNI) = serum albumin (g/L) + 5 × Lym (×109/L); DKD was defined as a urine protein creatinine ratio of ⩾30 mg/g from at least 2 morning urine samples with an interval >24 hours.
Statistical analysis
SPSS software (version 23.0; IBM Corp., Armonk, NY, USA) was used to analyze the data. Data are expressed as mean ± standard deviation (SD) or median and interquartile range (IQR) for continuous variables and percentages for categorical variables. The t-test was used to compare the 2 groups (DKD and non-DKD). Pearson’s correlation analysis was used to calculate the correlation between AIP and other variables. The receiver operating characteristic (ROC) curve was used to evaluate the identification performance of the AIP based on the area under the ROC curve (AUC). Binary logistic regression multivariate analysis was used to evaluate risk factors for DKD. GraphPad Prism 8 was used to draw forest plots to demonstrate the relationships between AIP and DKD or GPR. All statistical tests with P < .05 were considered significant.
Results
Demographic and clinical characteristics
The study included 1057 patients with T2DM who were divided into 464 patients with DKD and 593 patients without DKD. The average patient age was 63.42 ± 10.65 years. The average age of patients with DKD or non-DKD was 64.55 ± 11.23 and 62.53 ± 10.09 years, respectively. A significant difference was observed between the 2 groups (P < .05). Patients in the DKD group exhibited more severe liver and kidney injuries and metabolic disorders than those in the non-DKD group, resulting in a poorer prognosis. Manifestations included elevated levels of GGT, GPR, Fib, D-D, FBG, TG, SII, TyG, and AIP (P < .01). The levels of HDL-C, eGFR, albumin, and prognostic nutritional index (PNI) were significantly decreased (P < .05) in the DKD group compared with those in the non-DKD group. Conversely, the levels of globulin (GLB), Lym, PLT, alanine transaminase (ALT), and LDL-C did not significantly differ between the 2 groups (P > .05) (Table 1).
Demographic and clinical profiles of T2DM patients and DKD (n = 1057).

Abbreviations: AIP, atherogenic index of plasma; ALB, albumin; ALT, alanineamino transferase; Crea, serum creatinine; FBG, fasting blood glucose; Fib, fibrinogen; GGT, γ-glutamyl-transpeptidase; GLB, globulin; GPR, glutamate transpeptidase platelet ratio; HDL-C, high density lipoprotein cholesterol; LDL-C, low-density lipoprotein cholesterol; Lym, lymphocyte; NE, neutrophils; PLT, platelet; PNI, prognostic nutritional index; SD, standard deviation; SII, systemic immune inflammation; TG, triglyceride; TyG, triglyceride glucose; UA, uric acid; β2-MG, β2-microglobulin.
Comparisons were made using independent sample t-test, Chi-square test as appropriate. Categorical variables are presented in frequency and percentage while continuous variables are presented as mean ± SD.
P-value < .05 was defined as statistically significant and presented in bold.
Correlation between AIP and other parameters in patients with T2DM
Pearson’s correlation analysis was used to clarify the relationship between the AIP and liver and kidney function parameters in patients with T2DM. AIP was associated with insulin resistance TyG (r = 0.814, P < .001), renal function Crea (r = 0.122, P < .001), and UA (r = 0.302, P < .001), β2-microglobulin (β2-MG) also correlated positively with AIP (r = 0.077, P = .012) but correlated negatively with eGFR (r = −0.078, P = .011). In addition, AIP correlated positively with ALT (r = 0.114, P < .001), GCT (r = 0.153, P < .001), NE (r = 0.071, P = .022), and GPR (r = 0.133, P < .001). SII, PNI, Fib, albumin, and PLT did not correlate with the AIP (Table 2).
Correlation of AIP with other parameters in the T2DM patients.

Abbreviations: AIP, atherogenic index of plasma; ALB, albumin; ALT, alanineamino transferase; Crea, serum creatinine; eGFR, estimated glomerular filtration rate; Fib, fibrinogen; GGT, glutamyl-transpeptidase; GPR, γ-glutamate transpeptidase platelet ratio; NE, neutrophils; PLT, platelet; PNI, prognostic nutritional index; SII, systemic immune inflammation; TyG, triglyceride glucose; UA, uric acid; β2-MG, β2-microglobulin.
P-value < .05(two-sided) was defined as statistically significant and presented in bold.
AIP as an independent risk factor for DKD progression
Univariate regression analysis showed that β2-MG, Age, Fib, D-D, FDP, NE, GCT, FBG, and AIP were all risk factors for DKD (P < .001). AIP had the highest OR of 2.202 and a 95% CI:1.412-3.434 (P < .001). After multivariate regression analysis, adjusted for β2-MG, age, Fib, D-D, FDP, NE, GCT, and FBG, AIP remained an independent risk factor for DKD progression, and the OR remained significantly greater than that for the other indicators (OR: 1.930, 95% CI: 1.247-2.987; P < .001). For each unit increase in AIP, the risk of DKD increased by 1.93-fold (Table 3) (Supplementarl Material).
Univariate and Multivariate logistic regression analysis results.

Abbreviations: AIP, atherogenic index of plasma; CI, confidence interval; D-D, D-dimer; FBG, fasting blood glucose; FDP, fibrin degradation products; Fib, fibrinogen; GGT, γ-glutamyl-transpeptidase; GLB, globulin; LDL-C, low-density lipoprotein cholesterol; Lym, lymphocyte; NE, neutrophils; OR, odds ratio; PLT, platelet; β2-MG, β2-microglobulin.
P-value < .05 was defined as statistically significant.
AIP as a risk factor for DKD and early liver injury in patients with T2DM
For patients with T2DM, stratified AIP analysis was performed at the AIP quartile level. The high-AIP4 (>0.2988) group had a 2.125-fold increased risk of developing DKD than the AIP1 (⩽0.0985) group (OR: 2.125, 95% CI: 1.495-3.021) (Figure 1A). The patients with T2DM were divided into high- and low-GPR groups, according to the mean GPR. In the low-GPR group (<0.1406), the risk of liver fibrosis was 3.994-fold greater in the AIP4 (>0.2988) group than that in the AIP1 (⩽0.0985) group (OR: 3.994, 95% CI: 2.672-5.971). Conversely, in the high-GPR group (>0.1407), this difference was not significant (Figure 1B).
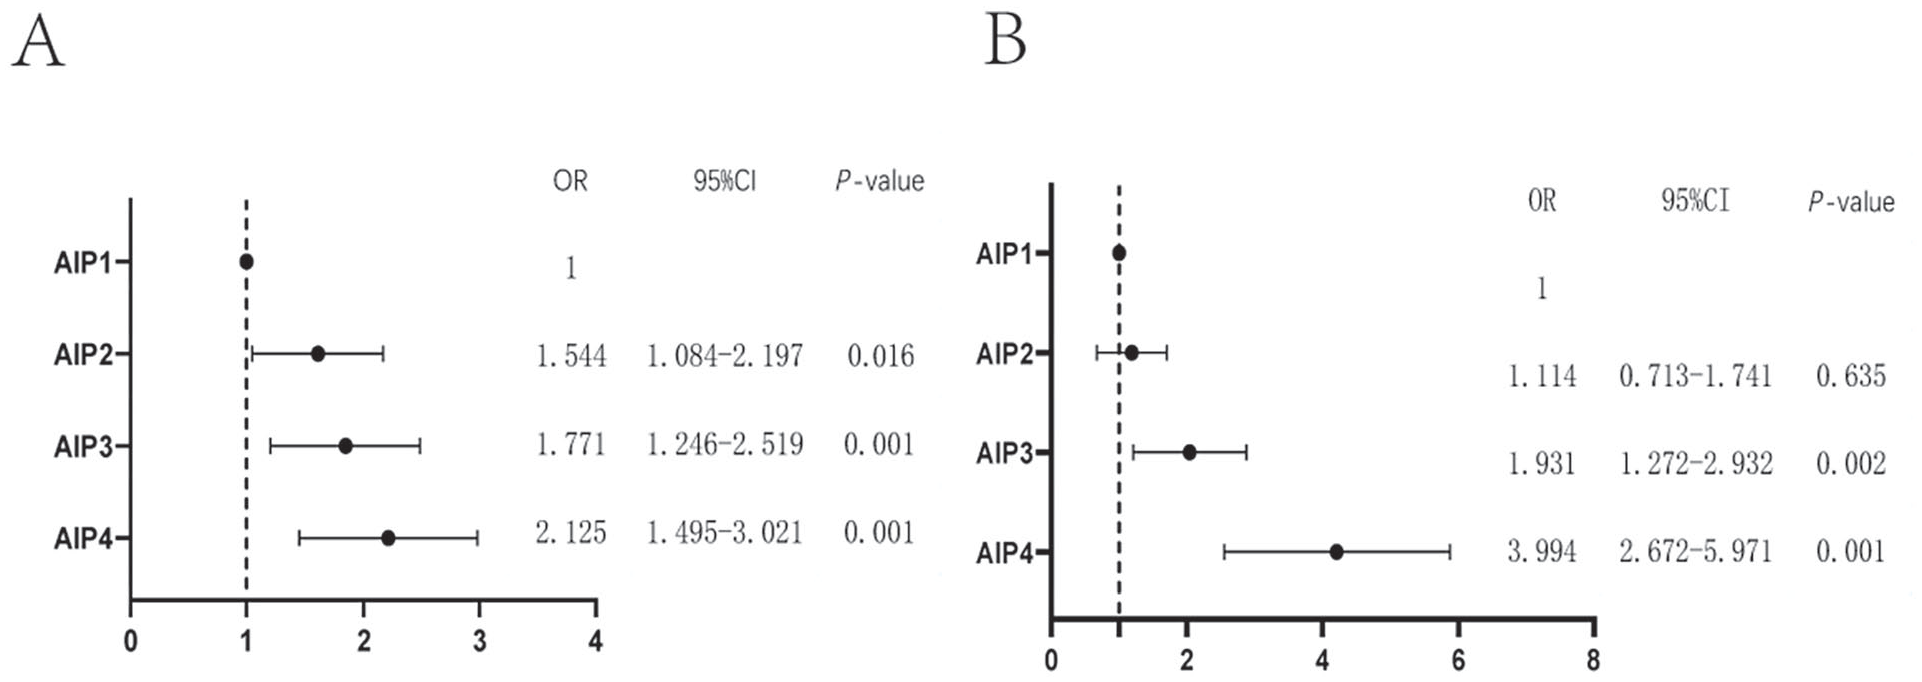
The relationship between AIP stratified analysis and the risk of DKD and GRP liver injury. (A) The relationship between AIP stratified analysis and the risk of DKD. (B) The relationship between AIP stratified analysis and the risk of high and low GPR groups.
AIP is a sensitive indicator of early renal injury in DKD
The AIP is associated with urinary microalbumin levels. However, the correlation between AIP and eGFR has not been previously studied. Patients with T2DM were classified according to eGFR (>60 or <60 mL/min/1.73 m2). AIP showed no significance in the eGFR <60 mL/min/1.73 m2 group. Further stratification of the eGFR >60 mL/min/1.73 m2 group identified a significance between AIP and an eGFR of 60-100 mL/min/1.73 m2; however, no significance was found between AIP and eGFR >100 mL/min/1.73 m2 (Figure 2).

AIP stratification of patients with T2DM based on eGFR subgroup analysis.
AIP is a sensitive indicator of early liver injury in T2DM
AIP is a risk factor of liver injury in patients with T2DM. Therefore, the predictive performance of the AIP for liver injury in patients with T2DM was analyzed using ROC curve analysis. The maximum AUC was 0.666, with a sensitivity of 76.5% and a specificity of 69.9%, indicating that AIP can serve as a sensitive indicator of liver injury (Figure 3).
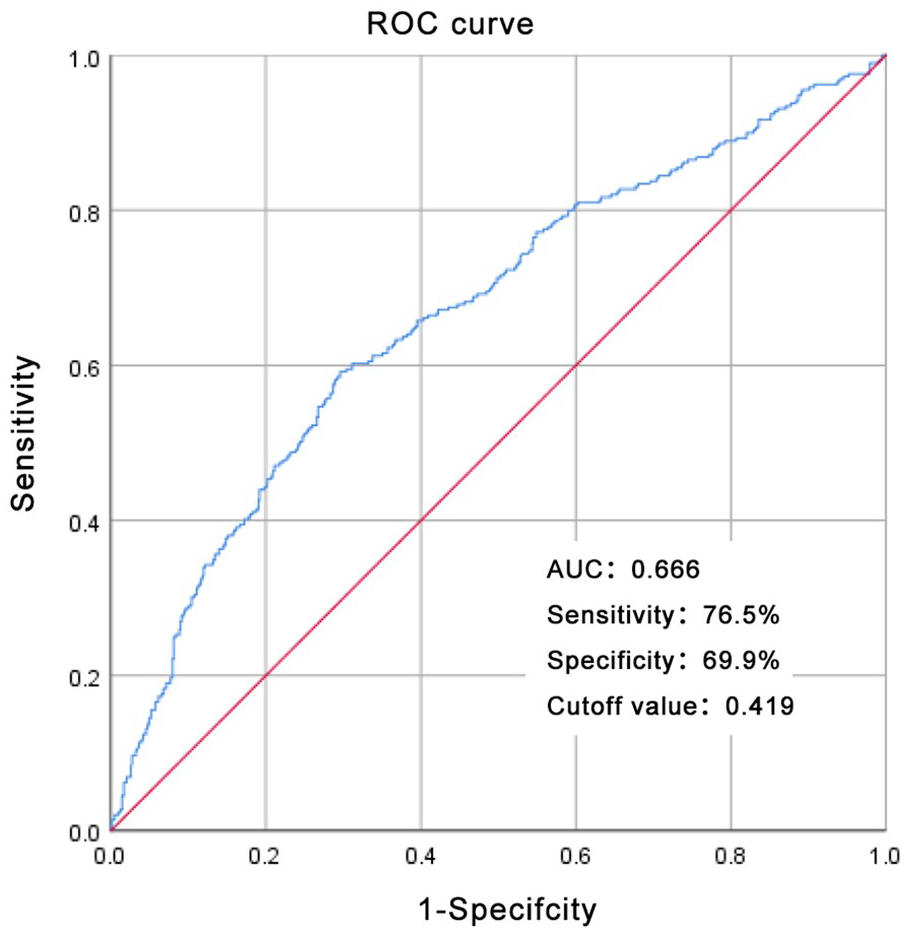
ROC curve of AIP on T2DM combined with early liver injury.
Discussion
To the best of our knowledge, this is the first study to explore the relationship between AIP and liver and kidney function in patients with T2DM. Our analysis found a significant increase in AIP in patients with DKD, which positively correlated with Crea, UA, and β2-MG levels and negatively correlated with eGFR. Additionally, the AIP demonstrated significance in patients with an eGFR of 60-100 mL/min/1.73 m2. AIP was significantly and positively correlated with liver function indicators (ALT, GCT, and GPR). In the low-level liver injury (GPR) group, the risk of DKD significantly increased with increasing AIP levels. Therefore, the AIP can be used as an intervention indicator for early liver and kidney function injuries in patients with T2DM.
The incidence of hepatic steatosis in patients with T2DM is 50%. 21 The German Diabetes Study found that the risk of metabolic liver disease and diabetes nephropathy was higher in patients with severe insulin resistance diabetes. 22 Consistent with previous studies, patients with T2DM and CKD showed more severe coagulation abnormalities, metabolic disorders, insulin resistance, and increased immune inflammation index, which manifested as high Fib, D-D, ALB, GCT, and FBG levels. The TG, SII, TyG, and GPR levels were higher in the non-DKD group (P < .01) Fib, D-D, GCT, and TG are synthesized and metabolized by the liver, indicating that patients with DKD exhibit a more severe compensatory liver function, which is the foundation for early chronic liver disease. This study found that the DKD group had a significant decrease in the levels of PNI and ALB, both of which are prognostic nutritional indicators. Overall, these results indicate a poor prognosis for patients with T2DM and CKD. It is worth noting some differences found in this study compared to previous studies. 23 Differences in GLB, lymphocyte, and PLT levels between the 2 groups were not significant (P > .05) indicating that immune factors may not be the main cause of DKD progression. Moreover, no significant difference was observed in blood ALT or LDL-C levels between the 2 groups. Although ALT levels are used as markers of liver function in clinical practice, early metabolism-related fatty liver disease may not be accompanied by histological changes. Further research is warranted to determine whether the significant difference in LDL-C levels between the 2 groups was related to the fact that the participants in this study were hospitalized and were predominantly treated with statins.
DKD occurs during the pathological and physiological processes of metabolic disorders in patients with T2DM. Early DKD renal damage is caused by the accumulation of senescent cells and an increase in the degree of fibrosis. 24 AIP is calculated based on the ratio of TGs to HDL-C and is easily measurable in clinical practice. Apolipoprotein B is a component of TGs that contributes to the development of atherosclerosis, whereas apolipoprotein A1 is a component of HDL-C that has a protective effect against atherosclerosis.
This study showed that AIP is not only associated with Crea, UA, and β2-MG (P < .01) and that β 2-MG is negatively correlated with eGFR but that a nonlinear correlation was present between AIP and the reduction of eGFR. Before the clinical diagnosis of CKD (eGFR was 60-100 mL/min/1.73 m2), the risk of diabetic nephropathy increased with an increase in AIP. The risk of diabetes nephropathy in the AIP4 group was 2.58-fold that in the AIP1 group. When eGFR was <60 mL/min/1.73 m2, AIP showed no significance between the 2 groups, indicating that AIP can predict the risk of DKD early.
In a study of patients with biopsy-confirmed diabetes nephropathy, the ratio of TG to HDL-C levels was associated with the incidence of cardiovascular disease but not with end-stage renal disease. 25 Yadegar et al. 26 found that the average level of TG decreased with the progression of renal failure in patients with T2DM. A study on 15 836 participants showed a linear correlation between AIP and eGFR, with each increase in SD of AIP reducing the risk of eGFR. 27 A cohort study of 911 360 individuals in the UK showed that elevated TG and decreased HDL-C levels were independently associated with a higher risk of CKD stages 4-5. 28
The ratio of TG to HDL-C can be used for the early diagnosis of nonalcoholic fatty liver disease. This study shows that the TG/HDL-C ratio can be used as an indicator of early liver injury in patients with T2DM. AIP was significantly correlated with ALT, GCT, and GPR (P < .01) but not with ALB and PNI, which are prognostic indicators for DKD.
Further stratified analysis showed that patients with AIP4 had a 3.994-fold higher risk of developing DKD in the GPR (<0.1406) and GPR (>0.1407) groups than in the AIP1 group. The ROC curve results showed that AIP could serve as an indicator for predicting liver fibrosis. After adjusting for age, Fib, D-D, FDP, and FBG in the multivariate regression analysis, AIP remained a risk factor for DKD progression with a significantly higher OR 1.795 (95% CI: 1.154-2.794) than those of the other indicators. For every SD increase in AIP, the risk of DKD increased by 1.795-fold. However, individual studies on the effect of AIP on DKD may be related to the abnormal body fat distribution and high visceral fat distribution in patients. 29
In addition, the TyG index is a sensitive indicator of insulin resistance, and this study showed a significant correlation between AIP and TyG. Previous studies have found that AIP is associated with TyG and helps predict the risk of cardiovascular disease. 30 This study found a significant correlation between AIP and blood NE count, which may serve as an inflammatory indicator affecting the progression of DKD.
AIP is easily obtainable and cost-effective in clinical practice, and understanding the potential use of AIP in delaying the progression of DKD is highly important. The strengths of this study include a sufficient sample size and representation of hospitalized patients. Furthermore, to obtain more reliable results, we adjusted for confounding variables. However, this study has several limitations that require careful interpretation of the results. First, the cross-sectional design prevented us from establishing a causal relationship. Second, although we adjusted for several related confounding factors, we cannot completely rule out the influence of other potentially confounding variables. For example, the type, dosage, body mass index, and diet of lipid-lowering drugs can affect data. Therefore, more participants and accurate measurements need to be studied in the future to determine the causal relationships. Prospective clinical studies are needed to clarify the effect of AIP interventions on diabetes nephropathy.
Conclusion
DKD has a high global burden and significantly increases the risk of renal failure and cardiovascular events. Questing marker that are easy to apply in clinical practice, sensitive, and responsive to early disease as intervention monitoring may be the most effective method .This study found an increase in AIP levels in DKD patients, which is positively associated with Crea, UA, and β 2-MG and negatively correlated with eGFR. In addition, AIP showed statistical significance between eGFR of 60-100 mL/min/1.73 m2. At the same time, AIP levels are closely related to liver function indicators (ALT, GCT, and GPR). In the low-level liver injury (GPR) group, the risk of DKD increases with the increase of AIP levels. Therefore, AIP may serve as a monitoring marker for early liver and kidney function damage in T2DM patients.
Supplemental Material
sj-docx-1-end-10.1177_11795514241259741 – Supplemental material for Atherogenic Index of Plasma as an Early Marker of Chronic Kidney Disease and Liver Injury in Type 2 Diabetes
Supplemental material, sj-docx-1-end-10.1177_11795514241259741 for Atherogenic Index of Plasma as an Early Marker of Chronic Kidney Disease and Liver Injury in Type 2 Diabetes by Huifang Li, Xia Miao, Jiaoying Zhong and Zhaoming Zhu in Clinical Medicine Insights: Endocrinology and Diabetes
Footnotes
Acknowledgements
This study was conducted at the Department of Nephrology and Endocrinology of Yi Ling Hospital, Hebei Province, China. We thank all the doctors and participating patients for their dedication to the study.
Declarations
Supplemental Material
Supplemental material for this article is available online.
References
Supplementary Material
Please find the following supplemental material available below.
For Open Access articles published under a Creative Commons License, all supplemental material carries the same license as the article it is associated with.
For non-Open Access articles published, all supplemental material carries a non-exclusive license, and permission requests for re-use of supplemental material or any part of supplemental material shall be sent directly to the copyright owner as specified in the copyright notice associated with the article.