
Abstract
Background:
Insulin resistance (IR) is common in women with polycystic ovary syndrome (PCOS). Metabolic syndrome (MS) involves IR, arterial hypertension, dyslipidemia, and visceral fat accumulation. Therefore, fatness indices and blood lipid ratios can be considered as screening markers for MS. Our study aimed to evaluate the predictive potential of selected indirect metabolic risk parameters to identify MS in PCOS.
Methods:
This cross-sectional study involved 596 women aged 18–40 years, including 404 PCOS patients diagnosed according to the Rotterdam criteria and 192 eumenorrheic controls (CON). Anthropometric and blood pressure measurements were taken, and blood samples were collected to assess glucose metabolism, lipid parameters, and selected hormone levels. Body mass index (BMI), waist-to-height ratio (WHtR), homeostasis model assessment for insulin resistance index (HOMA-IR), visceral adiposity index (VAI), lipid accumulation product (LAP), non-high-density lipoprotein cholesterol (non-HDL-C), and triglycerides-to-HDL cholesterol ratio (TG/HDL-C) were calculated. MS was assessed using the International Diabetes Federation (IDF) and the American Heart Association/National Heart, Lung, and Blood Institute (AHA/NHLBI) criteria.
Results:
MS prevalence was significantly higher in PCOS versus CON. Patients with both MS and PCOS had more unfavorable anthropometric, hormonal, and metabolic profiles versus those with neither MS nor PCOS and versus CON with MS. LAP, TG/HDL-C, VAI, and WHtR were the best markers and strongest indicators of MS in PCOS, and their cut-off values could be useful for early MS detection. MS risk in PCOS increased with elevated levels of these markers and was the highest when TG/HDL-C was used.
Conclusions:
LAP, TG/HDL-C, VAI, and WHtR are representative markers for MS assessment in PCOS. Their predictive power makes them excellent screening tools for internists and enables acquiring accurate diagnoses using fewer MS markers.
Keywords
Introduction
Polycystic ovary syndrome (PCOS) is a multisystem and lifelong disease with reproductive and metabolic features. PCOS patients increasingly seek the guidance of an internist. Insulin resistance (IR) is common in PCOS and linked to increased adiposity and metabolic syndrome (MS) development. 1 IR is independent of body mass excess yet exacerbated by overweight and obesity. 2 Evidence indicates that MS is a predictor of cardiovascular disease (CVD) risk. 3 Despite the high incidence of IR and MS in PCOS, neither IR nor MS is recognized as a PCOS diagnostic criterion. According to the recent international guideline by Teede et al., 1 glucose metabolism should be assessed at baseline in all PCOS patients. Glycemic status should be evaluated every 1 to 3 years, depending on the presence of type 2 diabetes (T2) risk factors. 1 In all PCOS women with body mass index (BMI) ⩾ 25 kg/m2, a fasting lipid profile – including total cholesterol (TC), low-density lipoprotein cholesterol (LDL-C), high-density lipoprotein cholesterol (HDL-C), and triglyceride (TG) levels – should be evaluated at diagnosis and monitored depending on the presence of hyperlipidemia and the estimated global CVD risk. In all PCOS patients, blood pressure (BP) should be monitored annually or more frequently in cases of patients with elevated global CVD risk. 1 Guidelines recommend annual measurements of weight, height, BMI, and waist circumference (WC), especially in high-risk ethnic groups.1,4 However, to date, there are no straightforward recommendations for MS screening in PCOS which would use specified, unified criteria or biomarkers.
Studies have shown that as much as 70% of PCOS women present with abnormal lipid profiles. 5 Lipid disturbances and increased body fat percentage are essential metabolic risk factors in PCOS. The use of indirect metabolic risk parameters in a high-risk population such as PCOS women has been extensively studied. 6 BMI and waist-to-height ratio (WHtR) are simple anthropometric parameters with the strongest associations with metabolic risk indicators. 7 Lipid ratios present a better predictive value than individual lipids in the CVD assessment. 8 LDL-C levels and other direct lipids could be optimal despite the elevation of other atherogenic lipoproteins and lipid indices in MS patients. 9 To this end, the ratio of TG to HDL-C (TG/HDL-C) and non-HDL-C are becoming widely used. 8 The lipid accumulation product (LAP) introduced by Kahn et al. 10 is a novel index of central lipid accumulation based on WC and TG, and it is positively associated with cardiometabolic risk. The visceral adiposity index (VAI) constitutes a powerful sex-specific mathematical model using WC, BMI, TG, and HDL-C levels to assess the visceral adipose function and insulin sensitivity.6,10
Most previous studies on the usefulness of body fat indices and lipid ratios in PCOS patients have been concerned with IR risk. 11 However, the predictive values or optimal cut-off values of LAP, VAI, non-HDL-C, TG/HDL-C, BMI, and WHtR for MS assessment have not been thoroughly investigated in PCOS.
Methods
This study aimed to explore the usefulness of six lipid and body fat indices: BMI, WHtR, LAP, VAI, non-HDL-C, and TG/HDL-C, as markers of MS risk in PCOS patients of reproductive age. We aimed to determine the cut-off values of the above-mentioned parameters for assessing MS risk and indicate the superior parameter for predicting MS in PCOS.
We enrolled 404 PCOS women aged 18–40 years, diagnosed according to the Rotterdam criteria and the recent international guideline at the Department of Endocrinology of the Heliodor Świȩcicki Clinical Hospital (Poznan, Poland) from September 2016 to March 2020.1,12
PCOS was confirmed when at least two of the following features were confirmed: oligo- or anovulation, biochemical or clinical hyperandrogenism (including acne and hirsutism assessed with the Ferriman–Gallwey score), presence of at least 20 follicles in each ovary measuring 2–9 mm in diameter, or an ovarian volume of > 10 ml of either ovary.1,12 Other causes of menstrual disorders were ruled out. A total of 192 eumenorrheic, non-hirsute, middle-aged women with no reported chronic diseases were recruited as controls (CON). Pregnant patients and those taking hormonal contraception within 3 months before the study were excluded.
The incidence of MS was determined according to the International Diabetes Federation (IDF) and the American Heart Association/National Heart, Lung, and Blood Institute (IDF-AHA/NHLBI) criteria (2009) (Table S1). 13 A general comparison of PCOS and CON is presented in Table S2. After MS diagnostics, the study sample was finally split into the following subgroups: PCOS with MS (MS-PCOS) (n = 64), PCOS with no MS (non-MS-PCOS) (n = 340), controls with MS (MS-CON) (n = 12), and controls with no MS (non-MS-CON) (n = 180) groups, a comparison of which is presented in Table 1.
Comparison of the study sample subgroups split according to MS criteria (t-test or Welch’s test dependently of homogeneity of variances).
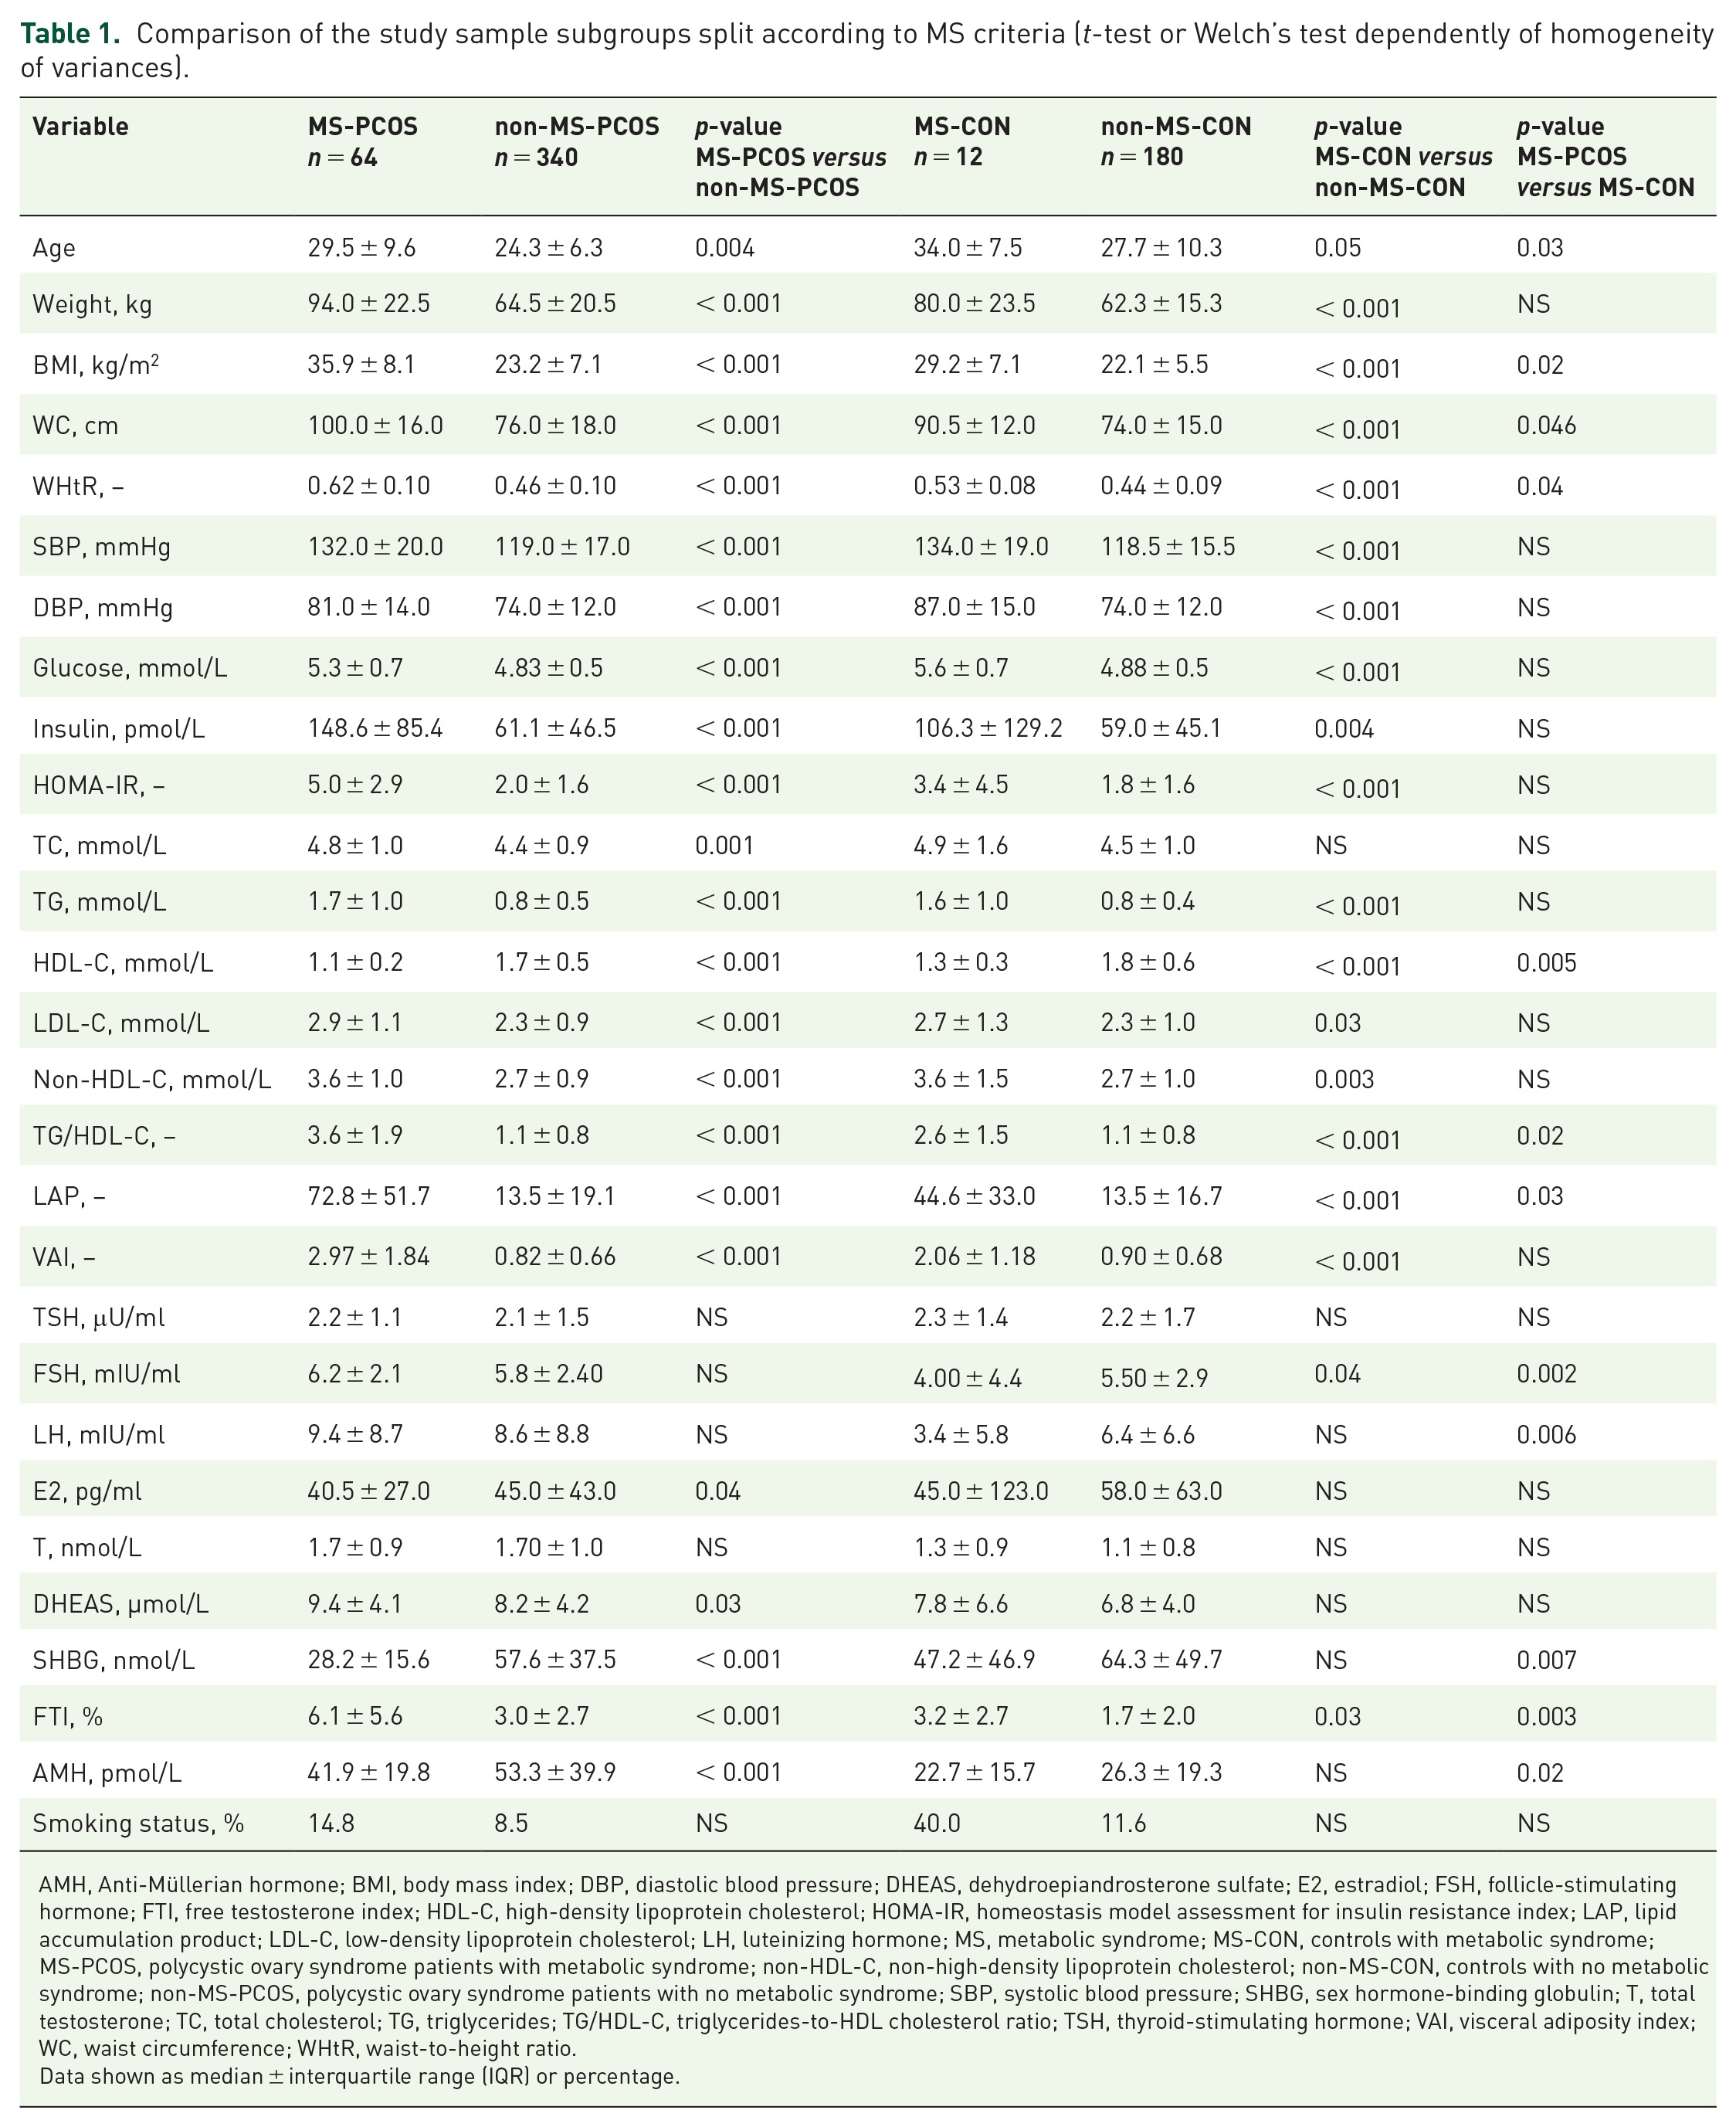
AMH, Anti-Müllerian hormone; BMI, body mass index; DBP, diastolic blood pressure; DHEAS, dehydroepiandrosterone sulfate; E2, estradiol; FSH, follicle-stimulating hormone; FTI, free testosterone index; HDL-C, high-density lipoprotein cholesterol; HOMA-IR, homeostasis model assessment for insulin resistance index; LAP, lipid accumulation product; LDL-C, low-density lipoprotein cholesterol; LH, luteinizing hormone; MS, metabolic syndrome; MS-CON, controls with metabolic syndrome; MS-PCOS, polycystic ovary syndrome patients with metabolic syndrome; non-HDL-C, non-high-density lipoprotein cholesterol; non-MS-CON, controls with no metabolic syndrome; non-MS-PCOS, polycystic ovary syndrome patients with no metabolic syndrome; SBP, systolic blood pressure; SHBG, sex hormone-binding globulin; T, total testosterone; TC, total cholesterol; TG, triglycerides; TG/HDL-C, triglycerides-to-HDL cholesterol ratio; TSH, thyroid-stimulating hormone; VAI, visceral adiposity index; WC, waist circumference; WHtR, waist-to-height ratio.
Data shown as median ± interquartile range (IQR) or percentage.
Participants’ weight was measured with an accuracy of up to 0.1 kg. Their height, WC, and hip circumference (HC) measurements were taken using stadiometers and circumference measuring tapes accurately up to 0.5 cm. WC measurement was taken halfway between the last palpable rib and the iliac crest. Greater trochanters served as the level for HC measurement. Selected anthropometric measurements were used for the calculation: BMI = body mass (kg)/[height (m)] 2 and WHtR = WC (cm)/height (cm).
BP was measured twice with a sphygmomanometer on the right arm, with a 5-min rest between measurements, and averaged to assess the systolic BP (SBP) and diastolic BP (DBP). Patients were classified as smokers if they consumed any amount of tobacco.
Biochemical laboratory tests were conducted after an 8-h night fast. They included baseline glucose, glucose at 120 min post-load in the oral glucose tolerance test (OGTT) with 75 g of glucose, insulin, TC, TG, LDL-C, HDL-C, thyroid-stimulating hormone (TSH), luteinizing hormone (LH), follicle-stimulating hormone (FSH), total testosterone (T), sex hormone-binding globulin (SHBG), dehydroepiandrosterone sulfate (DHEAS), estradiol (E2), and Anti-Müllerian hormone (AMH). Glucose concentration was assessed by the hexokinase method (Cobas 6000; Roche Diagnostics). Levels of TSH, LH, FSH, T, SHBG, DHEAS, E2, insulin, and AMH were measured using the Cobas 6000 Analyzer and dedicated ECLIA sets (Roche Diagnostics). Lower detection limits for hormones assessed by electrochemiluminescence immunoassay (ECLIA) were adopted from the limits published previously. 14
TC, TG, and HDL-C concentrations were measured by an enzymatic colorimetric method (Cobas 6000; Roche Diagnostics). LDL-C levels were estimated using Friedewald’s formula: LDL-C (mg/dl) = TC (mg/dl) − HDL-C (mg/dl) – TG (mg/dl)/5, unless TG ⩾ 400 mg/dl. 15 Based on the obtained lipid profile results, lipid metabolism indices of TG/HDL-C and non-HDL-C were also calculated. TG/HDL-C was calculated by dividing TG (mg/dl) by HDL-C (mg/dl), and non-HDL-C was estimated by subtracting HDL-C from TC. The LAP was calculated as follows: [WC (cm) – 58] × TG (mmol/L). 16 VAI was evaluated using the following sex-specific formula: 17 VAI = [WC/36.58 + (1.89 × BMI)] × (TG/0.81) × (1.52/HDL-C) (where WC is expressed in cm, BMI in kg/m2, TG in mmol/L, and HDL-C in mmol/L). The homeostasis model assessment for insulin resistance index (HOMA-IR) was calculated as the product of the fasting plasma insulin level (U/L) × fasting plasma glucose level (mg/dl)/405. 18 Free testosterone index (FTI) was estimated using the following calculation: FTI = 100 × (total testosterone/SHBG).
Statistical analysis
Statistical analysis was conducted using Statistica v.13.1 statistical software (TIBCO Software Inc., 2017, http://statistica.io). The distribution of continuous variables was examined using the Kolmogorov–Smirnov normality test. Descriptive statistics for quantitative variables were shown as the median and interquartile range (IQR). Differences in measured parameters between the PCOS and CON groups were calculated using independent-samples t-test. Mann–Whitney’s U-test was used for significantly skewed data. Pearson’s linear correlation coefficients were used to investigate the association between the lipid and obesity indices and other parameters. Two-tailed p-values of < 0.05 were considered statistically significant for all analyses. Propensity score matching (PSM) was applied to evaluate the effect of age and BMI on the selected predictors of MS.
Receiver operating characteristic (ROC) curve analysis was employed to determine the clinical efficacy and optimal cut-off values for lipid ratios in predicting MS. The optimal cut-off value for a particular index was identified as the point at which the Youden index (sensitivity + specificity – 1) was maximum.
Adjusted odds ratios [ORs; 95% confidence intervals (CIs)] for MS were calculated by logistic regression analysis according to the presence/absence of high levels of VAI, LAP, WHtR, and TG/HDL-C after controlling for age and BMI.
Ethics
Informed, written consent was obtained from all participants. The study was carried out in accordance with the Declaration of Helsinki after obtaining acceptance from the Board of Bioethics of the Poznan University of Medical Sciences (552/16; 986/17).
Results
General characteristics of PCOS and CON and comparison of subgroups
The general characteristics of the study sample are described in Table S2. Results showed that PCOS women tend to have significantly higher AMH, weight, BMI, WHtR, insulin, HOMA-IR, LH, FSH, androgens, and LAP and lower TSH, SHBG, E2, and HDL-C compared with those of CON. PCOS patients suffered from MS significantly more often than eumenorrheic CON (15.8% versus 6.2%, p = 0.002). Moreover, the IR frequency (HOMA-IR ⩾ 2.5) in PCOS was 45.0% – significantly higher than that in CON (30.7%, p = 0.01).
IR prevalence was also higher in MS-PCOS compared to MS-CON (90.63% versus 75%, p < 0.001). MS-PCOS patients were characterized by higher BP, simple and central obesity parameters, FTI, DHEAS, glucose and lipid metabolism parameters (except HDL-C), LAP, VAI, TG/HDL-C, and non-HDL-C and lower AMH, SHBG, E2, and HDL-C versus non-MS-PCOS. MS-CON had significantly lower AMH, BMI, WHtR, LH, FSH, FTI, LAP, VAI, and TG/HDL-C and higher age, SHBG, and HDL-C versus MS-PCOS (Table 1).
Correlation analysis
Linear correlation analysis between lipid ratios and obesity indices and biochemical and hormonal parameters in all PCOS women is presented in Table 2. Significant associations were noted between all the selected indices in PCOS. VAI correlated very strongly with TG/HDL-C and LAP (r = 0.996, p < 0.001, r = 0.925, p < 0.001, respectively). Very strong correlations were also observed between BMI and WHtR (r = 0.909, p < 0.001) and LAP and TG/HDL-C (r = 0.910, p < 0.001) (Table 2). Corresponding correlation analysis in CON is shown in Table S3.
Correlation analysis between obesity and lipid markers, and anthropometric, metabolic, and hormonal parameters in PCOS women (n = 404) (Pearson’s linear correlation coefficients and their significance).

AMH, Anti-Müllerian hormone; BMI, body mass index; DBP, diastolic blood pressure; DHEAS, dehydroepiandrosterone sulfate; E2, estradiol; FSH, follicle-stimulating hormone; FTI, free testosterone index; HOMA-IR, homeostasis model assessment for insulin resistance index; LAP, lipid accumulation product; LH, luteinizing hormone; non-HDL-C, non-high-density lipoprotein cholesterol; PCOS, polycystic ovary syndrome patients; SBP, systolic blood pressure; SHBG, sex hormone-binding globulin; T, total testosterone; TG/HDL-C, triglycerides-to-HDL cholesterol ratio; TSH, thyroid-stimulating hormone; VAI, visceral adiposity index; WC, waist circumference; WHtR, waist-to-height ratio.
MS components and metabolic parameters in PCOS and CON
Levels of selected metabolic parameters across several MS components in PCOS and CON are presented in Tables S4 and S5, respectively. Five out of six parameters (except non-HDL-C) increased with the increase in the number of MS criteria (from 0 to 5) in PCOS (all ps < 0.001). The prevalence of MS and its components in PCOS is presented in Table 3. Considering the individual MS components, the prevalence of elevated WC and low HDL-C was significantly higher in MS-PCOS versus MS-CON (p = 0.01).
Presence of individual components of MS in MS-PCOS and MS-CON patients (fraction difference test).

BP, blood pressure; HDL-C, high-density lipoprotein cholesterol; MS, metabolic syndrome; MS-CON, controls with metabolic syndrome; MS-PCOS, polycystic ovary syndrome patients with metabolic syndrome; TG, triglycerides; WC, waist circumference.
Predictive value of selected parameters
Results of ROC analysis are presented in Table 4. All six parameters demonstrated a high predictive value in identifying MS in PCOS and CON. Statistical significance assessment of differences between areas under the curves (AUCs) in PCOS showed that the AUCs of LAP index (0.946), TG/HDL-C (0.941), VAI (0.937), and WHtR (0.908) were the greatest, followed by BMI (0.888) and non-HDL-C (0.797) (Table S6). Optimal cut-off values (sensitivity, specificity) of LAP, TG/HDL-C, VAI, and WHtR for MS prediction were 30.75 (96.8%, 81.7%), 1.98 (87.5%, 86%), 1.73 (82.5%, 88.9%), and 0.52 (93.7%, 75.7%), respectively (Table 4).
Receiver operating characteristic (ROC) curve descriptors for selected parameters for predicting MS in PCOS and CON (ROC curve analysis).
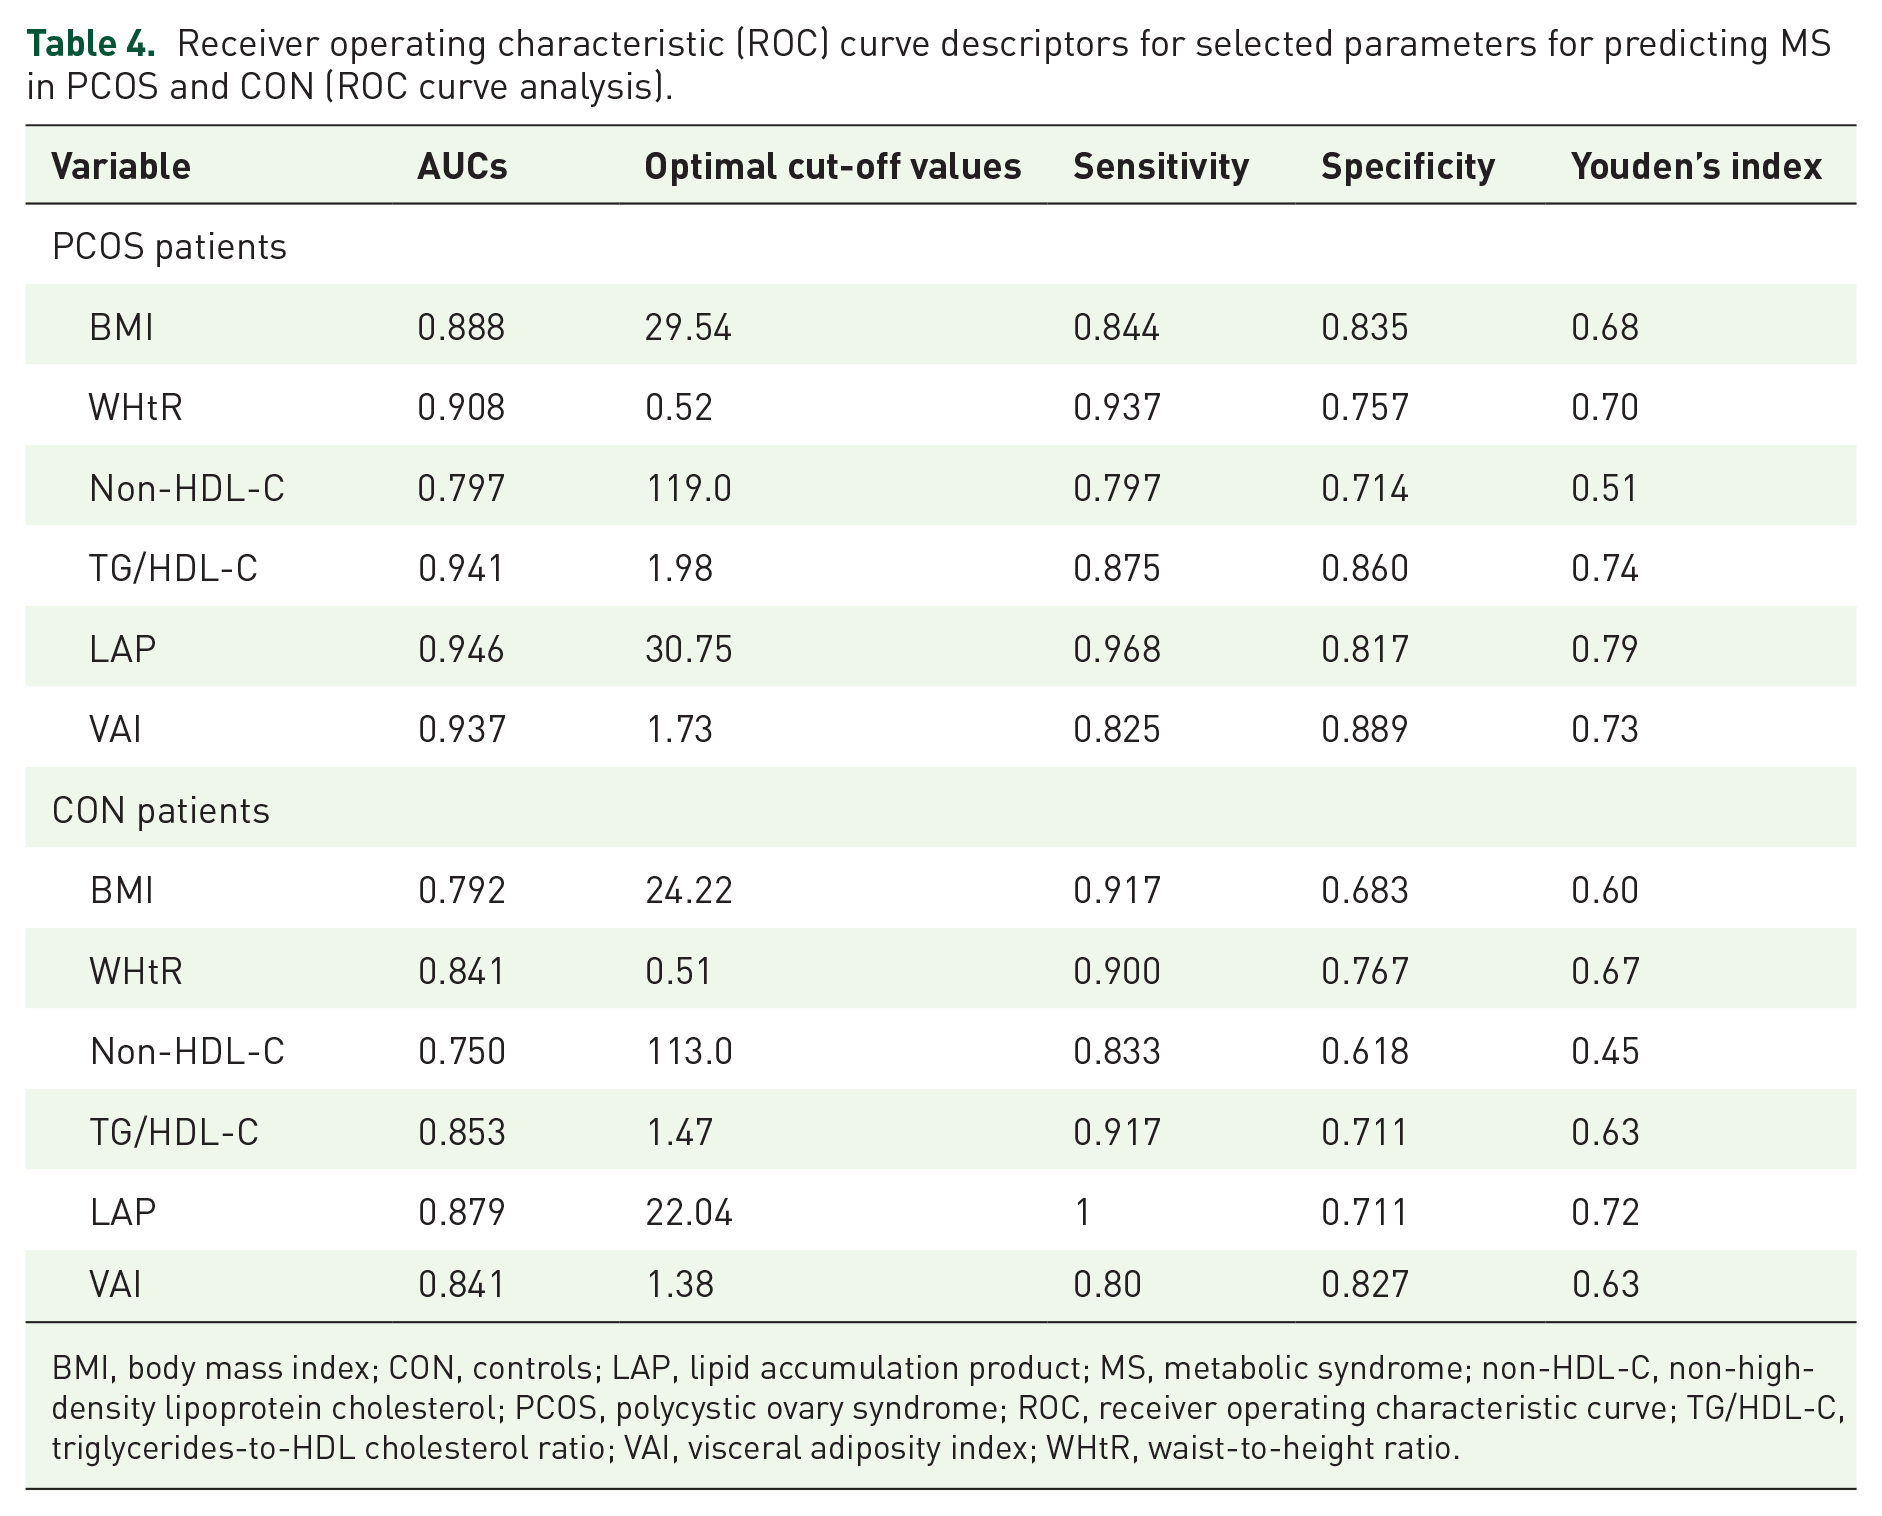
BMI, body mass index; CON, controls; LAP, lipid accumulation product; MS, metabolic syndrome; non-HDL-C, non-high-density lipoprotein cholesterol; PCOS, polycystic ovary syndrome; ROC, receiver operating characteristic curve; TG/HDL-C, triglycerides-to-HDL cholesterol ratio; VAI, visceral adiposity index; WHtR, waist-to-height ratio.
In CON, all six parameters had a similar predictive value in MS prognosis when considering AUCs (p > 0.05). AUCs to identify MS were 0.879 for LAP, 0.853 for TG/HDL-C, 0.841 for VAI and WHtR, 0.792 for BMI, and 0.750 for non-HDL-C. Sensitivity (specificity) of LAP, TG/HDL-C, VAI, WHtR, BMI, and non-HDL-C was 100% (71.1%), 91.7% (71.1%), 80% (82.7%), 90% (76.7%), 91.7% (68.3%), and 83.3% (61.8%), respectively (Table 4).
PCOS patients were characterized by a significantly higher BMI and a lower age than CON (p < 0.001, Table S2). Therefore, PSM was used to correct the assessment of the MS effect on the level of obesity and lipid parameters by the effect of the influence of confounding variables (BMI and age). After PSM (model for VAI), all six parameters showed outstanding discrimination of MS in PCOS (AUC ⩾ 0.9) (Table 5). The AUC values of VAI, TG/HDL-C, LAP, and WHtR were significantly higher than those of the BMI and non-HDL-C (p < 0.05) (Table S7). After PSM, the corrected cut-off values of VAI, TG/HDL-C, LAP, and WHtR for predicting MS in PCOS were 0.75, 0.97, 32.75, and 0.51, respectively. Analysis in CON did not give statistically significant models, so the results for this group were not presented.
ROC curve descriptors for predictors of MS in PCOS and CON models for VAI (ROC curve analysis).

BMI, body mass index; CON, controls; LAP, lipid accumulation product; MS, metabolic syndrome; non-HDL-C, non-high-density lipoprotein cholesterol; PCOS, polycystic ovary syndrome; ROC, receiver operating characteristic curve; TG/HDL-C, triglycerides-to-HDL cholesterol ratio; VAI, visceral adiposity index; WHtR, waist-to-height ratio.
Odds ratios for MS in PCOS
After adjusting for BMI and age, the odds ratio (OR; 95% CIs) for MS in PCOS, with TG/HDL-C above the cut-off value, was 140.57 (55.00–359.29) while that for LAP was 47.72 (21.72–104.84). In PCOS with WHtR above the cut-off value, OR for MS was 37.93 (16.99–84.68), whereas in PCOS with VAI above the cut-off value, OR for MS was 21.32 (10.14–44.85). Adjusted ORs, lower 95% CI (LCI), and upper 95% CI (UCI) for MS in individuals with high TG/HDL-C, LAP, WHtR, and VAI are shown in Figure 1.

Adjusted ORs for MS in PCOS patients with high TG/HDL-C, LAP, WHtR, and VAI.
Discussion
Dyslipidemia and obesity are inherent components of MS. 19 Lipid alterations are common in PCOS patients, regardless of BMI. 20 The current approach to MS risk evaluation in PCOS individuals remains suboptimal, although MS and CVD risk are elevated. 21 Finding a single, affordable MS predictor would greatly facilitate CVD risk estimation in PCOS. Recent research has suggested that biomacromolecule and lipid structure differences may be seen in early-stage PCOS. 22 Measurements of DHEAS or inflammatory markers such as serum IL-6 were also proposed as having prognostic importance in assessing metabolic disturbances in PCOS. 23 However, to the best of our knowledge, this is the first study analyzing and comparing the usefulness and cut-off values of LAP, VAI, non-HDL-C, TG/HDL-C, BMI, and WHtR as predictors of MS in PCOS.
In line with previous research, we confirmed that MS is around 2.5 times more common in PCOS than in eumenorrheic women.6,24 MS incidence in PCOS varies between 6.4% and 46% in previous studies, depending on patients’ age, ethnicity, and PCOS and MS criteria used.6,24 The comparatively moderate MS incidence we found could stem from the relatively young age of PCOS patients.
MS-PCOS women are more likely to present with hyperandrogenism, dyslipidemia, and other metabolic abnormalities.5,25 Our observations revealed a 1.5 times higher incidence of IR and worse metabolic and hormonal profiles in PCOS versus CON, as seen in other studies.5,25 Higher obesity indices and levels of LAP, VAI, and TG/HDL-C were also observed in MS-PCOS versus MS-CON. All lipid parameters, except HDL, were higher in MS-PCOS versus non-MS-PCOS. The role of MS in aggravating the course of PCOS needs to be considered in further studies.
Our study showed that selected obesity and lipid indices were significantly related to IR and individual MS components in CON and the total PCOS sample (Tables 2 and S3). The increase in the number of MS components correlated with elevated LAP, VAI, TG/HDL-C, BMI, and WHtR (Table S4), supporting previous research. 26
Based on the ROC analysis, all six selected parameters constitute representative markers to assess MS in PCOS and CON. According to Hosmer and Lemeshow’s classification for AUC, the LAP, TG/HDL-C, VAI, and WHtR were described as predictors of MS in PCOS with outstanding discrimination ability. 27 Therefore, LAP, VAI, TG/HDL-C, and WHtR seem to be better than BMI and non-HDL-C for recognizing MS risk in both PCOS and CON.
The optimal cut-off values of LAP, TG/HDL-C, VAI, WHtR, non-HDL-C, and BMI for predicting MS in PCOS were higher than the corresponding cut-off values in CON (Table 4). Perhaps, some compensatory or defense mechanisms in PCOS make only higher values of these indices alarming in terms of MS risk; however, this remains to be investigated. 28
PSM with well-documented properties for statistical inference was adopted to limit confounding bias. 29 After PSM, all six parameters appeared useful in recognizing MS risk in PCOS. Our study found BMI and non-HDL-C to be acceptable for predicting MS in PCOS but inferior to LAP, VAI, TG/HDL-C, and WHtR (Table 4). After PSM, the cut-off value of 5 out of 6 predictors of MS (except LAP) in PCOS was lower than that before PSM (Table 5), which could result from the lower median BMI and WHtR in PCOS after PSM.
Both VAI and LAP are reliable mathematical models that incorporate anthropometric and lipid parameters to predict MS. In line with previous research, our study found that LAP and VAI are powerful MS predictors in PCOS. 30 In prior studies, VAI was elevated in PCOS regardless of the phenotype or only in patients with phenotype B. 31 However, VAI levels were comparable between PCOS and CON in our observations. Differences in VAI thresholds could result from variations in participants’ ethnicity, age, BMI, and dietary patterns among various studies. 32 Due to the small sample size of MS-PCOS in our study, PCOS women were not subdivided phenotypically. De Medeiros et al. 33 demonstrated that VAI was the best predictor of MS in PCOS irrespective of obesity. According to Bronczyk-Puzon, the VAI cut-off of > 1.675 indicated metabolically unhealthy PCOS women, 34 which is similar to the cut-off we established, possibly because both studies involved a Polish PCOS population. We demonstrated an increased OR (21.32) for MS in PCOS with VAI ⩾ 1.73.
LAP is an even more easily accessible marker of MS than VAI. Our study confirmed that LAP levels are higher in PCOS than in CON.10,30 LAP had the highest MS diagnostic accuracy in all PCOS phenotypes in a study by Bozic-Antic et al. 30 It was also the strongest predictor of MS (AUC 0.83, cut-off = 35.63) and IR (AUC 0.781, cut-off = 39.73) in a study by Rashid et al. 35 and of MS in a research by Macut et al. 36 (cut-off = 25.9). The differences in LAP cut-off values could result from ethnic, age, BMI, or WHtR differences. LAP and VAI values depend on the age of PCOS women. Higher VAI was observed in PCOS versus CON at an early reproductive age, whereas at a late reproductive age, higher LAP was found in a study by Echiburu et al. 37 However, Tola et al. 38 failed to find the predictive effect of LAP on CVD risk in PCOS patients after adjusting for abdominal obesity. Our study adjusted the predictive effect of metabolic markers for age and BMI but not for WHtR.
WHtR has been advocated as a simple, cost-effective and practical predictor identifying individuals at risk of MS. 39 Its higher levels in PCOS versus CON in our study support the literature.14,40,41 Our study suggests that WHtR has a predictive power comparable to LAP and VAI and constitutes an outstanding discriminator of MS in PCOS. Costa et al. 40 suggested that WHtR and WC are more sensitive and specific MS-predictive parameters than WHR and conicity index (C index). Techatraisak et al. 41 noted that VAI was the best MS predictor, followed by BMI and WHtR. In line with previous research, our results showed WHtR to be a better anthropometric indicator of MS in PCOS patients than the commonly used BMI and should therefore be used commonly in future studies.14,39
PCOS women had higher BMI than eumenorrheic women, both in our research and in recent studies.14,42 We demonstrated that BMI could be a useful, inexpensive MS predictor, but its accuracy is lower than that of LAP, VAI, TG/HDL-C, or WHtR. BMI advantages include its low cost and accessibility. However, as an indirect body adiposity indicator, BMI does not distinguish between fat and muscles. 43 Also, ethnicity influences BMI in PCOS women. 1 The BMI cut-off value we estimated (29.54) is similar to the widely known cut-off value for obesity diagnosis (30.0), which constitutes a universal risk indicator of common conditions related to excess body mass, including CVD and T2D. 44
The ratio of TG/HDL-C is a classic lipid index showing the balance between the atherogenic and the anti-atherogenic lipoproteins. TG/HDL-C appears to be a useful cardiometabolic predictor in healthy women independent of their body weight status. 45 Contrary to previous observations in which TG/HDL-C was higher in PCOS versus CON, we did not find a significant difference in this ratio between these two groups, which could result from ethnic differences among studies. 46 However, TG/HDL-C demonstrated an outstanding discriminatory power in the context of MS in the present study. In fact, the MS risk was the highest when TG/HDL-C was used [OR; 95% CIs: 140.57 (55.00–359.29)]. As in our research, the TG/HDL-C, with a cut-off value of 3.3, showed a high predictive value of MS in Korean adolescents. 47 A similar TG/HDL-C cut-off value of 3.23 was suggestive of MS in another study. 48 A wide range of cut-off values for TG/HDL-C for MS prediction (from 0.61 to 4.03) were proposed in previous studies, and these values were dependent on sex (higher in men) and age. 49 In our study, the cut-off value of TG/HDL-C calculated by the ROC analysis was lower than those mentioned above, possibly due to the influence of age and ethnicity. Several studies have shown non-HDL-C to be a useful indicator of MS. 50 In a recent study by Paredes et al., 8 as much as 25–31% of patients with MS had high non-HDL-C, despite having LDL-C levels below the cut-off. As Wild et al. 20 found, non-HDL-C levels were higher in PCOS women, regardless of BMI. However, non-HDL-C was not significantly higher in PCOS versus CON in our study. Ethnic differences in non-HDL-C levels were proven previously. 51 The discriminative power of non-HDL-C was lower than that of the other five indices in our study.
Our cross-sectional study did not assess the long-term risk of MS development and CVD as future outcomes in PCOS women. Thus, prospective follow-up studies are required to evaluate the role of lipid and obesity indices in estimating such risk. Our results cannot be directly applied to other nationalities and races because only Polish women were evaluated in this study. Further research on the exact cut-off points of all studied parameters should be undertaken to establish values for various ethnicities, races, and age groups. Moreover, the number of participants in subgroups differed and was relatively low in MS-PCOS and MS-CON, limiting data interpretation. Additional studies on larger PCOS groups with different phenotypes should be conducted in the future to individualize PCOS assessment and treatment. Further research should also consider the level of participants’ physical activity as a factor affecting MS incidence and analyze the nutrient and fat intake to evaluate its impact on the lipid parameters.
Conclusion
PCOS women with high BMI, WHtR, LAP, VAI, TG/HDL-C, or non-HDL-C levels are at increased risk for MS and should therefore be under the care of an internist. LAP, TG/HDL-C, VAI, and WHtR, when compared to BMI and non-HDL-C, were found to be the superior markers to identify MS in PCOS. These lipid and obesity indices should be widely applied in MS assessment in PCOS during routine and screening examinations. Because they appear to have a similar, outstanding value in MS prediction, they could be used interchangeably to indicate PCOS individuals at risk of MS. Particularly, LAP and WHtR seem to be the inexpensive and accessible markers of metabolic disturbances that may predict MS in PCOS women. Employing one of these replaces the need to use multiple predictors, and it may identify women who require lifestyle changes or pharmacologic interventions to prevent or manage MS.
Supplemental Material
sj-docx-1-tae-10.1177_20420188211066699 – Supplemental material for Lipid ratios and obesity indices are effective predictors of metabolic syndrome in women with polycystic ovary syndrome
Supplemental material, sj-docx-1-tae-10.1177_20420188211066699 for Lipid ratios and obesity indices are effective predictors of metabolic syndrome in women with polycystic ovary syndrome by Małgorzata Kałużna, Magdalena Czlapka-Matyasik, Pola Kompf, Jerzy Moczko, Katarzyna Wachowiak-Ochmańska, Adam Janicki, Karolina Samarzewska, Marek Ruchała and Katarzyna Ziemnicka in Therapeutic Advances in Endocrinology and Metabolism
Footnotes
Authors’ note
Pola Kompf is now affiliated to Heliodor Świȩcicki Clinical Hospital, Poznan, Poland.
Author contributions
Conflict of interest statement
The authors declared no potential conflicts of interest with respect to the research, authorship, and/or publication of this article.
Funding
The authors disclosed receipt of the following financial support for the research, authorship, and/or publication of this article: This study was supported by the funding from the ‘Young Scientists’ grant awarded in 2016 by the Poznan University of Medical Sciences, Faculty of Medicine II, for research on ‘Genetic analysis and metabolic parameters in slim and obese patients with polycystic ovary syndrome (PCOS)’ (no. 502-14-02221355-41164; to M.K.).
Supplemental material
Supplemental material for this article is available online.
References
Supplementary Material
Please find the following supplemental material available below.
For Open Access articles published under a Creative Commons License, all supplemental material carries the same license as the article it is associated with.
For non-Open Access articles published, all supplemental material carries a non-exclusive license, and permission requests for re-use of supplemental material or any part of supplemental material shall be sent directly to the copyright owner as specified in the copyright notice associated with the article.