
Abstract
Objective
We aimed to evaluate whether traditional and non-traditional adiposity indicators are associated with cardiometabolic risk factors among adult patients with type 2 diabetes mellitus (DM).
Methods
In this cross-sectional study among 240 inpatients with type 2 DM, we determined traditional anthropometric indicators including body mass index, waist circumference, hip circumference (HC), waist-to-hip ratio (WHR), waist-to-height ratio, and non-traditional anthropometric indicators including lipid accumulation product (LAP), visceral adiposity index (VAI), deep abdominal adipose tissue (DAAT), and Després indices. Lipid profile, fasting blood glucose, glycated hemoglobin (HbA1c), systolic blood pressure (SBP), and diastolic blood pressure (DBP) were measured to evaluate cardiometabolic parameters.
Results
In overweight patients, DAAT was positively correlated with total triglycerides. LAP was negatively correlated with serum HDL-C levels. WHR and DAAT were associated with total triglycerides, HbA1c, total cholesterol, total cholesterol/HDL-C, and total triglycerides/HDL-C, after adjustment for age and duration of disease. VAI, DAAT, LAP, and Després index were significant determinants of lipid profile and SBP.
Conclusion
Traditional and non-traditional anthropometric indices are associated with cardiometabolic risk factors in patients with type 2 DM.
Keywords
Introduction
Diabetes mellitus (DM) has become a major global public health problem during the past decade, especially in developing countries. Despite strategies and efforts to reduce the burden of disease in Iran, the prevalence of DM has gradually increased since 1999. Iran had an estimated 3.78 million cases of DM in 2009 and this number is expected to increase to 9.24 million by 2030. 1 Type 2 DM is associated with micro- and macro-vascular problems that lead to cardiovascular disease (CVD) and increase mortality in this population. 2 Cardiometabolic risk factors refer to markers that increase the possibility of developing vascular events or diabetes. Age, sex, family history, hypertension, dyslipidemia, dysglycemia, and smoking have been recognized as traditional risk factors for CVD. Abdominal obesity (measured as waist circumference [WC]) is considered a newer cardiovascular risk factor. 3 WC consists of both subcutaneous adipose tissue (SAT) (classically non-ectopic) and visceral adipose tissue (VAT) (classically ectopic). Ectopic fat is defined as excess adipose tissue in locations not typically related to adipose tissue storage. 4
It has been shown that excess visceral adiposity is an independent indicator of poor cardiovascular outcomes. 5 Assessment of VAT as a cardiometabolic risk factor is important because VAT is associated with more adverse levels of metabolic risk factors as compared with SAT.5,6 Additionally, seminal work in mice has shown that transplantation of SAT, but not VAT, to an intra-abdominal site resulted in beneficial effects on metabolism. 6 Taken together, these findings suggest that information about the distribution of body fat beyond WC may provide important insights into metabolic and CVD risk.
The management of patients with type 2 DM should not only focus on lowering blood glucose levels but should also aim to prevent cardiovascular complications. 7 Traditional anthropometric parameters such as WC, waist-to-hip ratio (WHR), and waist-to-height ratio (WHtR) are indicators of general or central obesity. Several studies have shown an increase in cardiometabolic risk factors following the increase of traditional anthropometric parameters.8–11 Because WC, WHR, and WHtR appear to be slightly superior predictors than body mass index (BMI) among non-institutionalized adults, these indicators complement the use of BMI in identifying cardiovascular risk factors. 11 Early diagnosis and treatment of individuals with abdominal fat, particularly visceral or ectopic adiposity, are the main contributors to reducing cardiometabolic risk; 3 therefore, novel and easy-to-use indicators of visceral adiposity, including lipid accumulation product (LAP), visceral adiposity index (VAI), deep abdominal adipose tissue (DAAT), and the Després index, have been suggested as non-traditional adiposity indicators.12,13
Several reports have shown the predictive value of LAP for cardiovascular events among the European 14 and Asian general populations.15,16 VAI is a new indicator that takes into account the anatomical location of adipose tissue and the height of the examined person. VAI was introduced based on clinical data and magnetic resonance imaging performed in a healthy population. 17 VAI is determined separately for women and men; in addition to anthropometric data, it includes biochemical measurement values such as total serum triglyceride (TG) levels and high-density lipoprotein (HDL-C). VAI has been shown to be a strong and independent risk factor for diabetes among the Asian general population 18 and plays a crucial role in assessing cardiometabolic risk factors. 19 It has been shown that individuals with a higher risk for coronary heart disease have a higher VAI. 20 However, VAI and LAP may not be better than other typical parameters used in the prediction of type 2 DM. 21
DAAT provides more precise measurements of local fat distribution, a major indicator of cardiovascular events, using computed tomography (CT) scans.22–26 It has been demonstrated that patients with type 2 DM have higher VAI, DAAT, and LAP in relation to healthy individuals. 20 The Després index is an equation including WC and age that was first developed for the prediction of DAAT accumulation from anthropometric measurements in a sample of men. The Després index may provide further evidence in the risk assessment of CVD among men. 27
Because of unhealthy sedentary lifestyles and ethnic variations, greater visceral fat accumulation and obesity are present in Asian than Western populations. 28 However, the potential association of traditional and non-traditional anthropometric indicators with the risk of cardiometabolic events has not been previously investigated among Iranian patients with type 2 DM. These associations need further evaluation owing to metabolic and hemodynamic changes that may affect this relationship. Studies have shown the ability of traditional and non-traditional anthropometric measurements, in relationship to overall and regional adiposity, for evaluation of cardiometabolic risk factors among the general population 29 and patients with stable coronary artery disease. 13 Thus, the overall aim of this study was to investigate the relationship of traditional adiposity anthropometric indices including body weight, WC, WHR, WHtR, BMI, and hip circumference (HC), and non-traditional adiposity anthropometric indices including LAP, VAI, DAAT, and the Després index, with cardiometabolic risk factors among inpatients with type 2 DM.
Methods
Study design and participants
This was a cross-sectional study conducted between March 2020 to August 2020. The reporting of this study conforms to the Strengthening the Reporting of Observational Studies in Epidemiology (STROBE) guidelines. 30
All included participants were clinically stable, with no new symptoms for more than 2 months and no need to be urgently examined by a physician owing to CVD or new vascular problems. Patients were enrolled from the Ayatollah Taleghani Educational and Medical Center of Abadan University of Medical Sciences in Khuzestan, Iran. All patient details were de-identified. All patients had a similar medication regime and were being treated with insulin and aspirin. Insulins, including regular insulin, neutral protamine hagedorn (NPH), detemir, and glargine, were prescribed by a specialist in internal medicine. None of the patients consumed alcohol. A diabetic diet is routinely prescribed for all patients, with daily calorie requirements based on their weight, height, and age, by a hospital-based nutritionist; therefore all patients followed a similar diet throughout their hospital stay.
We excluded patients with factors that can modify the effect of anthropometric indices in the assessment of cardiometabolic risk factors, as follows: 13 patients age less than 20 years; those who underwent surgery in the previous 90 days; those with cancer, active infection, inflammatory diseases, or another chronic diseases; patients with sickle cell anemia, thalassemia, or chronic renal failure, which directly affects serum glycated hemoglobin (HbA1c) levels; those who were currently using sodium-glucose cotransporter 2 inhibitors (which decrease HbA1c, body weight, and blood pressure and increase HDL-C), antihypertensive or statin drugs (which directly influence blood pressure and serum lipid levels), glucagon-like peptide-1 (which influences lipid profiles and blood pressure in long-term administration), or pioglitazone (which decreases serum TG and increases HDL-C concentrations); patients with grade 3 obesity (BMI ≥40) to increase the accuracy of anthropometric measurements; and patients undergoing dialysis.
Measurement of anthropometric indices and adiposity indicators
The body weight of participants was calculated (in kilograms) using an electronic scale for anthropometric measurement. Height was also measured with an accompanying stadiometer and expressed in centimeters. To record their exact weight, patients were asked to take off their shoes, empty the contents of their pockets, remove jewelry and accessories, and to only wear light clothing.
WC measurements were obtained using a flexible, non-elastic calibrated measuring tape. WC was measured at the level of the umbilicus from the point between the last rib arch and the iliac crest, with the patient in the supine position. WC was recorded to the nearest tenth of a centimeter. We measured HC using the largest diameter of the large trochanter. BMI was classified according to World Health Organization (WHO) guidelines. 31 The following mathematical formulas were used to calculate the sex-specific values of traditional and non-traditional adiposity indices for all participants. VAI in men (WC/39.68 + [1.88 × BMI]) × (total TG/1.03) × (1.31/HDL-C) and in women (WC/36.58 + ([1.89 × BMI] × (total TG/0.81) × (1.52/HDL-C); LAP in men: total TG × (WC– 65) and LAP in women: total TG × (WC−58); DAAT in men: −382.9 + (1.09 × weight) + (6.04 × WC) + (−2.29 × BMI) and DAAT in women: −278 + (−0.86 × weight) + (5.19 × WC). The Després index was calculated as −225.39 + 2.125 ×age + 2.843 × WC.
In these formulas, total TG and HDL-C levels, WC, weight, and age were expressed as mmol/L, cm, kg, and years, respectively. 13 Because the equation for the Després index was developed using a sample of men, 27 we restricted the analysis using this index to male patients in our dataset.
Biochemical measurements
Blood was collected from participants after at least an 8-hour overnight fast. Whole blood was centrifuged immediately after collection, and plasma and serum samples were frozen and stored at −80°C for future analysis. Samples for fasting blood glucose (FBG), 2-hour postprandial blood sugar (BS2hpp), and HbA1c were tested immediately. Fresh surplus EDTA–whole blood samples were used for evaluation of HbA1c, which was measured using a NaycoCard Reader II (Axis-Shield; Oslo, Norway) and boronate affinity chromatography. Serum glucose and lipid profile including total cholesterol (mmol/L), total TG (mmol/L), low-density lipoprotein cholesterol (LDL-C), and HDL-C were measured using Paadco kits (Tehran, Iran) and a biochemical autoanalyzer (BT 3000; Biotechnica Instruments, Rome, Italy). TG/HDL-C, LDL-C/HDL-C, and total cholesterol/HDL-C were calculated using mathematical formulas.
Blood pressure measurement
Blood pressure was measured in duplicate according to American Heart Association guidelines. 30 Blood pressure measurement was performed between 8 and 10 A.M. on the right arm with patients in the seated position. An automatic blood pressure monitor (Omron Health Care Co., Ltd., Kyoto, Japan) was used for measurement, and the mean of the two values was used in the analysis.
Sample size calculation and statistical analysis
The sample size was calculated using the Medcalc® program for Windows. Cardiometabolic parameters (lipid profile, FBG, HbA1c, systolic blood pressure [SBP], and diastolic blood pressure [DBP]) were the dependent variables. The independent variables (covariates) were traditional and non-traditional anthropometric parameters (BMI, WC, HC, WHR, WHtR, body weight, VAI, DAAT, LAP, and Després index). Normality of the variables was confirmed using the Kolmogorov–Smirnov test and the skewness of each continuous variable.
The mean ± standard deviation (normal distribution) are used to describe the quantitative variables. Qualitative variables are presented as number (%). According to nutritional status classified according to BMI, we used analysis of variance and Pearson’s chi-squared tests for between-group comparisons. To evaluate correlations, we used Pearson’s correlation coefficient. To control for confounders, we applied partial correlation to assess the independent correlations, adjusted for age and duration of disease.
Effect sizes were estimated to measure the strength of the relationship between anthropometric indices and cardiometabolic risk factors in multiple linear regression, using the Cohen formula
Research ethics and patient consent
The present study was approved by the ethics committee of Abadan University of Medical Sciences (reference number: IR.ABADANUMS.REC.1399.003) and was performed in accordance with the principles outlined in the Declaration of Helsinki. All participants signed a written informed consent form prior to the start of the study. Written informed consent for the publication of patient information and images was also provided by all patients or their legally authorized representative.
Results
In total, 240 inpatients (110 men and 130 women) aged 32–90 years who were diagnosed with uncontrolled type 2 DM by internal medicine specialists were randomly selected, according to the inclusion criteria (Figure 1).
Patient characteristics according to sex and BMI
To explore the associations of anthropometric measurements with cardiometabolic risk factors, we used cross-sectional analysis of the data. The participant selection process is depicted in Figure 1. The following participants were excluded from the analysis: those with missing data of serum biochemistry (n = 25), patients with hypertension (n = 56), following a different medication regimen from the inclusion criteria (n = 5), those age less than 20 years (n = 3), patients with chronic diseases other than DM (n = 36), grade 3 obesity (n = 15), and those who were undergoing dialysis (n = 12). No participants had missing data for the independent and dependent variables. Demographic characteristics of the included study participants are shown in Table 1. Participants’ mean age increased significantly with increasing BMI (P < 0.001).

Flow diagram for the selection of participants in this study.
Demographic characteristics according to BMI (n = 240).

Values are presented as mean ± standard deviation or n (%).
BMI, body mass index.
Table 2 shows the clinical and laboratory characteristics of the included patients. A higher mean duration of disease (years) was found in men (P = 0.003) and women (P = 0.001) with higher BMI. There was a significant difference in BMI classification according to cardiometabolic risk factor variables (P < 0.001), except for total cholesterol/HDL-C. A higher mean FBG was found in men and women with higher BMI (P ≤ 0.001 for both sexes). In addition, a higher mean BS2hpp and HbA1c was found in women, but not men, with higher BMI (P ≤ 0.001). However, TG/HDL-C was inversely associated with elevated BMI in both men (P = 0.005) and women (P = 0.027). There were significant differences according to BMI for anthropometric indices (all P < 0.05) in both men and women, except for WHR.
Clinical and laboratory characteristics according to BMI (n = 240).

Values are presented as mean ± standard deviation.
BMI, body mass index; BS2hpp, 2-hour postprandial blood glucose; DBP, diastolic blood pressure; DAAT, deep abdominal adipose tissue; FBG, fasting blood glucose; HC, hip circumference; HbA1c, glycated hemoglobin; HDL-C, high-density lipoprotein cholesterol; LAP, lipid accumulation product; LDL-C, low-density lipoprotein cholesterol; SBP, systolic blood pressure; VAI, visceral adiposity index; WHR, waist-to-hip ratio; WHtR, waist-to-height ratio; WC, waist circumference; TG, triglycerides.
Traditional anthropometric indicators and cardiometabolic risk factors
The correlation between traditional and non-traditional anthropometric indices and cardiometabolic risk factors is shown in Supplemental Figures 1, 2, and 3. In patients with normal BMI, HC (r = 0.656, P = 0.001; Supplemental Figure 1a) and WC (r = 0.614, P = 0.002; Supplemental Figure 1b) were positively correlated with HbA1c. Moreover, WC was positively correlated with LDL-C (r = 0.479, P = 0.024; Supplemental Figure 1c). In overweight patients, WC showed a positive correlation with HbA1c (r = 0.313, P ≤ 0.001; Supplemental Figure 2a), LDL-C (r = 0.206, P ≤ 0.001; Supplemental Figure 2b), and total serum cholesterol levels (r = 0.18, P = 0.011; Supplemental Figure 2c).
Non-traditional anthropometric indicators and cardiometabolic risk factors
In patients with normal BMI, DAAT was positively correlated with TG/HDL-C (r = 0.522, P = 0.013; Supplemental Figure 1d) and LDL-C/HDL-C (r = 0.601, P = 0.003; Supplemental Figure 1e). In overweight patients, DAAT (r = 0.183, P = 0.009; Supplemental Figure 2f) was positively correlated with total TG whereas LAP (r = −0.154, P = 0.029; Supplemental Figure 2e) was negatively correlated with serum HDL-C levels. In addition, LAP (r = 0.27, P ≤ 0.001; Supplemental Figure 2d) and Després index (r = 0.261, P = 0.01; Supplemental Figure 2i) were positively correlated with total serum cholesterol levels. DAAT was positively correlated with TG/HDL-C (r = 0.292, P ≤ 0.001; Supplemental Figure 2g) and LDL-C/HDL-C (r = 0.308, P ≤ 0.001; Supplemental Figure 2h). In obese patients, LAP presented a positive correlation with total cholesterol (r = 0.7, P = 0.003; Supplemental Figure 3a) and VAI showed a positive correlation with SBP (r = 0.536, P = 0.032; Supplemental Figure 3b).
Tables 3 and 4 show the adjusted partial correlations between the anthropometric indices that remained related to the respective cardiometabolic risk factors among normal weight, overweight, and obese patients, after adjusting for age and duration of disease.
Partial correlation (r)† between cardiometabolic risk factors and anthropometric indices in overweight patients.

*P < 0.05; **P ≤ 0.01; ***P ≤ 0.001.
†Adjusted for age and duration of disease.
BMI, body mass index; DBP, diastolic blood pressure; DAAT, deep abdominal adipose tissue; FBG, fasting blood glucose; HC, hip circumference; HbA1c, glycated hemoglobin; HDL-C, high-density lipoprotein cholesterol; LAP, lipid accumulation product; LDL-C, low-density lipoprotein cholesterol; TG, triglycerides; SBP, systolic blood pressure; VAI, visceral adiposity index; WHR, waist-to-hip ratio; WHtR, waist-to-height ratio; WC, waist circumference.
Partial correlation (r) between cardiometabolic risk factors and anthropometric indices in obese patients†.
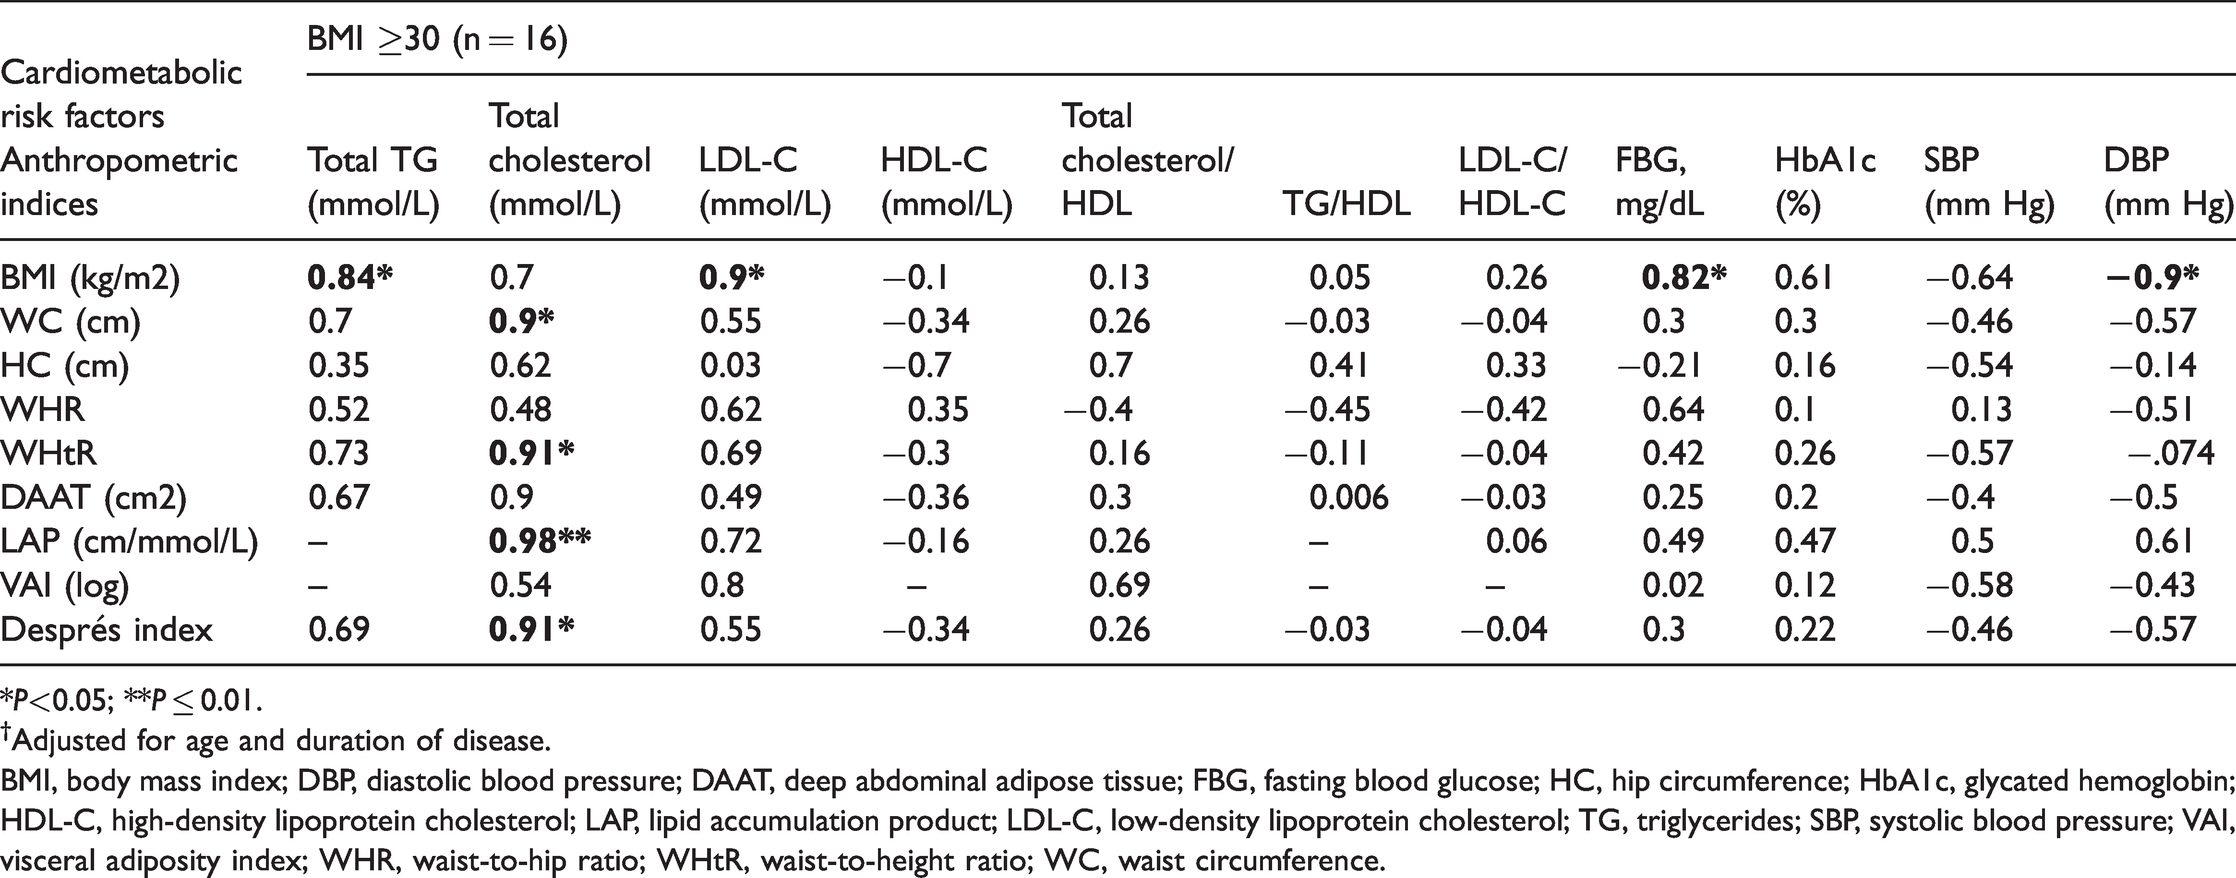
*P<0.05; **P ≤ 0.01.
†Adjusted for age and duration of disease.
BMI, body mass index; DBP, diastolic blood pressure; DAAT, deep abdominal adipose tissue; FBG, fasting blood glucose; HC, hip circumference; HbA1c, glycated hemoglobin; HDL-C, high-density lipoprotein cholesterol; LAP, lipid accumulation product; LDL-C, low-density lipoprotein cholesterol; TG, triglycerides; SBP, systolic blood pressure; VAI, visceral adiposity index; WHR, waist-to-hip ratio; WHtR, waist-to-height ratio; WC, waist circumference.
After adjusting for age and duration of disease among overweight patients, DAAT, LAP, and Després index were positively correlated with total serum cholesterol levels, total cholesterol/HDL-C, LDL-C/HDL-C, FBG, HbA1c, and SBS. In addition, DAAT and the Després index were positively correlated with total serum TG levels and TG/HDL-C. VAI was positively correlated with total serum cholesterol levels, LDL-C, and HbA1c. WHR was negatively correlated with serum HDL-C levels. BMI, WC, WHtR, DAAT, LAP, and the Després index were positively correlated with SBP. However, among overweight patients, the correlations found in the bivariate analysis between WC with total serum cholesterol and LDL-C levels as well as LAP with HDL-C did not remain significant in partial correlation after adjusting for age and duration of disease (Table 3).
In obese patients, BMI was positively correlated with total serum TG, LDL-C, and FBG levels. WHtR showed a strong positive correlation with total serum cholesterol levels, and LAP had a strong positive correlation with total serum cholesterol levels (Table 4).
Among patients with normal BMI, we found a positive correlation of serum BS2hpp levels with WC (r = 0.89, P = 0.008), HC (r = 0.86, P = 0.01), LAP (r = 0.82, P = 0.025), DAAT (r = 0.88, P = 0.008), and the Després index (r = 0.89, P = 0.008). We also found a negative correlation between VAI with SBP (r = −0.84, P = 0.02) and DBP (r = −0.84, P = 0.02). Moreover, HC showed a positive correlation with HbA1c (r = 0.81, P = 0.03) and serum LDL-C levels (r = 0.82, P = 0.03). However, correlations in bivariate analysis of WC with HbA1c and serum LDL-C levels and DAAT with TG/HDL-C and LDL-C/HDL-C did not remain significant in partial correlation after adjusting for age and duration of disease (data not shown).
The results of multiple linear regression analyses for cardiometabolic measures are presented in Tables 5 and 6. Table 5 shows that WC, HC, body weight, BMI, WHR, and WHtR were significant determinants of lipid and glycemic profile, SBP, and DBP, depending on the analyzed cardiometabolic parameter.
Final linear regression models to explain the variance in cardiometabolic risk factors.

Traditional anthropometric measurements were independent covariates.
Linear regression model was applied to analyze the data.
†Variables with significant coefficient (P<0.05).
*P<0.05; **P≤0.01.
BMI, body mass index; BS2hpp, 2-hour postprandial blood glucose; DBP, diastolic blood pressure; DAAT, deep abdominal adipose tissue; FBG, fasting blood glucose; HC, hip circumference; WC, waist circumference; HbA1c, glycated hemoglobin; HDL-C, high-density lipoprotein cholesterol; LAP, lipid accumulation product; LDL-C, low-density lipoprotein cholesterol; SBP, systolic blood pressure; VAI, visceral adiposity index; WHR, waist-to-hip ratio; WHtR, waist-to-height ratio; TG, triglycerides; CI, confidence interval.
Final linear regression models to explain the variance in cardiometabolic risk factors.

Non-traditional anthropometric measurements were independent covariates.
Linear regression model was applied to analyze the data.
†Variables with significant correlation (P<0.05).
*P <0.05; **P ≤ 0.01; ***P ≤ 0.001.
BMI, body mass index; BS2hpp, 2-hour postprandial blood glucose; DBP, diastolic blood pressure; DAAT, deep abdominal adipose tissue; FBG, fasting blood glucose; HC, hip circumference; WC, waist circumference; HbA1c, glycated hemoglobin; HDL-C, high-density lipoprotein cholesterol; LAP, lipid accumulation product; LDL-C, low-density lipoprotein cholesterol; SBP, systolic blood pressure; VAI, visceral adiposity index; WHR, waist-to-hip ratio; WHtR, waist-to-height ratio; TG, triglycerides; CI, confidence interval.
Results in Table 5 show that in patients with normal BMI, HC was positively associated with HbA1c (f2 = 0.026, 95% CI = 0.00–0.05), explaining 2.5% of the variance in HbA1c, which indicated a low risk of uncontrolled DM. WC was a strong predictor for serum LDL-C levels (f2 = 0.76, 95% CI = 0.01–0.18), explaining 43% of LDL-C variance and indicating an increased risk of hypercholesterolemia.
In overweight patients, WC was a medium predictor for total TG (f2 = −0.11, 95% CI = −0.13 to −0.01) and total serum cholesterol (f2 = −0.15, 95% CI=−0.22 to −0.07) as well as a weak predictor for HbA1c (f2 = 0.01, 95% CI=0.002–0.02), explaining 9.9%, 12.6%, and 0.99% of WC variances, respectively. WHR was a strong predictor of HDL-C (f2 = −1, 95% CI=−1.38 to −0.68), total cholesterol/HDL-C (f2 = 1.6, 95% CI=0.26–2.9), and TG/HDL-C (f2 = 1.7, 95% CI=0.36–3.04), explaining 50.6%, 61.2%, and 63% of variance in HDL-C, total cholesterol/HDL-C. and TG/HDL-C, respectively. Body weight was a significant predictor for LDL-C/HDL-C (f2 = 1.0, 95% CI=0.002–0.02), explaining 50% of LDL-C/HDL-C variance. Moreover, BMI was a strong positive predictor of FBG (f2 = 1.33, 95% CI=0.28–2.4), explaining 57% of FBG variance. However, BMI was a weak positive predictor for total serum TG levels (f2 = 0.01, 95% CI=0.005–0.02) and a weak negative predictor for HDL-C (f2 = −0.01, 95% CI=−0.03 to −0.001). Finally, WHtR was a strong predictor for SBP (f2 = 37.58, 95% CI=1.03–74.13) and DBP (f2 = 87.88, 95% CI=37.23–138.51), explaining 97% and 99% of SBP and DBP variance, respectively.
In obese patients, WHtR was a significant predictor for higher total cholesterol (f2 = 6.04, 95% CI=1.44–10.65) and LDL-C (f2 = 5.87, 95% CI=1.18–10.56), explaining 86% and 85% of total cholesterol and LDL-C variance, respectively. WHR was a significant predictor of FBG (f2 = 191.6, 95% CI=66.4–316.8) and BS2hpp (f2 = 285.44, 95% CI=83.1–487.8), explaining 99.5% and 99.7% of the variance in FBG and BS2hpp, respectively. Finally, BMI was a strong predictor of BS2hpp (f2 = 6.3, 95% CI=0.92–11.67), explaining 86% of BS2hpp variance. Generally, WHR and BMI consistently showed an increasing effect on dysglycemia.
Table 6 shows that VAI, DAAT, LAP, and Després index were significant determinants of lipid profile and SBP but not glycemic profile and DBP, depending on the analyzed cardiometabolic parameter. As the table shows, in patients with normal BMI, VAI was negatively associated with LDL-C (f2 = −0.74, 95% CI=−1.03 to −0.06), explaining 42.5% of variance in serum LDL-C levels. DAAT showed a positive association with TG/HDL-C, but the percentage of variance in TG/HDL-C explained by DAAT was low.
In overweight patients, LAP had a small effect on serum HDL-C levels. Moreover, the effects of DAAT on total serum TG levels and TG/HDL-C, as well as LAP and the Després index on total serum cholesterol levels were weak. In obese patients, VAI was positively associated with a risk of high SBP (f2 = 7.3, 95% CI=0.72–13.89), explaining 88% of SBP variance. However, the effect of LAP on total serum cholesterol levels in obese patients was weak.
Discussion
DM is a major risk factor for CVD. 32 Obesity is a worldwide epidemic and leads to a 20% increased risk of acute myocardial infarction. 33 Evidence shows that obesity plays a major role in the development of type 2 DM.34,35 In our study, nearly 90% of patients had excess adiposity. This finding suggests that obesity was not properly controlled in these high-risk patients. Moreover, we found correlations between traditional and non-traditional adiposity indices and cardiometabolic risk factors in normal weight, overweight, and obese patients, considering factors such as age and duration of disease. Finally, we determined the effect size for traditional and non-traditional anthropometric indices on the lipid and glycemic profile, SBP, and DBP.
In patients with normal BMI, WC was positively associated with HbA1c and serum LDL-C levels, after adjustment for age and duration of disease. Our findings were in agreement with those of a previous cross-sectional study in which an association was identified between WC and HbA1c among migrants in Finland. 36 According to our results, WC was a strong predictor of higher serum LDL-C levels in patients with normal BMI. We should consider metabolic abnormalities that may or may not be related to obesity because evidence shows that unhealthy individuals with normal metabolic status are at increased risk for CVD and type 2 DM.37–39 Because individuals with normal BMI are usually not the target of screening programs, they may not receive proper intervention. 38
In overweight patients, WC was positively associated with HbA1c, after adjustment for age and duration of disease. This was in agreement with previous findings from a cross-sectional study among adults in which associations of WC with HbA1c were confirmed in population-based data. 40 Moreover, in our study, the results of linear regression showed that WC was a positive predictor for serum LDL-C levels, indicating a 46% increased risk of hypercholesterolemia in patients with normal BMI.
In overweight patients, HC showed a significant association with lipid profile and HbA1c, after adjustment for age and duration of disease. However, the results of linear regression showed that HC was not a significant determinant of cardiometabolic risk among overweight patients.
WHR was a strong predictor of HDL-C, total cholesterol/HDL-C, and total TG/HDL-C in overweight patients; these were responsible for more than 50% of the variance in serum HDL-C levels per unit increase in WHR. WHR was also a strong positive predictor of the lipid profile among overweight patients and the glycemic profile among obese patients. The largest effect sizes were observed between WHR and the glycemic profile in obese patients. Moreover, BMI was a strong predictor of the glycemic profile in overweight and obese patients. We observed that worsening glycemic status was associated with higher WHR and BMI, suggesting that these two simple measures of obesity were correlated with the pathogenesis of type 2 DM.
WHtR tended to show the best performance for prediction of hypertension and hypercholesterolemia in overweight and obese patients, respectively. WHtR can potentially serve as a standard screening tool in patients with type 2 DM, in agreement with other studies.41–43 However, the associations of BMI and WC with dyslipidemia and the effect sizes were weak. Hence, BMI, WC, WHR, and WHtR may differ in their ability to identify cardiometabolic risk factors. Apart from this, because the units of each anthropometric indicator differ, it is inappropriate to directly compare values of effect sizes. Therefore, we estimated the effect size using the Cohen formula and found that WHR and WHtR may have a stronger association with cardiometabolic risk factors than WC, HC, body weight, and BMI. Previous epidemiological studies have shown that central obesity indicators, such as WHtR, are more closely associated with CVD risk factors than BMI, which is consistent with our results.41,44 This may be because ectopic fat deposition triggers pathological metabolic reactions, which increases the risk of metabolic diseases. 45
The results of the present study revealed that VAI was the best predictor of SBP and LDL-C among the evaluated non-traditional indices of adiposity in patients with type 2 DM. VAI was proposed for the first time by Amato et al. 17 as a valuable indicator for visceral adipose function in a non-obese healthy population, showing an independent association with cardiovascular events. In our study population, VAI was positively associated with lipid profile but not glycemic and blood pressure parameters among overweight patients. These results are consistent with a retrospective cross-sectional study among the general population of Polish adults where VAI was significantly correlated with total cholesterol levels and blood pressure and the values of SBP and DBP were weakly correlated with VAI. Thus, VAI may be a useful parameter in clinical assessment of cardiometabolic risk factors. 19 It is noteworthy that, in our multiple linear regression model, normal-weight patients had a low hypercholesterolemia risk with increasing VAI, which is supported by the results of a cohort study 46 and large collaborative analyses of 57 prospective studies. 47 One of the most important results in the current study was the strong negative association of VAI with LDL-C among normal-weight patients. Thus, the calculation of VAI might be of great importance in normal-weight patients with high cardiovascular risk, which might not otherwise be satisfactorily screened.
In our study, the largest effect size was observed for VAI with dyslipidemia and hypertension markers, in comparison with those of LAP, DAAT, and the Després index. Of note, our results demonstrated that compared with other non-traditional adiposity indicators, VAI was the best predictor of hypertension among obese patients with type 2 DM, which could make this index a helpful indicator in screening for cardiometabolic risk factors. However, the effect size of VAI was not greater than those of traditional adiposity indicators. WHtR was superior to VAI in the prediction of hypertension. Other traditional and non-traditional parameters showed no predictive effect on blood pressure. Therefore, further research is needed to establish the predictive role of VAI for cardiometabolic risks among patients with type 2 DM. The superiority of VAI over conventional anthropometric indices in predicting unhealthy metabolic cardiac phenotype has been demonstrated in other population-based studies in Asia, the United States, and Europe.18,38,48 The role of VAI as a strong predictor for hypertension among obese patients with type 2 DM is in line with the results in a community-based survey 49 and in patients undergoing hemodialysis 50 as well as those with polycystic ovary syndrome. 51
In the present study, a higher VAI predicted a lower LDL-C and LDL-C/HDL-C among patients with normal BMI. However, in the prediction of a low HDL-C among overweight patients, the usefulness of WHR in diagnosis was greater than that of VAI. Evaluation of prediction ability, considering the proportions of variance among patients with normal BMI, showed that the effect size of VAI for decreased LDL-C values was 42.5%, representing a large effect size. 38 In addition, the effect size of VAI for a high SBP among obese patients was 88%, indicating a large effect size. 52
Ferreira et al. 38 evaluated the possibility of using VAI to identify people with unhealthy metabolic phenotype among the Brazilian population and confirmed the accuracy of this index and its diagnostic superiority over conventional anthropometric indicators, especially in normal-weight individuals. In addition, Du et al. 53 found that normal-weight participants with the highest VAI values had a healthy metabolic profile. These results highlight the utility of VAI as a reliable indicator for determining cardiometabolic risk. VAI-induced production of adipokine and activation of the proinflammatory system may serve as evidence for inflammation as a potential mechanism linking adipose tissue and cardiometabolic risk. 54
Based on the observed relationship between other evaluated non-traditional indicators of adiposity and cardiometabolic risk factors, we concluded that these were correlated with cardiometabolic risk factors, albeit with less effect than VAI. The observed differences between VAI and other non-traditional indicators of obesity in terms of their predictive value for metabolic cardiac risk factors would be expected; both lipid parameters and anthropometric measurements were entered into the equation to calculate the VAI whereas only anthropometric measurements were included in the equations for calculating DAAT and the Després index.
As mentioned, we revealed that VAI was an appropriate diagnostic indicator for cardiometabolic risk factors. It is important to note that the formulas used to calculate VAI and LAP included some of the assessed cardiometabolic risk factors (e.g., total TG, and the formula for VAI also includes HDL-C). Hence, assessment of the relationships between VAI and serum TG, HDL-C, LDL-C/HDL-C. and TG/HDL-C ratios as well as LAP with serum TG levels were not considered in our study.
In the present study, DAAT showed a positive association with dyslipidemia among participants with normal BMI. Additionally, among overweight patients, DAAT and LAP were significantly and positively correlated with dyslipidemia, dysglycemia, and hypertension, after adjustment for age and duration of disease. However, multiple linear regression showed that DAAT was a weak predictor for hypertriglyceridemia among overweight patients.
In obese patients, LAP showed a strong positive association with hypercholesterolemia after adjusting for age and duration of disease. However, multiple linear regression showed that LAP was a weak predictor for dyslipidemia among overweight and obese patients. This result is in line with those of a similar study in a general population of Iranian adults with normal BMI, which showed that LAP is an independent predictor of cardiovascular events but is not superior to other anthropometric indices. 16 Another Iranian study among a general population of adults showed that the magnitude of increased risk of CVD owing to LAP was independent of BMI, WHtR, and WHR in women. However, WHtR showed a stronger association with increased risk of CVD than LAP among men. Therefore, LAP was not superior to WHR and WHtR for predicting CVD. 55 Wehr et al. 46 demonstrated that high LAP values are predictive of mortality, independently of other cardiovascular risk factors, in normal-weight postmenopausal women living with diabetes, but not in men. However, these findings were constrained to normal-weight women with DM. The differing results might be related to differences in the study population and design. Accordingly, our findings regarding LAP among overweight and obese patients may be confounded by the fact that our study population was probably at high risk for cardiovascular events.
Our results also showed that in overweight male patients, the Després index had a significant association with dyslipidemia, dysglycemia, and hypertension, after adjustment for age and duration of disease. However, multiple linear regression revealed that the Després index was a weak predictor of hypercholesterolemia in overweight men. These results revealed that the Després index, which uses simple anthropometric measures, has a limited ability to predict the risk of CVD.
In recent years, several reports have been published on new biomarkers of a high cardiovascular risk. However, most of these biomarkers are costly and not suitable for routine use. 46 Moreover, the measurement of excess visceral fat requires CT or soft tissue densitometry, which is also unavailable in routine clinical practice. Given the need for substitute predictors, we proposed the use of simple and inexpensive non-traditional anthropometric indices, especially VAI, to predict cardiometabolic risk factors among adult patients with type 2 DM, who may generally be considered a high-risk population. However, the use of these indices did not differ from the application of traditional anthropometric indices in predicting cardiometabolic risk factors in this patient population.
This study has some limitations. The study population was limited to individuals with type 2 DM, which hinders the generalizability of the results and also most likely introduces biases into the observed associations. Moreover, most patients were White men and few patients had a normal BMI. Owing to the cross-sectional design of the study, we were unable to determine causality in assessing the association between measures of adiposity and the studied health outcomes. We did not have a control group of participants without type 2 DM. Additionally, we did not assess the physical activity status of participants or compare this between groups. However, in a similar study, no significant difference was observed in the level of physical activity measured using the International Physical Activity Questionnaire (IPAQ) between overweight, obese, and normal-weight participants. 13 In this study, the association between ectopic fat and anthropometric indices was not determined so as to evaluate whether these can be used to estimate ectopic fat; this should be addressed in future studies. Past studies have shown that the assessment of LAP may be valuable in identifying patients with insulin resistance accompanied by ectopic lipid deposition as well as liver fat accumulation. 56 In addition, data on family history of type 2 DM, treatments, related home remedies (including antidiabetic drugs), and CVD-related illnesses could have been included to control for confounders. However, because demographic information was collected from patients' records and this information was unavailable in their medical files, it was not possible to obtain these data. This information should be considered in the analysis of the results of the future studies. We also suggest direct measurement of fat mass/adiposity, such as using bioelectric impedance analysis or dual-energy X-ray absorptiometry, for comparisons with the study results.
In conclusion, we found that general and abdominal adiposity were both associated with cardiometabolic risk in adults with type 2 DM; however, in comparison with other traditional and non-traditional indices, WC and VAI may be stronger predictors of dyslipidemia among patients with normal BMI. WHR and BMI were strong predictors for dysglycemia in obese adults, and WHtR and VAI were strong predictors for hypertension in overweight and obese patients, respectively. Finally, all traditional anthropometric indices and VAI may be slightly more useful as predictors of cardiometabolic risk factors than other non-traditional ones. However, this relationship needs to be assessed further because variables such as changes in ectopic fat with comorbidities, family history, and medication history may have an influence on these associations.
Supplemental Material
sj-pdf-1-imr-10.1177_03000605211049960 - Supplemental material for Associations between traditional and non-traditional anthropometric indices and cardiometabolic risk factors among inpatients with type 2 diabetes mellitus: a cross-sectional study
Supplemental material, sj-pdf-1-imr-10.1177_03000605211049960 for Associations between traditional and non-traditional anthropometric indices and cardiometabolic risk factors among inpatients with type 2 diabetes mellitus: a cross-sectional study by Sahar Golabi, Sajad Ajloo, Fatemeh Maghsoudi, Maryam Adelipour and Mahshid Naghashpour in Journal of International Medical Research
Supplemental Material
sj-pdf-2-imr-10.1177_03000605211049960 - Supplemental material for Associations between traditional and non-traditional anthropometric indices and cardiometabolic risk factors among inpatients with type 2 diabetes mellitus: a cross-sectional study
Supplemental material, sj-pdf-2-imr-10.1177_03000605211049960 for Associations between traditional and non-traditional anthropometric indices and cardiometabolic risk factors among inpatients with type 2 diabetes mellitus: a cross-sectional study by Sahar Golabi, Sajad Ajloo, Fatemeh Maghsoudi, Maryam Adelipour and Mahshid Naghashpour in Journal of International Medical Research
Footnotes
Acknowledgements
The authors thank all patients who contributed to the study.
Declaration of conflicting interests
The authors declare that there are no conflicts of interest.
Funding
The authors disclosed receipt of the following financial support for the research, authorship and/or publication of this article: This work was supported by the Vice Chancellor of Research Affairs, Abadan University of Medical Sciences, Abadan, Iran (grant number 99T-724). The funder had no role in the data collection or writing of the manuscript. The results presented in this paper were part of a medical student thesis.
Supplemental material
Supplemental material for this article is available online.
References
Supplementary Material
Please find the following supplemental material available below.
For Open Access articles published under a Creative Commons License, all supplemental material carries the same license as the article it is associated with.
For non-Open Access articles published, all supplemental material carries a non-exclusive license, and permission requests for re-use of supplemental material or any part of supplemental material shall be sent directly to the copyright owner as specified in the copyright notice associated with the article.