
Abstract
Background:
There has been increasing evidence of the association between hyperuricemia and diabetes mellitus (DM). In the general population, hyperuricemia has been associated with pre-diabetes. In DM patients, hyperuricemia has been associated with poor outcomes.
Objectives:
The objective was to determine the proportion of hyperuricemia and associated factors among patients with type 2 DM in Mwanza, Tanzania.
Design:
This was a cross-sectional study.
Methods:
This study was conducted from January to March 2023 among patients with type 2 DM attending clinic at Bugando Medical Centre, Mwanza. Data was obtained from a structured questionnaire. Serum uric acid, HbA1c, lipid profile, and renal functions were analyzed. Analysis was done via STATA version 17. The primary outcome was the proportion of hyperuricemia among patients with type 2 DM, and logistic regression models were used to analyze associated factors.
Results:
Out of 360 patients, 59.7% were female. The median age was 61 years [IQR 57-68], and the median duration of DM was 5 years [IQR 3-9]. The mean HbA1c was 8.2 ± 2.5%, with 60% of patients having poor control. Most patients had hypertension (78.9%) and were overweight or obese (81.9%). The proportion of patients with DM and hyperuricemia was 44.4%, with mean serum uric acid levels among males and females of 410 ± 137 and 385 ± 119 µmol/L, respectively. We found that being female (P = .001), overweight (P = .021), or obese (P = .007), and having chronic kidney disease (P < .001) was associated with hyperuricemia among patients with type 2 DM.
Conclusion:
The burden of hyperuricemia among type 2 DM patients is quite high, and it is associated with female gender, high body mass index, lipids, and chronic kidney disease. This calls for regular screening of hyperuricemia in the population, and more studies are needed to establish the outcomes associated with hyperuricemia and create a treatment guideline.
Plain Language Summary
There has been association between high uric acid levels and diabetes, as high uric acid levels have been found in patients with early stages of diabetes, as well as related to complications and death. This study investigated 360 patients with diabetes and found that 44.4% had high uric acid levels. The study found that factors associated with high uric acid levels in patient with diabetes were females, overweight and obese patients, and patients with kidney disease.
Keywords
Introduction
Diabetes mellitus (DM), a group of metabolic disorders characterized by hyperglycemia due to insulin resistance, decreased insulin secretion, or increased production of glucagon, is one of the most common non-communicable diseases worldwide. 1 There are 4 forms of DM, and type 2 DM is characterized by pancreatic β-cell dysfunction with pre-existing insulin resistance. 1
The World Health Organization (WHO) estimates that there are 422 million adults living with DM, and about 1.5 million deaths annually are due to the disease. Currently, the prevalence of DM worldwide is estimated to be around 10.9%. 2 The prevalence is expected to increase, primarily due to the adaptation of a much more sedentary lifestyle and westernized diets. In Tanzania, the national prevalence is 10.3%, 2 with Mwanza having a prevalence of 11.9%. 3 These numbers will grow exponentially within the next 5 years. Despite lifestyle modification strategies and pharmacological therapy, attaining glycemic control, as well as minimizing complications such as retinopathy, nephropathy, and adverse cardiovascular events such as stroke and myocardial infarction, is quite difficult.
Uric acid, a purine metabolism product, is a non-traditional marker of DM. There has recently been increasing evidence of the association between serum uric acid and DM, though it is unclear. Hyperuricemia is often associated with established DM risk factors such as obesity, high fructose intake, and alcohol consumption, it is unclear whether it is merely a risk marker or an independent risk factor for DM. 4 In the general population, hyperuricemia is associated with pre-diabetes.5,6 In patients living with type 2 DM, hyperuricemia is associated with both disease progression and the development of complications. 4 There has also been evidence to support urate-lowering therapy in patients with DM in order to improve outcomes, such as an improvement in the estimated glomerular filtration rate (eGFR). 7
The relationship between serum uric acid and blood glucose is positive up to 8 mmol/L of blood glucose and inverse thereafter. 4 Additionally, there is a bell-shaped relationship between frequency of hyperuricemia and glycated hemoglobin (HbA1c) with a peak of 6%–6.9%. 8 And this relationship is due to glycosuria at elevated blood glucose level, which stimulates the urate transporter GLUT9 leading to increased uric acid excretion in urine. 9
Hyperuricemia has been shown to negatively affect DM. Some studies have shown that for every 0.1 mmol/L increase in serum uric acid from baseline, there is a 28% higher risk of developing adverse cardiovascular events. 10 In patients with DM and hyperuricemia, the prevalence of atrial fibrillation is much higher than in those with DM and normal serum uric acid levels, at 20.6% and 7.1%, respectively. 11
A study has shown a higher prevalence of hypouricemia than hyperuricemia in newly onset DM patients, 6 and the possible reasons could be due to uricosuric effect of glycosuria, hyperfiltration, low calorie intake, osmotic diuresis, and increase in extracellular volume. 4
Serum uric acid is not routinely tested in our setting, although it is an important marker of disease progression. Hyperuricemia has a negative impact on glycemic control, and leads to poor outcomes in patients. There are no recommended clinical guidelines on the treatment of asymptomatic hyperuricemia, both locally and globally. Exception being in Japan, where they recommend treatment of hyperuricemia at levels >476 µmol/L in the presence of complications such as DM and metabolic syndrome, and treatment at levels >535 µmol/L even in the absence of complications. 12
There is a paucity of data on the burden of hyperuricemia among patients with type 2 DM and its associated factors in Sub-Saharan Africa. Current practice does not include routine determination and monitoring of serum uric acid among patients with DM, despite hyperuricemia being associated with DM progression and its complications. Patients with DM are at risk of developing multiple complications with implications for both morbidity and mortality. The prevalence of DM in Mwanza is quite high, indicating poor control as well as poor outcomes. The objective of this study was to determine the proportion of hyperuricemia among adult patients with type 2 DM attending clinic at Bugando Medical Centre (BMC) in Mwanza, Tanzania.
Methods
This was a cross-sectional study that was carried out from January 2023 to March 2023. The study was conducted in the outpatient clinics of BMC, which is a tertiary care medical facility located in Mwanza, Northwestern Tanzania, and owned by the Episcopal Conference of the Catholic Bishops of Tanzania.
A minimum sample size for this study was estimated based on a study done in Kenya looking at the prevalence of hyperuricemia among DM patients. 13 Therefore, a hypothetical proportion of 19.3% was used to estimate the sample size by using the Leslie-Kish formular, N = (Z 2 p(100 − p))/(e 2 ). The estimated minimum sample size calculated was 359 patients. The study included all type 2 DM patients aged 18 and above, whether already on treatment or not, attending the medical outpatient clinic at BMC. Pregnant women and patients with confirmed malignancies that could result in tumor lysis syndrome were excluded.
The patients were informed of the procedure for information gathering, such as clinical history, anthropometric measurements, and collecting blood samples, before obtaining consent. Clinical data was entered into a designed questionnaire. The laboratory characteristics were then obtained from patient files using the electronic hospital management system and transferred to the questionnaire. A questionnaire was provided to patients to obtain data on a patient’s age, gender, marital status, level of education, duration of DM and medications the patients were on, existing co-morbidities such as hypertension and their respective management plan, and whether the patient is already on treatment for hyperuricemia. Patient weight and height measurements were used to calculate the body mass index, as excess clothing and clothing accessories were removed prior to measurement. Weight measurement was done using the RGZ-160 Health Scale (Jiangsu Suhong Medical Instruments Co. Ltd., Jiangsu Province, China). The same weight scale has a height scale mounted that was used to measure height. The body mass index (BMI) was then classified according to the WHO as underweight <18.5 kg/m2, normal 18.5 to 24.9 kg/m2, overweight ⩾ 25 kg/m2, and obese ⩾ 30 kg/m2. The blood pressure of the patients was measured using the ADView Suntech (Model 247B, Hauppauge, NY, USA). Two readings were obtained, 5 minutes apart, while the patient was in a sitting position, and their average was recorded.
Patients were in the sitting position, and veins were located in the antecubital fossa. Then, the researcher cleaned their hands, wore gloves, applied a tourniquet at about 6 cm from the puncture site, and disinfected the entry site with an alcohol swab. Then, using a 5 cc syringe, a puncture of the vein at a 30° angle to collect blood was done. This was equally divided into an EDTA vacutainer for the processing of HbA1c, and a plain vacutainer for serum uric acid, renal function test (RFT), and lipid profile. Serum uric acid and renal function tests were analyzed using the COBAS INTEGRA 400 Plus, from Roche Diagnostics, Switzerland. HbA1c was analyzed by the Tosoh Automated Glycohemoglobin Analyzer, HLC-723GX, from Tosoh India Pvt. Ltd. Hyperuricemia was defined as serum uric acid levels >450 µmol/L in males and >360 µmol/L in females. 14 Targets for HbA1c were in accordance with ADA recommendations, with a target of 7%, and that above 7% was classified as poor control. 1 For the RFT, the eGFR was calculated using the MDRD equation, and the patients with an eGFR below 60 were classified as having chronic kidney disease (CKD). Dyslipidemia was defined by an increase in either total cholesterol > 5.17 mmol/L, LDL cholesterol > 2.6 mmol/L, triglycerides > 1.7 mmol/L, or HDL < 1 mmol/L. 15
Data was double entered, verified, and cleaned using Microsoft Excel, and analysis was done using STATA version 17. Categorical variables, such as hyperuricemia, were described as proportions. Continuous variables such as BMI, age, serum uric acid, and HbA1c were expressed in means or medians. A univariate and multivariate logistic regression analysis was done to establish the factors associated with hyperuricemia, and a P level of significance was set at < .05, with a 95% confidence interval.
Results
Patients were screened between January and March 2023 at the BMC medical outpatient clinic. The total number of patients screened was 400, of whom 360 met the inclusion criteria and were enrolled. Twenty-five did not consent; 5 had been diagnosed with prostate cancer; 7 required inpatient care; hence, they were admitted; and 3 patients were underage.
The median age was 61 [IQR 57-68], and 61.9% were below 65 years. Among the total patients, 215 (59.7%) were female. Other baseline characteristics are described in Table 1.
Baseline and sociodemographic characteristics (n = 360).

The median duration of DM was 5 years [IQR 3-9], and 321 (89.2%) of patients were on oral hypoglycemic drugs. The majority of the patients, 282 (78.9%), also had hypertension, with a median SBP and DBP of 132 mmHg [IQR 120-146.5] and 77 mmHg [IQR 69-84], respectively. Only 18.1% of patients had a normal BMI, with 43.8% being overweight, and 38.1% being obese. Other clinical and physical characteristics are described in Table 2.
Baseline clinical and physical characteristics (n = 360).

Abbreviations: DBP, diastolic blood pressure; SBP, systolic blood pressure.
Among the enrolled patients, 216 (60%) had poorly controlled DM, with a mean HbA1c of 8.2 ± 2.5%. Most patients, 237 (65.8%), had an estimated eGFR of 60 ml/min/1.73 m 2 and above. Other laboratory characteristics are listed in Table 3.
Laboratory characteristics (n = 360).
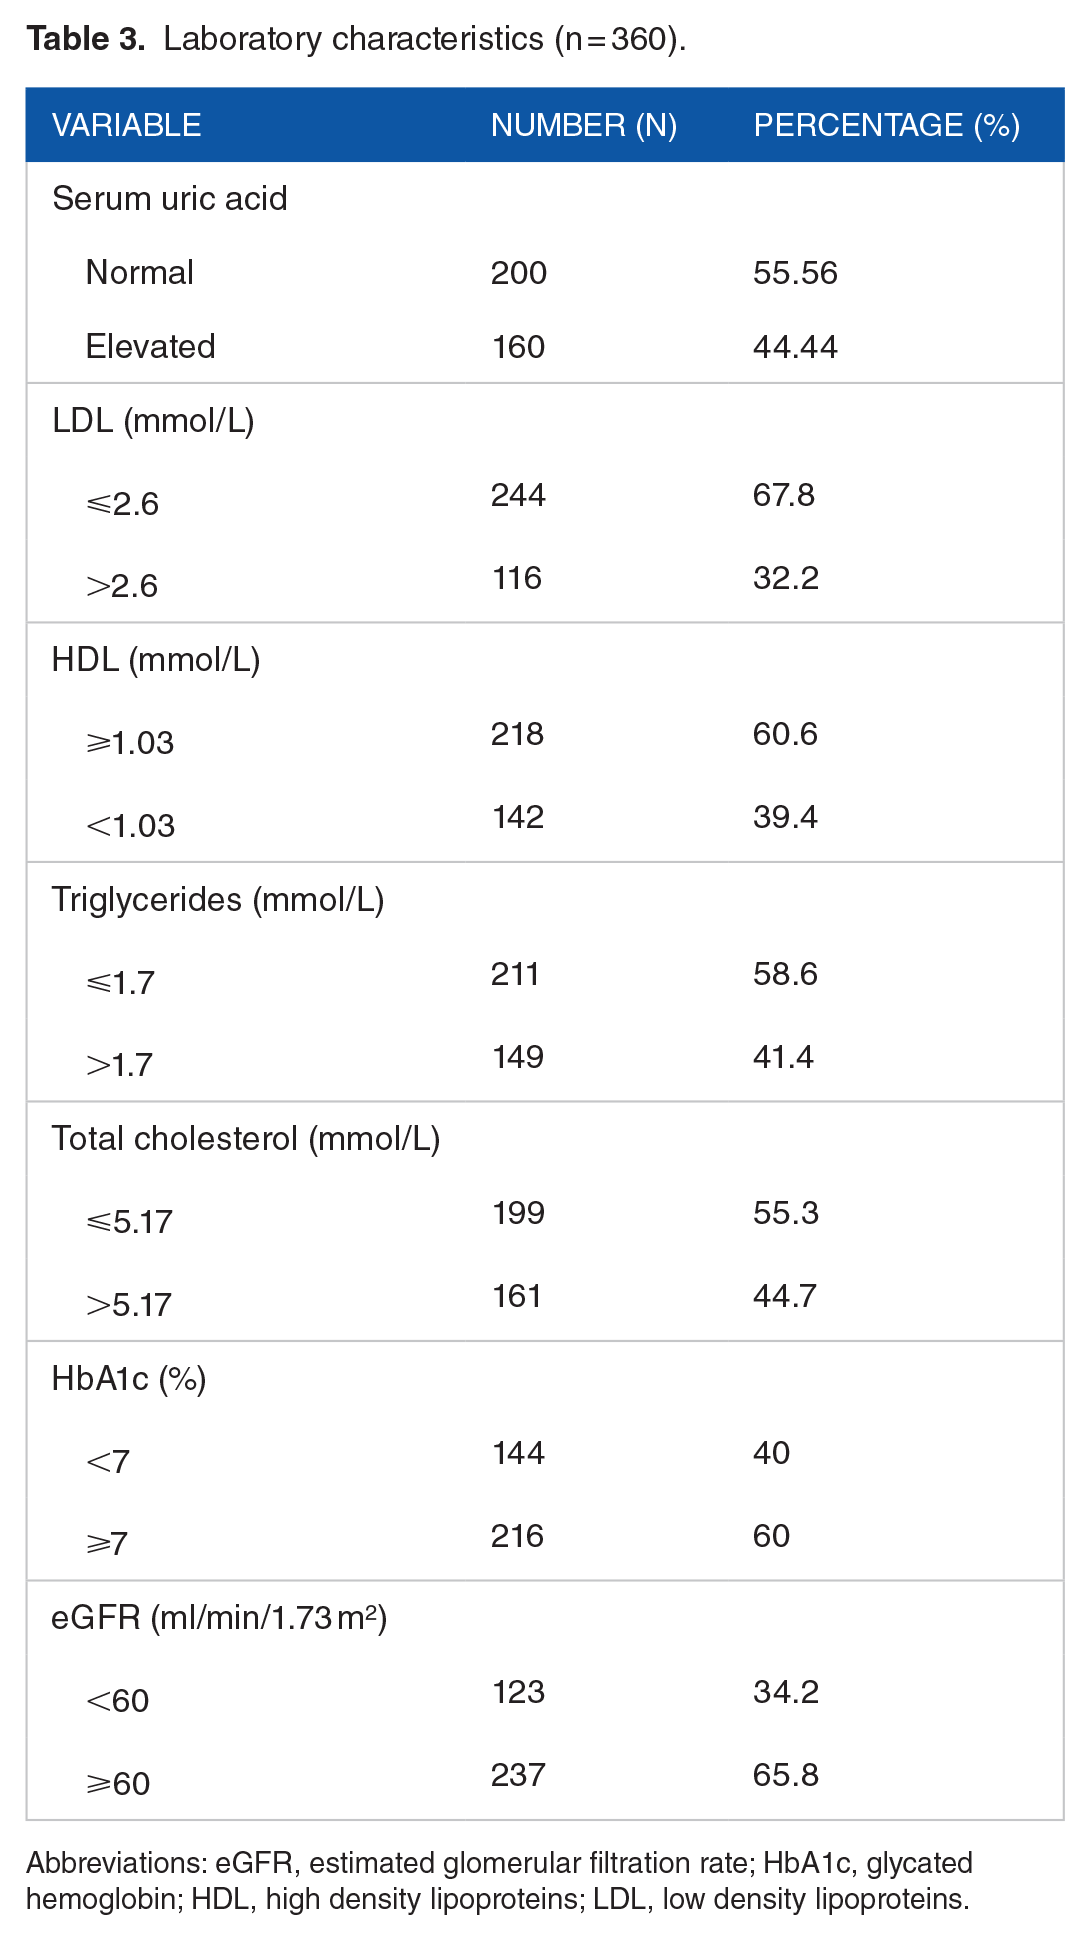
Abbreviations: eGFR, estimated glomerular filtration rate; HbA1c, glycated hemoglobin; HDL, high density lipoproteins; LDL, low density lipoproteins.
The proportion of hyperuricemia among the enrolled 360 diabetic patients was 44.4% (Figure 1), with a mean serum uric acid level of 410 ± 137 µmol/L among males, and 385 ± 119 µmol/L among females. Hyperuricemia was observed in women more than in men, and 46.4% (132) of patients with hyperuricemia had both DM and hypertension.

Proportion of patients with hyperuricemia (n = 360).
Female gender was associated with hyperuricemia (OR 2.0; 95% CI: 1.3-3.1; P = .003). Other factors that were significantly associated with hyperuricemia include BMI and CKD (Table 4). There was no association between age, glycemic control, or duration of DM.
Factors associated with hyperuricemia.

Abbreviations: DBP, Diastolic blood pressure; eGFR, estimated glomerular filtration rate; HbA1c, glycated hemoglobin; HDL, high density lipoproteins; LDL, low density lipoproteins; SBP, systolic blood pressure.
α Not computed due to 100% occurrence.
Not analyzed on multivariate analysis due to collinearity with Body Mass Index.
Discussion
The proportion of hyperuricemia among patients with type 2 DM was 44.4%. This is quite high in comparison to other countries, both globally and in Africa, where the prevalence ranges from 5.6% to 33.8%. The difference in magnitude may be attributed to many factors, including diet and exercise, genetics, geographical location, and weather, as well as different cut-off values for serum uric acid and exclusion criteria in different studies.
Apart from causing gout, hyperuricemia has been related to insulin resistance and diabetes. Studies have shown that the activation of inflammation induced by serum uric acid decreases insulin sensitivity, and infusion of serum uric acid in mice can increase TNF-α levels and activate the classical inflammatory pathway. 16 Excessive serum uric acid also leads to an increase in reactive oxygen species production bring about inflammation and dysfunction in the vessel, and oxidative stress could affect the expression of insulin gene, causing a decrease in insulin secretion. 17
In the study by Shokat et al 13 in Kenya, the prevalence of hyperuricemia was 19.3%. However, patients with CKD, dyslipidemia, and use of drugs that may lower serum uric acid levels were excluded. Additionally, they defined hyperuricemia uniformly among both males and females as 428 µmol/L, unlike our study, in which we used the standard definition. Woyesa et al 18 in Ethiopia reported a prevalence of hyperuricemia in DM of 33.8%, where they excluded patients on statin therapy. Fouad et al 19 in Egypt used a cut-off value for hyperuricemia at 416 µmol/L for both males and females, and also excluded patients on anti-proteinuric drugs. In Morocco, the prevalence was 26.5%. However, they recruited inpatients, which could have had an impact on the results. 20
Tanzania has a predominantly warm climate, with average temperatures of 27°C. 21 This could result in physiological stress and dehydration, all of which are associated with hyperuricemia, and this could explain why our prevalence is quite high. Kenya, Ethiopia, and Morocco have lower average temperatures. Kenya has an average mean annual temperature of 25.3°C 22 ; Morocco and Ethiopia have average annual temperatures of 21.7°C and 15.6°C, respectively.23,24 These differences in weather could result in our population having a higher prevalence in comparison to other countries.
There was an association between obesity and hyperuricemia in our study. The underlying mechanism is still unclear, as both overproduction and reduced excretion of uric acid in obesity have been reported. Fat cells in obese patients produce and secrete more uric acid leading to hyperuricemia due to high Xanthine oxidase activity in fat cells. 25 In obese patients, active fatty acid synthesis in fat cells leads to more de novo purine synthesis, hence hyperuricemia. 26 Reduced excretion of uric acid in obesity is due to hyperinsulinemia as it causes active uric acid reabsorption from kidney tubules. 25 Additionally, high fructose consumption in obesity also causes hyperuricemia. 27 In our study, the mean BMI was 29.2 kg/m2, with 58 (43.8%) and 137 (38.1%) patients being overweight and obese, respectively. Among participants with hyperuricemia, 73 (46.2%) were overweight, and 68 (49.6%) were obese. These findings are consistent with those from other studies. In Bangladesh, Ali et al 28 demonstrated that serum uric acid levels were independently associated with obesity. Similarly, in a study conducted at Jimma Medical Centre in Ethiopia, obesity was also a determinant of hyperuricemia in the diabetic population, with a mean BMI of 23.53 kg/m2. 29 This is in contrast to the study done in Kenya, where, despite the majority of the subjects being overweight or obese; there was no statistically significant association. 13
In this study, there was a statistically significant association with the female gender. This is contrary to the general population, where males are more likely to have hyperuricemia and gout. Our study recruited more females at 215 (59.7%) than males at 145 (40.3%). Additionally, the females recruited were post-menopausal; this can result in the loss of the protective effects of estrogen, which promotes renal clearance of uric acid. The majority of the females had a high BMI, with 83 (38.6%) being overweight and 100 (46.51%) being obese, and given the association between hyperuricemia and obesity, this may explain why females are prone to hyperuricemia. The association with gender in other studies of hyperuricemia in the DM population has been variable. In the studies done in Kenya, Morocco, and Bangladesh, there was a positive association with the female gender as well.13,20,28 However, in India, there was a positive association with male gender, and this is attributed to the fact that they enrolled a higher number of males, and reported higher numbers of pre-menopausal females. 30
The mean eGFR of patients was 68.1 ml/min/1.73 m 2 . Most patients (65.8%) had an eGFR above 60 ml/min/1.73 m 2 , with only 34.2% having CKD as defined in our study. Results from our study demonstrated that there is a statistically significant association between hyperuricemia and CKD. The kidneys clear uric acid; hence, in patients with CKD, reduced clearance of uric acid is expected, which results in elevated serum uric acid. This is similar to most other studies. In Japan, Ito et al 31 found hyperuricemia to be a predictor of both coronary heart disease and renal dysfunction. In Morocco, Fennoun et al 20 also had similar results where hyperuricemia in the DM population was associated with CKD, while in Egypt, Fouad et al 19 demonstrated that hyperuricemia might identify early nephropathy, CKD progression, and even the onset of hypertension.
The glycemic control in our population is still poor, with the majority of patients not meeting the target requirement for HbA1c. In this study, 216 (60%) had HbA1c levels above 7.5%, and the mean HbA1c was 8.2 ± 2.5%. Among patients with hyperuricemia, 93 (43.1%) had poor glycemic control. The association between hyperuricemia and glycemic control is variable. In patients with type 2 DM, there is hyperinsulinemia, which promotes uric acid reabsorption in the proximal convoluted tubule. However, this holds true only below the renal threshold for glucose. In patients with hyperglycemia beyond the renal threshold of glucose (10 mmol/L), osmotic diuresis occurs, resulting in the excretion of uric acid and glucose, and normal serum uric acid. In our study, we failed to obtain a significant association between hyperuricemia and poor glycemic control. This may be due to our mean HbA1c being high, at around 10.9 mmol/L following conversion, which is above the normal renal threshold for glucose, which may have resulted in osmotic diuresis in our patients. This is similar to the study done in Kenya, 13 where there was also no association between hyperuricemia and glycemic control. In a study that was done in Cameroon, there was a positive association between hyperuricemia and HbA1c; however, they had a small sample size, and they excluded patients who were not on treatment and had fasting blood glucose ⩾ 7 mmol/L or random blood glucose ⩾ 10 mmol/L 3 months prior to the study. 32
The limitations of this study were that, since this was a cross-sectional study, a causal-effect relationship could not be established. Additionally, this was a single left study, and these results may not reflect the general population. Power analysis was not performed to calculate the estimated sample size. The questionnaire for this study was not validated or pilot-tested. Data concerning patient diet, alcohol use, and smoking habits was obtained from the patients themselves, which may have resulted in recall bias.
Conclusion
The burden of hyperuricemia among patients with type 2 DM is quite high, and it is associated with female gender, high BMI, elevated total cholesterol, elevated triglyceride, and CKD. This calls for regular screening of hyperuricemia in this population, as well as more studies dedicated to establishing the outcomes associated with hyperuricemia in order to come up with guidelines on the approach to treatment. Implementation of strategies to improve BMI among patients is advised, given that most patients were overweight or obese.
Footnotes
Acknowledgements
We thank the patients and the staff for their co-operation during this study period.