
Abstract
Cardiac hemodynamic assessment during cardiopulmonary exercise testing (CPET) is proposed to play an important role in the clinical evaluation of individuals with cystic fibrosis (CF). Cardiac catheterization is not practical for routine clinical CPET. Use of oxygen pulse (O2pulse) as a noninvasive estimate of stroke volume (SV) has not been validated in CF. This study tested the hypothesis that peak exercise O2pulse is a valid estimate of SV in CF. Measurements of SV via the acetylene rebreathe technique were acquired at baseline and peak exercise in 17 mild-to-moderate severity adult CF and 25 age-matched healthy adults. We calculated
Introduction
Individuals with cystic fibrosis (CF) demonstrate a lethal cascade of events involving sodium (Na+) and chloride (Cl−) ion channel dysregulation underpinned by mutations of the gene encoding the CF transmembrane regulator (CFTR) protein.1,2 Closely following is a hallmark airway obstruction phenotype.1–3 These pulmonary-centric features of CF are potent contributors to impaired peak oxygen uptake
By contrast, there is a separate line of evidence from studies of CF involving cardiopulmonary exercise testing (CPET) and/or exercise training suggesting this disease also affects cardiac function.5–10 Individuals with CF have been observed to demonstrate an impaired cardiac hemodynamic response to increased metabolic demand, which, in part, precipitates exercise intolerance and contributes to poor prognosis.5–10 Unfortunately, however, it has been a challenge to routinely test the exact role impaired exercise cardiac hemodynamics play in CF. Clinical exercise physiology research involving individuals with CF and invasive measurement of cardiac output
Although noninvasive echocardiography is an established clinical diagnostic tool useful for assessing exercise cardiac hemodynamics, it is also physiologically relevant that the recommended body position to acquire images for the derivation of Q̇ and SV is supine.
11
By contrast, optimal CPET posture to acquire key prognostic measurements such as
In contrast to inspired and expired O2 and CO2 gases commonly measured during CPET, inert gas such as acetylene (C2H2) is nonphysiological and demonstrates low affinity for hemoglobin.14–16 Still, because of its robust Bunsen solubility coefficient in blood, C2H2 is a perfusion sensitive gas.14–16 Laboratory techniques based on the principle that there is rapid uptake of inspired inert gas within the pulmonary circulation have been validated for use at rest as well as during exercise for the measurement of Q̇ and SV in adults with or without advanced cardiopulmonary disease (eg, pulmonary hypertension).17–21
Alternatively, it has also been shown that when
Therefore, this study tested the hypothesis that peak exercise O2pulse is a valid estimate of SV acquired via the C2H2 gas pulmonary uptake technique in young adults with modest-to-moderate severity CF.
Methods
This study is a subanalysis of the original study reported in Van Iterson et al. 5 However, data as they pertain to this study hypothesis have not been previously reported. All aspects of this study were reviewed and approved by the University of Arizona Institutional Review Board. All individuals included in this study provided voluntary written informed consent prior to study participation.
In brief, 17 young adults with mild-to-moderate severity CF and a convenience sample of 25 healthy young adults serving as controls participated in this study. Study inclusion criteria for CF required confirmation of a positive Cl− sweat test (⩾60 mM/L Cl−) and presence of at least one copy of the ∆F508-CFTR mutation (71% in this study were homozygous for ΔF508-CFTR). Individuals with CF interested in this study were excluded from participation for any of the following reasons: (1) experienced a pulmonary exacerbation within the last 2 weeks or pulmonary hemorrhage within 6 months resulting in greater than 50 cm 3 of blood in the sputum, (2) taking any antibiotics for pulmonary exacerbation, or (3) taking any experimental drugs related to CF. Exclusion criteria for any participant included (1) medical records demonstrating the diagnoses of hypertension, cardiac and/or vascular disease, metabolic disease (including diabetes), orthopedic disease, or other diseases affecting the neuromuscular system; (2) currently smoking or history of smoking, or (3) those who were not able to engage in exercise (eg, known orthopedic limitations or musculoskeletal disorders).
Eligible and enrolled participants performed testing on a single day. Participants were asked to avoid engaging in exercise (other than physical activity associated with tasks of daily living) 24 hours prior to a study visit. We also asked that participants avoid caffeine ingestion for at least 8 hours leading up to a study visit.
Overview
Briefly, after arriving to our human physiology laboratory and providing voluntary written informed consent, basic measurements of body anthropometry were performed on participants. This included measurements of height and body weight (not corrected for fat-free mass), which were used to calculated body surface area (BSA) as, 0.024265 × W0.5378 × H0.3964. 28 Following, participants performed flow volume loop spirometry (CPFS/D spirometer; MGC Diagnostics, St. Paul, MN, USA) in the upright seated position according to guidelines of the American Thoracic Society. 29 Measurements acquired included forced vital capacity (FVC) and forced expiratory volume in 1 second (FEV1), whereby the FEV1/FVC ratio was calculated. For each of these parameters, we calculated percent of predicted values using equations of Hankinson et al. 30 After being given the opportunity to rest for at least 30 minutes following airway function testing, participants finally performed CPET.
Cardiopulmonary exercise testing
In an environmentally controlled human physiology laboratory, incremental stepwise CPET to volitional fatigue was performed by participants in the upright seated position on a cycle ergometer (Corival Lode B.V., Groningen, Netherlands).5,31 To accommodate the time needed for measurements performed for this study (ie, SV, described below), the CPET protocol instituted for this study was a modified version of that reported by others. 31 Each CPET stage was 3 minutes in length, whereas workload in watts (W) was individualized based on participant physical activity history (questionnaire) and body size (range: 15-40 W/stage).5,31 An excellent effort and achievement of peak exercise was defined as a rating of perceived exertion (RPE; Borg scale 6 to 20) ⩾17 and reaching a respiratory exchange ratio (RER) ⩾1.10.4,12,13
Oxygen saturation (Sa
Absolute values for
C2H2 gas pulmonary uptake technique
Measurements of SV via the C2H2 gas pulmonary uptake technique occurred in temporal alignment with periods used to acquire breath-by-breath and HR data at both rest and peak exercise. A full description of the C2H2 gas pulmonary uptake rebreathe technique has been reported previously.5,20,33
Briefly, the apparatus from which participants respired through during the C2H2 gas pulmonary uptake maneuver included a mouthpiece attached to a pneumotachometer (Hans Rudolph, Kansas City, MO, USA), which was connected to a nonrebreathing Y valve (Hans Rudolph). The inspiratory port of the Y valve was interconnected to a pneumatic sliding switch valve allowing for rapid change between open-circuit room air and a hanging rebreathe bag containing the C2H2 gas mixture (described below). Placed within the pneumotachometer exposed to inspiratory and expiratory flows was a gas sampling line, which was connected on the other end to a mass spectrometer (Perkin Elmer MGA-1100, Wesley, MA, USA) for continuous breath-by-breath gas fraction sampling. Gas sampling via mass spectrometry was integrated with a PC and custom analysis software for the determination of Q̇ and SV.5,20,33
For a given Q̇ and SV measurement, the gas mix containing C2H2 was respired during a 8- to 10-breath period from a 5-L anesthesia rebreathe bag (Hans Rudolph), which contained 1 to 3 L of total gas comprising 0.65% C2H2, 9% helium (He), balance N2, and 35% O2 depending on an initial tidal volume for a given participant as well as exercise intensity (i.e., to promote nearly complete emptying of the rebreathe bag in the absence of bag collapse). Participants were immediately switched out of respiring from the rebreathe bag following a given C2H2 uptake maneuver back into room air breathing.
Compared with the blood insoluble He gas, C2H2 gas demonstrates not only high blood solubility but also low affinity for hemoglobin.5,20,33 Therefore, uptake of inspired C2H2 gas within pulmonary capillary blood occurs rapidly and also readily washes out of the circulation during subsequent expiration in the absence of high levels of recirculation. Accordingly, with concurrent measurements of HR, and because of the unique gas properties of both He and C2H2 gases, the breath-by-breath slope of the exponential end-tidal decrease in C2H2 concentration with respect to that of He gas can be used to quantify beat-to-beat pulmonary blood flow and, hence, SV.5,20,33
The quotient of
Statistical analyses
Data are presented as mean ± SEM or otherwise noted. Where appropriate, between-group differences were assessed using Wilcoxon rank sum or χ2 tests for continuous or categorical data, respectively.
The following statistical routines were used to test the validity of O2pulse (or CO2pulse) as an estimate of SV38,39: (1) univariate least squares linear regressions were performed separately for comparisons involving SV via the C2H2 uptake technique (dependent and criterion method) and O2pulse (or CO2pulse) (independent and practical method) at time periods of baseline and peak exercise; (2) output parameters from each linear regression (ie, calibration equation in the form of, y = mx + b, and coefficient of determination [R2]) were used to determine validity as the standard error of estimate (SEE) variable equal to, SD × √(1 − R2), accompanied by 95% confidence limits, where SD is the standard deviation of dependent variable values from respective calibration equations; and finally (3) the distribution of residuals (criterion SV minus predicted SV) relative to predicted SV (computed using O2pulse and calibration equations) were plotted.38,39
Correlation coefficients (r) from Pearson product moment tests were used to assess relationships between SV measurements using the C2H2 uptake technique vs O2pulse (or CO2pulse) at both baseline and peak exercise. Strength of a given r value was interpreted based on thresholds of Cohen 40 : small = 0.10, medium = 0.30, and large ⩾ 0.50, power ⩾ 0.80. We tested between-group differences for r values using Fisher r-to-z transformations and computing respective Fisher Z tests to obtain P values. 40 Two-tailed significance was determined using an α level set at .05. All computations were performed using SAS statistical software (v.9.4.; SAS Institute, Cary, NC, USA).
Results
Baseline characteristics
There were no differences for age (27 ± 2 vs 23 ± 2 years, P = .17) and percentage of men participants (60% vs 76%, P = .27) between healthy controls and CF, respectively. Alternatively, compared with controls, height (174 ± 2 vs 168 ± 2 cm, P = .04), weight (72 ± 3 vs 62 ± 3 kg, P = .01), and BSA (1.86 ± 0.04 vs 1.73 ± 0.05 m2, P = .01) were reduced in CF, respectively. Measurements of resting FVC (4.8 ± 0.2 vs 3.6 ± 0.3 L and %predicted 96% ± 2% vs 80% ± 5%, both P < .01), FEV1 (3.8 ± 0.2 vs 2.6 ± 0.2 L and %predicted 94% ± 35 vs 69% ± 6%, both P < .01), and the FEV1/FVC ratio (0.82 ± 0.02 vs 0.72 ± 0.03 and %predicted 98% ± 2% vs 86% ± 4%, both P < .01) were also all greater in controls compared with CF, respectively. Participants of both groups in this study completed all aspects of testing as described and in the absence of experiencing adverse events.
Cardiopulmonary exercise testing
For the baseline period immediately preceding the exercise on-transition, there were no group differences for
Workload (power) achieved (2.57 ± 0.16 vs 1.64 ± 0.14 W/kg, P < .01) at peak exercise by participants per kilogram of body weight was greater in controls compared with CF, respectively. Peak exercise RPE (18 ± 0 vs 17 ± 0) and RER (1.11 ± 0.02 vs 1.11 ± 0.01) did not differ between controls and CF (both P > .05), respectively. In contrast to baseline, peak exercise responses across
Cardiac hemodynamics and estimates
Baseline Q̇ (5.5 ± 0.4 vs 4.8 ± 0.4 L/min), Q̇ index (3.1 ± 0.2 vs 2.6 ± 0.2 L/min/m2), O2pulse (5.3 ± 0.3 vs 4.7 ± 0.5 mL/beat), O2pulse index (2.87 ± 0.15 vs 2.68 ± 0.23 mL/beat/m2), CO2pulse (4.2 ± 0.2 vs 4.2 ± 0.4 mL/beat), and CO2pulse index (2.30 ± 0.13 vs 2.37 ± 0.18 mL/beat/m2) did not differ between controls and CF (all P > .05), respectively. However, SV (70 ± 4 vs 54 ± 5 mL) and SV index (40 ± 3 vs 31 ± 3 mL/m2) were greater in controls compared with CF (both P < .05, respectively).
In contrast to baseline, compared with controls, peak exercise Q̇ (16.5 ± 0.4 vs 11.9 ± 0.9 L/min), Q̇ index (9.1 ± 0.3 vs 6.7 ± 0.5 L/min/m2), SV (94 ± 4 vs 78 ± 5 mL), O2pulse (13.1 ± 0.7 vs 9.3 ± 0.8 mL/beat), O2pulse index (7.08 ± 0.31 vs 5.38 ± 0.43 mL/beat/m2), CO2pulse (14.6 ± 0.7 vs 10.4 ± 0.9 mL/beat), and CO2pulse index (7.88 ± 0.34 vs 5.97 ± 0.48 mL/beat/m2) were reduced in CF (all P < .05). However, SV index (51 ± 2 vs 45 ± 3 mL/m2) did not differ between controls and CF (P = .11), respectively.
Correlations and validity
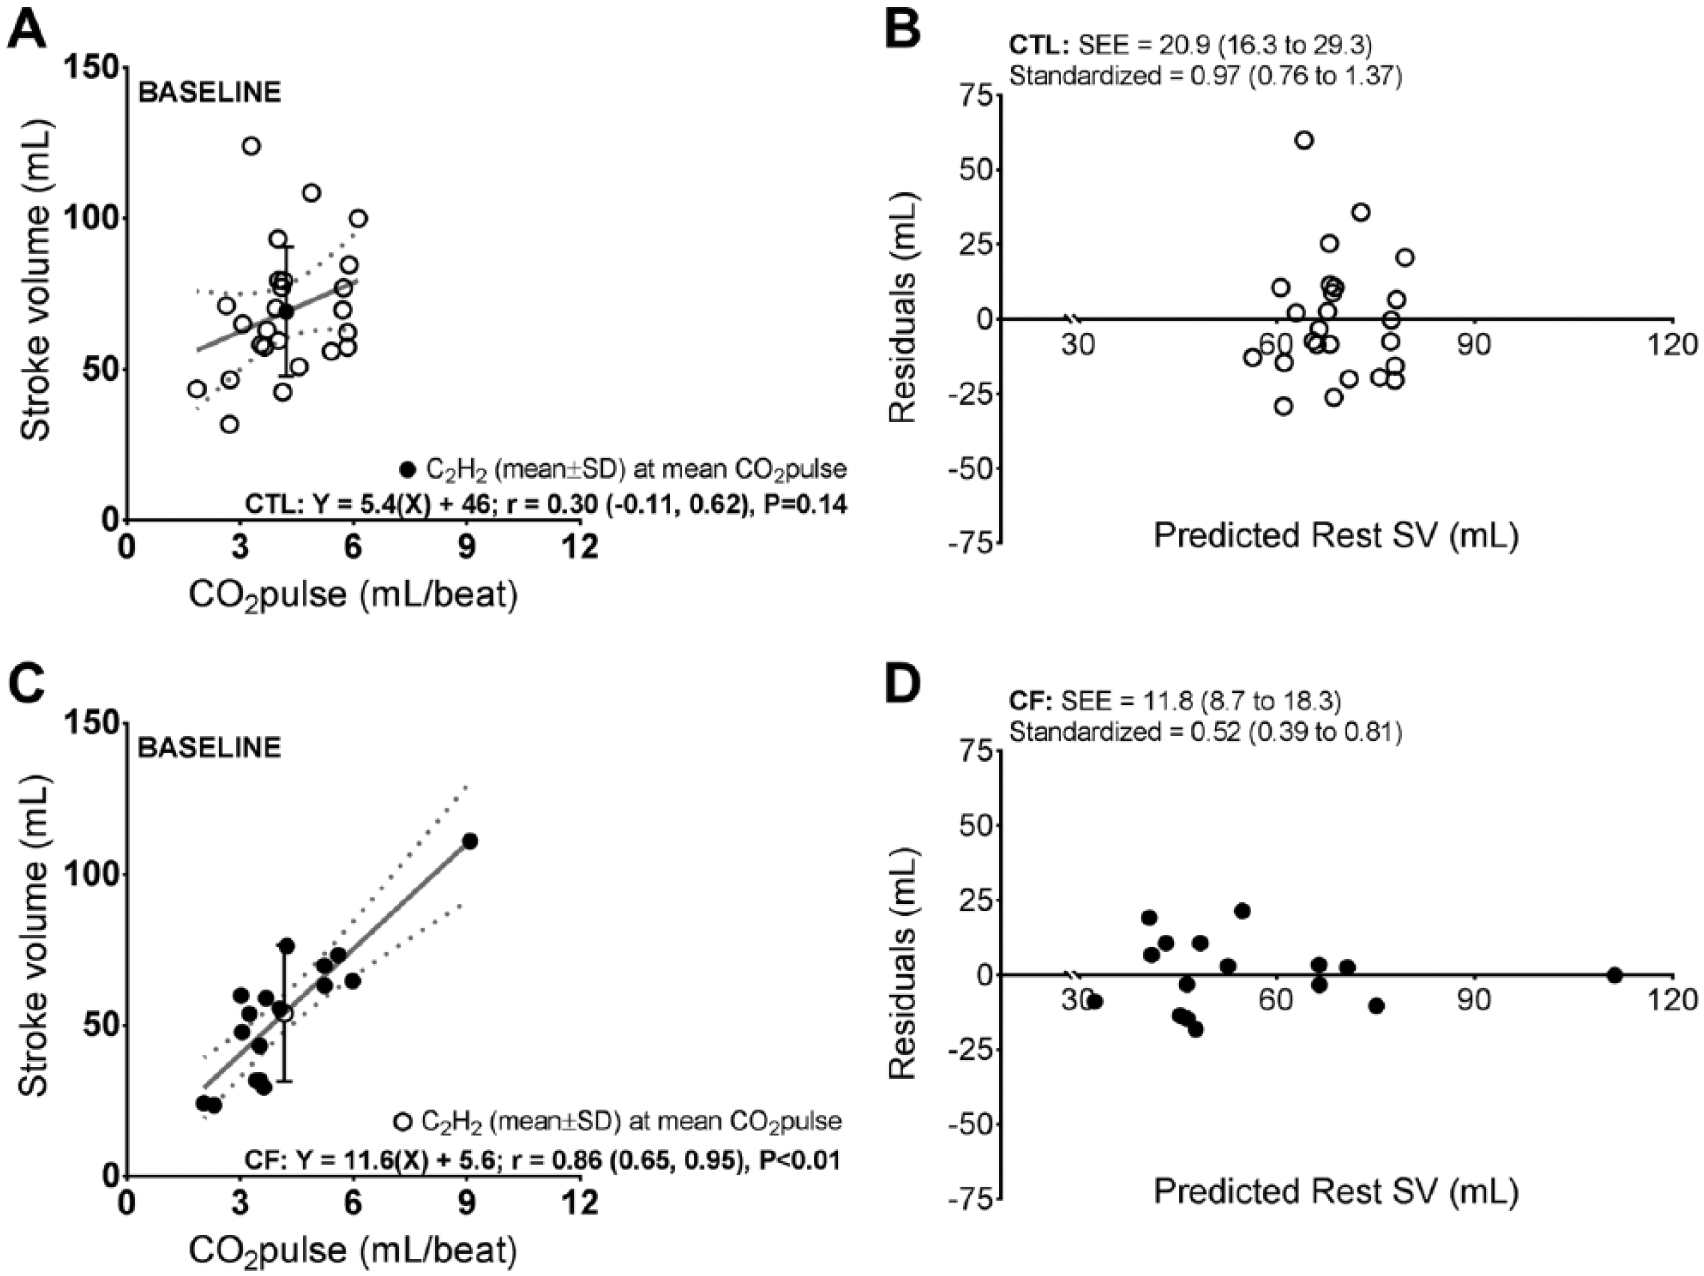
Baseline correlations in Figure 1 between SV and O2pulse for both controls and CF were significant. However, compared with controls, r was stronger in CF (P = .05). The difference in baseline r between controls and CF did not persist to peak exercise (P = .58) as both groups demonstrated correlations that were significant and similar in magnitude.

Correlations and validity between stroke volume (SV) assessed via the acetylene (C2H2) pulmonary uptake technique (criterion method) and oxygen pulse (O2pulse) (practical method) at baseline in healthy controls (CTL) and individuals with cystic fibrosis (CF). Panels (A) and (C): solid gray line and dotted gray lines (lower and upper 95% confidence limits [CLs]) represent the line of best fit for respective regressions. Correlation coefficient (r) is presented with lower and upper 95% CLs. Interpretation of r values: small = 0.10, medium = 0.30, and large ⩾ 0.50, power ⩾ 0.80. Panels (B) and (D): regressions (ie, calibration equations) from panels (A) and (C), respectively, were used to calculate predicted SV. Residuals = criterion SV minus predicted SV. Validity is represented by the standard error of estimate (SEE, with lower and upper 95% CLs) variable.
Correlations between SV and CO2pulse illustrated in Figures 3 and 4 generally mirrored respective O2pulse counterparts in Figures 1 and 2, with the exception of the baseline correlation in controls, which was not significant. Similar to Figure 1, the correlation between baseline SV and CO2pulse was also weaker controls compared with CF (P < .01). However, SV and CO2pulse correlations at peak exercise did not differ between groups (P = .73).

Correlations and validity between stroke volume (SV) assessed via the acetylene (C2H2) pulmonary uptake technique (criterion method) and oxygen pulse (O2pulse) (practical method) at peak exercise in healthy controls (CTL) and individuals with cystic fibrosis (CF). Panels (A) and (C): solid gray line and dotted gray lines (lower and upper 95% confidence limits [CLs]) represent the line of best fit for respective regressions. Correlation coefficient (r) is presented with lower and upper 95% CLs. Interpretation of r values: small = 0.10, medium = 0.30, and large ⩾ 0.50, power ⩾ 0.80. Panels (B) and (D): regressions (ie, calibration equations) from panels (A) and (C), respectively, were used to calculate predicted SV. Residuals = criterion SV minus predicted SV. Validity is represented by the standard error of estimate (SEE, with lower and upper 95% CLs) variable.
Accompanying correlations in Figures 1 to 4 are respective values for SEE (absolute and standardized). Consistent with correlations showing increasing strength from baseline to peak exercise for controls, SEE lessened in size while improving the distribution of residuals over the range of predicted SV values for this same time course. Although baseline to peak exercise SEE improvements were not observed for CF, SEE values for these individuals at both time points in Figures 1 to 4 remained within limits observed for healthy controls. Moreover, the nearly even distribution of residuals over the range of predicted SV for CF was mirrored across baseline and peak exercise. Finally, for both groups at each time point, Figures 1 to 4 illustrate that predicted SV using either O2pulse or CO2pulse could be expected to remain within ±1 SD of measured SV with an approximate magnitude of over- or underestimation consistently <20 mL (absolute) or <0.5 mL (standardized).
Correlations and validity between stroke volume (SV) assessed via the acetylene (C2H2) pulmonary uptake technique (criterion method) and carbon dioxide output pulse (CO2pulse) (practical method) at baseline in healthy controls (CTL) and individuals with cystic fibrosis (CF). Panels (A) and (C): solid gray line and dotted gray lines (lower and upper 95% confidence limits [CLs]) represent the line of best fit for respective regressions. Correlation coefficient (r) is presented with lower and upper 95% CLs. Interpretation of r values: small = 0.10, medium = 0.30, and large ⩾ 0.50, power ⩾ 0.80. Panels (B) and (D): regressions (ie, calibration equations) from panels (A) and (C), respectively, were used to calculate predicted SV. Residuals = criterion SV minus predicted SV. Validity is represented by the standard error of estimate (SEE, with lower and upper 95% CLs) variable.
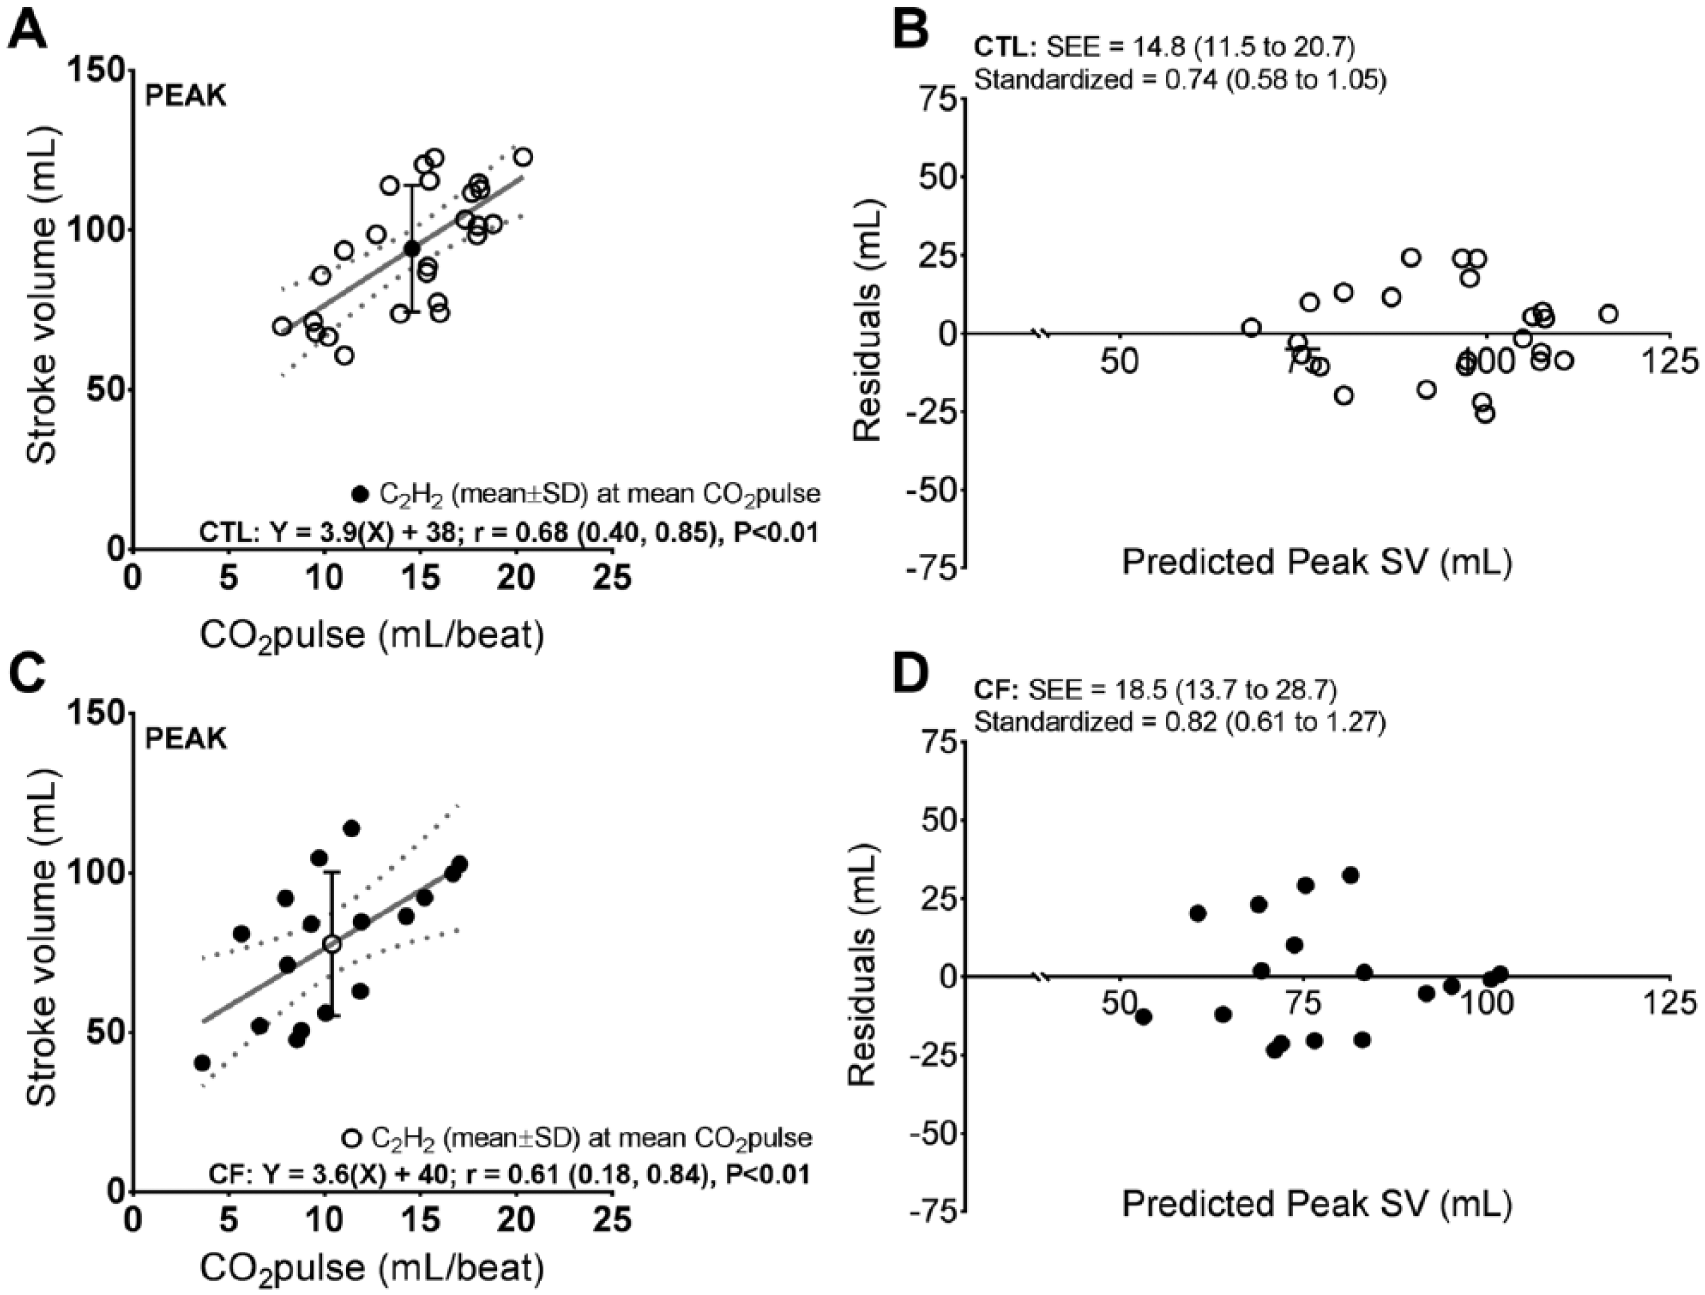
Correlations and validity between stroke volume (SV) assessed via the acetylene (C2H2) pulmonary uptake technique (criterion method) and carbon dioxide output pulse (CO2pulse) (practical method) at peak exercise in healthy controls (CTL) and individuals with cystic fibrosis (CF). Panels (A) and (C): solid gray line and dotted gray lines (lower and upper 95% confidence limits [CLs]) represent the line of best fit for respective regressions. Correlation coefficient (r) is presented with lower and upper 95% CLs. Interpretation of r values: small = 0.10, medium = 0.30, and large ⩾ 0.50, power ⩾ 0.80. Panels (B) and (D): regressions (ie, calibration equations) from panels (A) and (C), respectively, were used to calculate predicted SV. Residuals = criterion SV minus predicted SV. Validity is represented by the standard error of estimate (SEE, with lower and upper 95% CLs) variable.
Discussion
The present observations support our hypothesis that peak exercise O2pulse is a valid estimate of SV in young adults with modest-to-moderate severity CF. Although CF is traditionally identified as a disease having a severe impact on airway function, these data are consistent with those of other studies involving adults with or without cardiac and/or pulmonary disease, for whom O2pulse has been reported to demonstrate close agreement with SV.22–25 Separate studies consistent with the present have also shown that the C2H2 gas pulmonary uptake technique provides a valid means to assess Q̇ in adults with advanced chronic pulmonary disease (eg, pulmonary hypertension). 17
Because of the proposed role that cardiac dysfunction plays in contributing to exercise intolerance and poor prognosis in CF,5–10,27 another important aspect of this study is we included methodology and resources that are immediately clinically translational. Most medical centers with the advanced infrastructure and expert personnel available to provide care for individuals with CF are also likely to have CPET facilities. Accordingly, the application of O2pulse as an estimate of SV can be used as a tool to strengthen the ability to interpret CPET in adult CF. Perhaps with greater utilization over time, O2pulse may also demonstrate usefulness as a key prognostic indicator in CF similar to what has been reported for other patient groups.41–44 This study addressed a need-based practical knowledge gap in adult CF by highlighting there are safe, noninvasive, and accessible ways in which SV can be closely estimated during CPET. The addition of O2pulse and/or SV (via C2H2 uptake) measurements to routine clinical CPET can be expected to advance our understanding of cardiac contributions to exercise limitations in CF.
Despite the absence of performing direct measurements of ventilation-perfusion matching or magnitude/distribution of airway recruitment, we suggest that participant responses across SV, O2pulse, CO2pulse, PETC
These data are also compatible with those of Hoeper et al, 17 who in an earlier study involving adults with mild-to-severe pulmonary hypertension reported Q̇ measurements using the C2H2 gas pulmonary uptake technique demonstrated clinically acceptable agreement with Q̇ measurements acquired using the direct Fick method. Equally noteworthy, measurements acquired in Hoeper et al 17 occurred as patients rested. This is of practical relevance because efficacy of the C2H2 gas pulmonary uptake technique is highly dependent on alveolar recruitment.20,33 This suggests that even at rest where there is less alveolar recruitment compared with exercise, 49 the inert gas pulmonary uptake approach provides a valid means to assess SV in patients with obstructive pulmonary disease who are also at high risk for diffusion impairment (eg, due to alveolar and/or interstitial edema).17,50 The observations of Hoeper et al 17 have since been replicated by Saur and colleagues19,21 who used the nitrous oxide gas pulmonary uptake method (ie, inert gas with blood solubility less than C2H2) compared with cardiac magnetic resonance imaging to assess resting Q̇ across a spectrum of patients with advanced pulmonary disease including both obstructive and restrictive classifications.
Although this is the first study to test relationships between O2pulse and SV during CPET in adult CF, we are not the first to report on O2pulse as an indirect means to suggest that the SV response to exercise is impaired in this population. In an earlier study, Gruber et al
9
reported young adults with CF demonstrate impaired exercise
While it is plausible that widening of the arteriovenous O2 content gradient may have driven the training benefit previously observed for exercise O2pulse in CF,
9
we suggest that this is unlikely because in the steady-state condition (ie, submaximal exercise), the arteriovenous O2 content gradient is expected to be invariable, and most of the rise in O2pulse from the rest to submaximal exercise transition is commensurate with changes that occur in SV.
51
Again, the effect of training on
Limitations
To benefit the wide-scale translation of these data across CF in the real world, it is necessary to test the present hypothesis in CF demonstrating a broader spectrum of disease severity and age. Still, the encouraging nature of these data acquired in young adults with modest-to-moderate severity CF provides support to warrant such a follow-up study. Separately, we also acknowledge that performing concurrent cardiac catheterization studies would have strengthened the interpretability of these data. However, as noted above, the practicality and feasibility of performing exercise cardiac catheterization for research in CF is unrealistic. Cardiac catheterization is also not a practice that can be deployed for routine clinical CPET in CF.
Along with the impact that severe pulmonary disease due to obstruction, fibrosis, etc, may have on the accuracy of inert gas uptake techniques for the measurement of Q̇ and SV, such pulmonary factors could also be expected to affect O2 transport and, hence, the validity of O2pulse. Accordingly, for those and other possible reasons (eg, chronotropic incompetence or other arrhythmias), 54 we recognize that O2pulse is imperfect and should not be instituted as a replacement for SV when direct measurements of cardiac hemodynamics are warranted to guide advanced clinical decision making (eg, need for mechanical circulatory support and/or heart transplantation). Instead, we propose O2pulse, similar to SV via the C2H2 gas pulmonary uptake technique, can be useful when deployed as a routine screening tool during the interpretation of clinical CPET to assess whether cardiac limitations may be present, necessitating the need for advanced follow-up diagnostic testing.
Conclusions
The present observations suggest that O2pulse provides a valid means to estimate SV at peak exercise in young adults with mild-to-moderate severity CF. These data are immediately clinically translational because O2pulse is a parameter that can be safely and easily assessed during CPET in these individuals. The routine acquisition of O2pulse during CPET can be expected to improve and advance our knowledge of what role cardiac dysfunction plays in limiting exercise in CF.
Footnotes
Acknowledgements
The authors thank the individuals who participated in this study.
Declaration of conflicting interests:
The author(s) declared no potential conflicts of interest with respect to the research, authorship, and/or publication of this article.
Funding:
The author(s) disclosed receipt of the following financial support for the research, authorship and/or publication of this article: This research was supported by the National Institutes of Health (HL108962 to EMS).
Author Contributions
Conception and design: EMS and WJM. Acquisition of data: EMS, CMW, and SEB. Analysis and interpretation: EHV and EMS. Drafting the article for important intellectual content: EHV, EMS, TPO, CMW, SEB, and WJM. All authors contributed to the intellectual content of the manuscript and were consulted for final approval of the submitted version.