
Abstract
Objectives:
To assess ventilatory efficiency and aerobic capacity in people with multiple sclerosis and whether treadmill walking or progressive strength training has an effect on these parameters in this population.
Methods:
In all, 24 adults with multiple sclerosis with an Expanded Disability Status Scale score of ≤6 completed a cardiopulmonary exercise test before and after 8 weeks of exercise. They were randomized to treadmill walking of low-to-moderate intensity (50%–70% of peak heart rate) or progressive strength training (six repetitions × two at 80% of one repetition maximum). Both groups exercised for 30 min three times per week. Primary outcome measure was ventilatory efficiency measured as the minute ventilation/carbon dioxide production (VE/VCO2) ratio and oxygen uptake efficiency slope. Secondary outcome was aerobic capacity, measured as peak oxygen uptake (VO2peak).
Results:
Despite low aerobic capacity, ventilatory efficiency was found to be within normal range. After 8 weeks of exercise, no significant between-group differences emerged in (1) VE/VCO2 ratio (26 ± 2.2 to 26 ± 2.0, 29 ± 2.0 to 28 ± 2.3, p = 0.66), (2) oxygen uptake efficiency slope (2697 ± 442 to 2701 ± 577, 2473 ± 800 to 2481 ± 896, p = 0.71), or (3) VO2peak in mL/kg/min (28 ± 4.4 to 30 ± 4.3, 29 ± 6.7 to 29 ± 6.4, p = 0.38) in treadmill walking and progressive strength training, respectively. There were no significant within-group differences either. No adverse events occurred during cardiopulmonary exercise test or exercise training.
Conclusion:
In people with mild-to-moderate multiple sclerosis, 8 weeks of treadmill walking of low-to-moderate intensity or progressive strength training did not have any effect on ventilatory efficiency or aerobic capacity. Although aerobic capacity was lower than reference values, ventilatory efficiency was not reduced.
Introduction
For people with multiple sclerosis (MS), symptoms such as pain, muscle weakness, and fatigue combined with previous recommendations to avoid exercise training can pose substantial barriers to being physically active. 1 A meta-analysis concluded that people with MS are significantly less physically active than healthy and other diseased populations, 2 which results in deconditioning and the worsening of symptoms. 3 Consequently, their peak oxygen uptake (VO2peak) becomes reduced 4 and their risk of comorbidities such as cardiovascular disease (CVD) 5 increases.
However, convincing evidence demonstrates that exercise training is a safe, effective intervention for improving VO2peak 6 and reducing secondary health risks 4 in people with MS. A systematic literature review conducted by Latimer-Cheung et al. 7 showed that aerobic exercise training at moderate intensities can improve VO2peak in people with MS, whereas studies using treadmill walking (TW) as a modality remain insufficient. Other research has shown that strength training (ST) can produce changes in the metabolic quality of skeletal muscle, which may in turn improve VO2peak. 8 Hansen et al. 9 reported that people with MS have reduced muscular oxidative capacity due to deconditioning, though knowledge regarding cardiovascular gains after ST is scarce.
Recently, a growing body of evidence has demonstrated that measures of ventilatory efficiency, including minute ventilation/carbon dioxide production (VE/VCO2) slope and oxygen uptake efficiency slope (OUES), are strong predictors of all-cause and cardiovascular mortality in cardiac patients.10,11 Additionally, ventilatory efficiency may be an alternative outcome measure to VO2peak, as it does not require maximal exercise intensity.10,11 Studies have shown that mildly disabled people with MS have inefficient ventilation compared with healthy individuals.12,13 It is well established that exercise training benefits the VE/VCO2 relationship in patients with chronic heart failure. 14 It has furthermore been shown that the OUES correlates significantly with VO2peak in people with MS 13 and in healthy and other diseased populations15,16 as well. However, the effect of exercise training on ventilatory efficiency and the most effective treatment mode for improving VO2peak in people with MS remains unkown.
In a recently conducted randomized study, 17 we found that TW was superior to ST in improving walking ability evaluated by GAITRite and also in improving walking work economy (WWE) obtained from a cardiopulmonary exercise test (CPET; secondary outcome measure). Due to the increased risk of CVD in this patient population, we also wanted to assess ventilatory efficiency and aerobic capacity in our sample. Accordingly, aims of this substudy were to (1) describe ventilatory efficiency and aerobic capacity in a sample of people with MS and (2) assess whether exercise (TW and/or progressive strength training (PST)) had an effect on ventilatory efficiency and aerobic capacity.
Method
Design
This study is a subgroup analysis of the participants who performed CPETs before and after the interventions previously described in a randomized parallel group trial 17 conducted at St. Olav’s University Hospital in Trondheim, Norway. The participants were randomized and stratified (by gender and age) to either TW or PST in a 1:1 ratio. The randomization procedure was performed after baseline tests by the unit of Applied Clinical Research at the Norwegian University of Science and Technology, using a web-based randomization system. The study was approved by the Regional Committee for Medical and Health Research Ethics South East Norway (2009/1267) and conducted according to the Declaration of Helsinki. Informed, written consent was obtained from each participant before he or she entered the study.
Participants
During January–November 2010, 29 eligible participants diagnosed with MS were included in the main study. Out of these, 24 participants completed CPETs at baseline and immediately after the interventions (Figure 1). Inclusion criteria were (1) age ≥18 years; (2) an Expanded Disability Status Scale (EDSS) score of ≤6; (3) a subjective perception of reduced gait; (4) no relapse of disease or new medications in the last 6 months; (5) per magnetic resonance imaging, any sign of pyramidal affection affecting gait; and (6) completing CPET before and after intervention. Exclusion criteria were (1) pronounced spasticity and need for Baclofen; (2) electrical stimulation for foot drop; (3) any conditions unrelated to MS but affecting gait function; and (4) a high degree of ataxia that would affect the ability to perform exercise.

Flowchart illustrating enrollment, the randomization, allocation, and follow-up through the study.
Interventions
The interventions have previously been described in detail. 17 Briefly, participants exercised three times per week for 8 weeks in an outpatient clinical setting, supervised by an experienced physical therapist not involved in assessment. Table 1 presents the training programs. In both groups, each training session lasted for 30 min, including a 5-min warm-up. The PST program was conducted according to the current guidelines of the American College of Sports Medicine. 18 The workload was 80% of one repetition maximum (1RM). Resistance was increased by a minimum of 0.25 kg once the participants were able to perform more than six repetitions. Wearing a heart rate monitor, each participant in the TW group was instructed to maintain exercise intensity between 50% and 70% of peak heart rate (HRpeak). During the intervention period, walking speed in bout 3 was gradually increased by 10% to 40% of preferred speed. To calculate the intensity on increased velocity, the preferred walking speed was used as a departure point for each session.
Description of the progressive strength training program and the treadmill walking program performed during the 8-week study period.

PST: progressive strength training; 1RM: one repetition maximum; TW: treadmill walking; active/passive: soft walking or sitting during rest.
Outcome measures
The primary outcome measures were change in ventilatory efficiency measured as the lowest VE/VCO2 ratio and OUES. Secondary outcome measure was change in aerobic capacity defined as VO2peak.
The VE/VCO2 ratio represents the matching of ventilation and perfusion within the pulmonary system; higher values indicate more inefficient ventilation in attaining gas exchange with pulmonary circulation. 19 A VE/VCO2 ratio <30 is considered to be normal, whereas values >34 are elevated, and levels >40 indicate severe pathology. 14 The VE/VCO2 ratio was calculated by averaging the lowest three consecutive 0.5 min data points, as per the method of Sun et al. 20
OUES represents the efficiency of VO2 with increasing VE during exercise. 11 Higher values mean a more efficient VO2, whereas lower values represent a higher amount of ventilation required for a given VO2. 21 OUES was calculated according to the recommendations of Baba et al. 21

in which a represents the OUES and b the intercept. This variable has showed high intra-test reliability and test–retest reliability similar to that of VO2peak and VE/VCO2 slope. 22 VE (L/min), respiratory exchange ratio (RER; VCO2/VO2), HRpeak (bpm), and O2 pulsepeak (mL/beat) are also reported.
Procedures
Participants performed CPETs to determine their ventilatory efficiency and aerobic capacity. The Metamax II (Cortex Biophysics, Germany) was used for respiratory gas analysis, 23 and Metasoft 1.11 was used for analysis. VO2, VCO2, VE, breathing frequency, and RER were measured continuously; variables were calculated and summarized every 30 s. The highest recorded 30 s average that was attained during the tests was determined as the VO2peak. RER values were evaluated to verify that the test was near maximal. HR was continuously measured with a HR monitor (Polar RS 400, Finland).
The participants were tested twice, before and immediately after the intervention. All participants were instructed to refrain from consuming food, tobacco, and caffeine for 2 h prior to assessment, to avoid exercise for 24 h prior and to take their medications as usual. When the participants arrived for the CPET, they were given standardized instructions for completing the test, along with safety instructions. A symptom-limited maximal treadmill test was performed after measures of WWE. Each participant walked at his or her fastest preferable speed with an individual ramp protocol, 24 in which workload was increased every minute by raising the inclination of the treadmill with 2%–3%. The participants walked without handrail support during the tests. When the participants were exhausted, unwilling to continue, displayed clinical symptoms, or reached a plateau in VO2, the test was terminated. All CPETs were performed in accordance with current guidelines.10,24 Test personnel was not blinded.
Statistical analysis
All variables were normally distributed. Within-group differences were tested with a paired sample t-test. Comparisons between groups (TW vs PST) were performed using a general linear model, analysis of covariance (ANCOVA), with values after intervention as the dependent variable and with intervention as a factor. Baseline values were used as covariates to control for differences between groups at baseline. 25 Results are presented as mean ± standard deviation (SD) unless stated otherwise, and in all tests, a p value ≤0.05 was considered to be statistically significant. To reflect the precision of the estimate, 95% confidence interval (CI) is reported as well.
Missing data were considered to be missing at random. The “exclude cases pairwise” option was used, meaning that participants were excluded only if they were missing data required for specific analysis. 26 As such, imputation techniques were not applied, which resulted in a complete case analysis.
In this study, the sample size calculation was based on the primary outcome measure in the original study, 17 the Functional Ambulation Profile (FAP). To detect a 10% difference in the FAP score between groups, with a two-sided 5% significance level and a power of 80%, 13 participants in each group were sufficient.
Results
No adverse events or onset of symptoms were registered during CPETs, and no participant reported any adverse effects during the intervention period. Baseline characteristics of the participants are presented in Table 2.
Baseline characteristics.
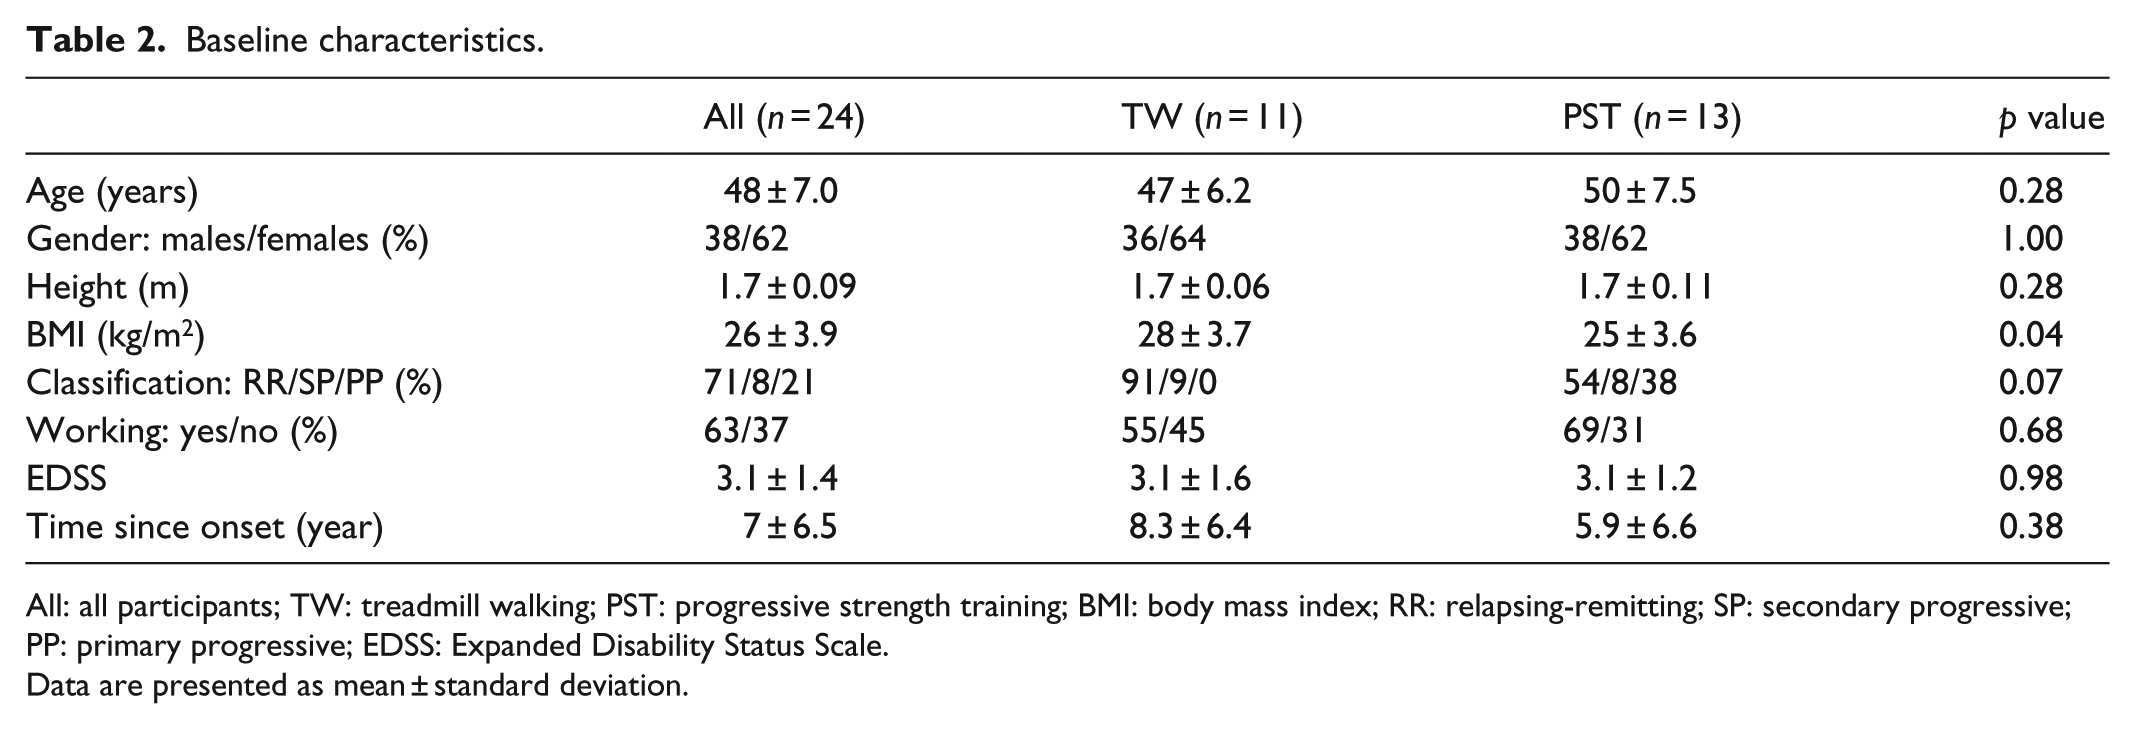
All: all participants; TW: treadmill walking; PST: progressive strength training; BMI: body mass index; RR: relapsing-remitting; SP: secondary progressive; PP: primary progressive; EDSS: Expanded Disability Status Scale.
Data are presented as mean ± standard deviation.
Table 3 presents the baseline variables for all participants. Table 4 presents baseline and post-intervention results for the PST and TW groups. No within-group effect on VE/VCO2 ratio, OUES, or VO2peak following training was found. After adjusting for baseline scores, no significant between-group difference was found either. In the TW group, VO2peak decreased from baseline to post-test in two participants, and three participants had no change. In the PST group, VO2peak decreased in four participants. All other participants improved their aerobic capacity.
Baseline variables for all participants.

CPET: cardiopulmonary exercise test; VE/VCO2: ventilatory equivalent of carbon dioxide; OUES: oxygen uptake efficiency slope; VO2peak: peak oxygen uptake; VE: minute ventilation; RER: respiratory exchange ratio; HRpeak: peak heart rate.
Data are presented as mean ± standard deviation.
Outcome measures after 8 weeks of treadmill walking or progressive strength training.

TW: treadmill walking; PST: progressive strength training; BL: baseline; post: after intervention; ANCOVA: analysis of covariance; VE/VCO2: ventilatory equivalent for carbon dioxide; OUES: oxygen uptake efficiency slope; VO2peak: peak oxygen uptake; VE: minute ventilation; RER: respiratory exchange ratio; HRpeak: peak heart rate; CI: confidence interval.
Data are presented as mean ± standard deviation.
Discussion
The main results in this study were (1) ventilatory efficiency was within normal range and aerobic capacity was reduced and (2) there were no change in VE/VCO2 ratio, OUES, or VO2peak after 8 weeks of TW at low-to-moderate intensity or PST in our sample of people with MS.
In our study, the mean baseline VO2peak was considerably lower than reference values reported for healthy, sedentary people. 27 Despite this, the mean baseline VE/VCO2 ratio in our study sample was normal. Our finding aligns with the results of Klaren et al., 28 who found that the VE/VCO2 relationship was normal in MS patients and not significantly different from that of controls. This might indicate that our sample adequately matched increasing VE with perfusion within the pulmonary system. Additionally, OUES at baseline was within normal values compared to reference values reported for a healthy adult population. 29 The latter is in contrast to the results of previous studies with MS patients13,28 that reported OUES values less than those of healthy individuals. However, Klaren et al. 28 found a significant, albeit only moderate-sized difference in OUES between people with MS and healthy controls. Since OUES is influenced by the onset of lactic acidosis, oxygen extraction and utilization, muscle mass, and the pulmonary dead space ventilation, 30 we might expect that these functions were normal in our sample.
The normal baseline values in ventilatory efficiency probably explain why we did not detect any improvements following TW and PST. It is previously suggested that ventilatory efficiency can be improved with exercise training only when baseline levels are below normal values. 15 Recently, Cardozo et al. 31 reported that the VE/VCO2 relationship and OUES were not influenced by 16 weeks of high-intensity interval training or moderate continuous training in patients with coronary artery disease. However, their mean baseline values also fell within the normal range. Taken together, this seems to be sensible since it could be questioned what the physiological benefit of improving ventilatory efficiency further would be.
Accurate and valid measures from CPET are of great importance when evaluating health and documenting chronic training adaptations. 24 Our sample of individuals with MS was able to reach the secondary criteria (i.e. RER ≥ 1.05 and age-predicted HRmax) at baseline and at post-tests without experiencing any adverse events. RER values did not differ significantly between tests and between groups. However, the SD of RER was high, indicating that some participants did not achieve maximal effort, which influences the measurements of VO2peak. Since the VE/VCO2 ratio and OUES are submaximal calculations, 10 these parameters are independent of test personnel, exercise protocol, and patient effort. 13 Therefore, if there were high variability in exercise intensity during CPETs, this would not affect ventilatory efficiency outcomes.
It is suggested that low-to-moderate intensity (50%–70% of HRmax) might be an effective training stimulus in deconditioned patients. 32 Petajan et al. 33 found marked improvements in VO2peak after 15 weeks of aerobic exercise training with an intensity of 60% of VO2peak in people with MS. However, evaluations of the effect of aerobic exercise training for 4 or 8 weeks at similar intensities could not demonstrate improvements, 7 perhaps due to the brevity of intervention. Nevertheless, the studies with a short training period (<8 weeks) were effective if the volume of training was greater than or equal to three sessions per week, 7 which is in accordance with our exercise prescription. However, Wens et al. 34 demonstrated that 12 weeks of high-intensity (80%–90% HRmax) aerobic exercise training was safe and significantly improved VO2peak, suggesting that exercise adaptations are related to intensity. Regardless of the exercise prescriptions, it is important to acknowledge the course of the disease in MS patients, which is characterized with high variability in symptoms, even from day to day. Our results show that some participants did not achieve maximal effort during the tests, and this might be one of the explanations for not detecting any improvement in VO2peak in our sample.
PST could be an adequate training modality to improve ventilatory efficiency and aerobic capacity due to peripheral adaptations. A systematic literature review 35 reported significant increases in muscle strength following PST at intensities ranging from 60% to 90% of 1RM in people with MS, which might also restore the oxidative capacity of muscles. 13 Lovell et al. 8 demonstrated significant improvements in VO2peak after 16 weeks of ST with an intensity of 6–10 repetitions × 3 at 70%–90% of 1RM in healthy older men. However, after the first 8 weeks, analysis revealed no change in VO2peak. In contrary, Shaw and Shaw 36 showed that 8 weeks of ST with an intensity of 15 repetitions × 3 at 60% of 1RM was sufficient to significantly increase VO2peak in sedentary healthy young men. As previously reported by our research group, 17 the muscle strength of the PST group increased by as much as 25%–137% (p ≤ 0.011). Despite those improvements, the PST program did not affect ventilatory efficiency or aerobic capacity.
There are a few considerations to bear in mind while interpreting the results from this study. First, it is a strength that participants could perform CPETs on treadmills and that an individual ramp protocol was used. Second, training intensity was well controlled, and the exercise adherence was excellent. Among its weaknesses, the sample size calculation was based on the primary outcome measure in the main study, 17 the FAP, which could have influenced the statistical power to show significant changes. Furthermore, neither exercise behavior nor current physical activity was measured in the sample. Because the sample comprised persons with mild-to-moderate MS, the results cannot be generalized to persons more severely affected by MS.
Despite no changes in ventilatory efficiency or aerobic capacity, one participant in PST reported to be able to ski again, while one participant in TW reported increase in walking from maximal 100 m in the last couple of years to 30 min. Such improvements are of great clinical importance as improvements in physical activity levels are important regarding other CVD risk profiles.
Conclusion
The results from this study show that although aerobic capacity was lower than reference values, ventilatory efficiency was within normal range in our sample of people with mild-to-moderate MS. Moreover, neither a TW program of low-to-moderate intensity nor a PST program for 8 weeks had an effect on ventilatory efficiency or aerobic capacity.
Footnotes
Acknowledgements
The authors gratefully thank the participants for their involvement, the physical therapists, and the staff at the Department of Neurology, St. Olav’s Hospital for their contributions.
Declaration of conflicting interests
The author(s) declared no potential conflicts of interest with respect to the research, authorship, and/or publication of this article.
Ethical approval
The Regional Committee for Medical and Health Research Ethics South East Norway (2009/1267; ClinicalTrials.govNCT01074827).
Funding
The author(s) disclosed receipt of the following financial support for the research, authorship, and/or publication of this article: The Liaison Committee of the Central Norway Regional Health Authority and the Sør-Trøndelag University College funded this study.
Informed consent
Written informed consent was obtained from all subjects before the study.