
Abstract
Insulin resistance is a metabolic disorder that is increasing worldwide and is associated with some of the most common diseases affecting modern societies including diabetes, hypertension, obesity, and coronary heart disease. Changes in diet and physical activity have a profound effect on lowering the risk and cost of managing insulin resistance compared to the pharmacological approach. An interventional study of 16 weeks explored the effect of Psyllium husk fiber in combination with lifestyle modification on insulin resistance among the centrally obese school teachers of district Malakand Khyber Pakhtunkhwa. One Hundred twenty school teachers with central obesity, aged 40-60 years, with no chronic disease history were divided into four subgroups (n = 30) with equal gender bifurcation; a control group, lifestyle modification (LSM) group, psyllium husk fiber (PSH) group, and the combined intervention of LSM & PSH group. Fasting serum was collected to analyze fasting blood glucose, and insulin resistance by using the HOMA-IR method at baseline and post-intervention. A significant effect of the intervention was observed on fasting blood glucose. The combined group of LSM&PSH showed the highest mean change of −7.5 ± 2.6 mg/dl (−9%), followed by the PSH group with a mean change of −6.3 ± 2.1 mg/dl, (−7%). Likewise a significant effect (P < 0.05) on HOMA-IR was observed in the combined group of LSM&PSH with a mean of 1.02 ± 0.14 molar units (−58%), followed by the PSH group with a mean of 1.55 ± 0.14 molar units (−33%). The current study was carried out to assess the effect of regular consumption of Psyllium husk fiber in combination with lifestyle modification on insulin resistance and fasting blood glucose.
Introduction
Increasing in prevalence in Western countries, the metabolic syndrome, a common metabolic disorder that clusters a constellation of abnormalities, including central obesity, hypertension, dyslipidemia, and insulin resistance, is emerging as one of the most important public health problems in the world, taking into account that it is a major risk factor mainly for type 2 diabetes and cardiovascular diseases, and also for many types of cancer. 1 Although pharmacologic approaches to managing insulin resistance are being advocated by some, public health approaches involving changes in diet and physical activity are attractive because of their lower cost and risk. 2 Increased risk of developing obesity and obesity-related NCDs like insulin resistance, metabolic syndrome, type 2 diabetes mellitus, and Coronary heart diseases are higher in South Asia. 3 Impaired glucose levels and dyslipidemia are seen as early as childhood and adolescence, congregated with higher blood pressure, and have a strong association with central obesity.4 -7 High blood pressure, dyslipidemia, and impaired glucose tolerance accumulate in individuals with unhealthy lifestyles and diets, irrespective of age. Excessive consumption of animal sources of saturated fats, cholesterol, and salt with inadequate fiber intake, lack of physical activity, and increased sedentary lifestyle contribute to risk factors. 8 The central adiposity has a strong association with type II diabetes, 9 insulin resistance, 10 related disorders to metabolic syndrome,11,12 and ischemic stroke. 13 Waist circumference has shown a strong correlation with hypertension and type 2 diabetes. 14 The recent studies showed that visceral deposition of fats is a sole significant predictor of reduced insulin sensitivity, 15 compromised glucose tolerance, 16 raised blood pressure,17,18 and dyslipidemia.19,20 The public health strategic prevention approach is considered the most affordable, cost-effective, and viable course of action to manage this worldwide non-communicable chronic disease. 21 Eating healthy food, maintaining ideal body weight, and moderate exercising throughout life can potentially improve quality of life.22,23 An optimum intake of dietary fiber, either as a food or supplement, promotes weight loss, having beneficial effects.24,25 Dietary fiber, an integral component of the diet, would appear to be particularly beneficial with regard to its putative role in the control of most of the metabolic disturbances clustered in the metabolic syndrome. 26 Epidemiological studies demonstrated a lower prevalence of obesity in population with higher consumption of dietary fiber compared to the population with less consumption. 27
Dietary fiber is a collective term for a variety of plant substances that are resistant to digestion by human gastrointestinal enzymes. 28 Like other dietary fiber, Psyllium husk is a viscous, mostly water-soluble fiber and has been shown to be an effective supplement in adjunct to dietary intervention to control blood cholesterol and glucose levels. 29 The underlying mechanisms whereby dietary fiber improves glucose homeostasis are unclear but may include delaying gastric emptying, slowing the rate of intestinal absorption of glucose, or altering hormone secretion and/or sensitivity to a carbohydrate load. 30 Psyllium husk fiber has been shown to significantly reduce postprandial serum glucose and insulin concentrations in non-diabetic individuals. 31
Materials and Method
One Hundred twenty school teachers with central obesity, aged 40-60 years and having no chronic diseases were registered in 16 weeks of an interventional study in district Malakand Khyber-Pakhtunkhwa Pakistan. Subjects were divided into three intervention groups and one control group. Each group comprises an equal number of subjects with gender equity. Group I, the lifestyle modification (LSM) was advised to change diet, and behavior, and adopt a minimum of 30 minutes of exercise. In Group II, the psyllium husk fiber (PSH) was advised to intake of 5 gm psyllium husk fiber twice a day (30 minutes before breakfast and dinner) while group III was suggested for both lifestyle modification and 5 gm (b.i.d.) psyllium husk fiber. Weekly and monthly follow-up and in-person visits and discussion methods were used for effective compliance. Anthropometric, dietary data, and 5cc fasting blood samples were collected at week 0 and week 16, however, the 3cc serum sample was also collected after every 4 weeks for analysis of fasting blood glucose. The duration of the weekly walk were recorded in minutes. HOMA-IR method was used for the assessment of insulin resistance of the subjects at baseline and end line. The data were compared in groups (pretest and post-test) using student t-tests, and between the groups by using ANOVA. The ANCOVA was performed to evaluate the effect of intervention by adjusting for gender, age, and baseline. The data were analyzed using General Linear Models with gender and age value covariates.
Results and Discussion
Socio-economic status
Table 1 reveals the general socio-economic status of the subjects enrolled in the study. Non-significant difference (P = 0.272) was observed between the control group and the intervention groups. The mean age of the control group was 46.2 ± 5.8 years, the mean age (years) of the Lifestyle modification (LSM) group was 46 ± 4.9 years, the mean age (years) of the Psyllium husk fiber (PSH) group was 47 ± 5.7 years, and the mean age of the combined group of LSM&PSH was 44 ± 5.3 years. A non-significant difference was observed between the control and the intervention group’s education, salary, and estimated income from other sources.
Baseline socio-economic status of study subjects.

Data are presented as frequency (percentages) and mean (standard deviation) for categorical and continuous variables, respectively, for comparison of variables; one-way ANOVA was used. Means with similar letters are statically not significant in the rows (P < 0.05). Estimated income is the Income other than salary per month.
LSM, lifestyle modification; PSH, Psyllium husk fiber.
Baseline anthropometric
Table 2 explained the measurement of the anthropometric mean between the control and interventional groups. A non-significant difference (P = 0.272) was observed among the groups. The mean weight difference at baseline between the control and intervention groups was significant (P < 0.05); the PSH group had the maximum mean weight of 81.8 ± 9.8 kg, followed by the LSM group with a mean weight of 80.8 ± 9.8 kg. The mean weight of the LSM&PSH group was 75.8 ± 7.6, and the mean weight of the control group was 74.9 ± 11.3 kg. The difference in height between the groups was non-significant (P = 0.753). A significant difference (P < 0.05) was observed in BMI between the control and intervention groups, the LSM group has the highest BMI 30.2 ± 4.4 kg/m2 compared to other groups. The mean BMI of the PSH and the combined group of LSM&PSH were 29.7 ± 3.7 and 28.3 ± 2.9 kg/m2 compared to the control group 27.3 ± 2.3 kg/m2. Mean waist circumference difference was also significant (P < 0.05) between the groups, the mean WC of the LSM group was 100.7 ± 7.9 cm, which was higher than PSH, the combined group of LSM&PSH group compared, and the control groups. The mean WC of the PSH group was 99.8 ± 8.3 cm, the combined group of LMS&PSH was 96.8 ± 6.1 cm, and the mean WC of the control group was 94.7 ± 7.5 cm. A non-significant effect was observed between the control and intervention groups means waist to hip ratio (P = 0.117).
Anthropometric trend by group at baseline.
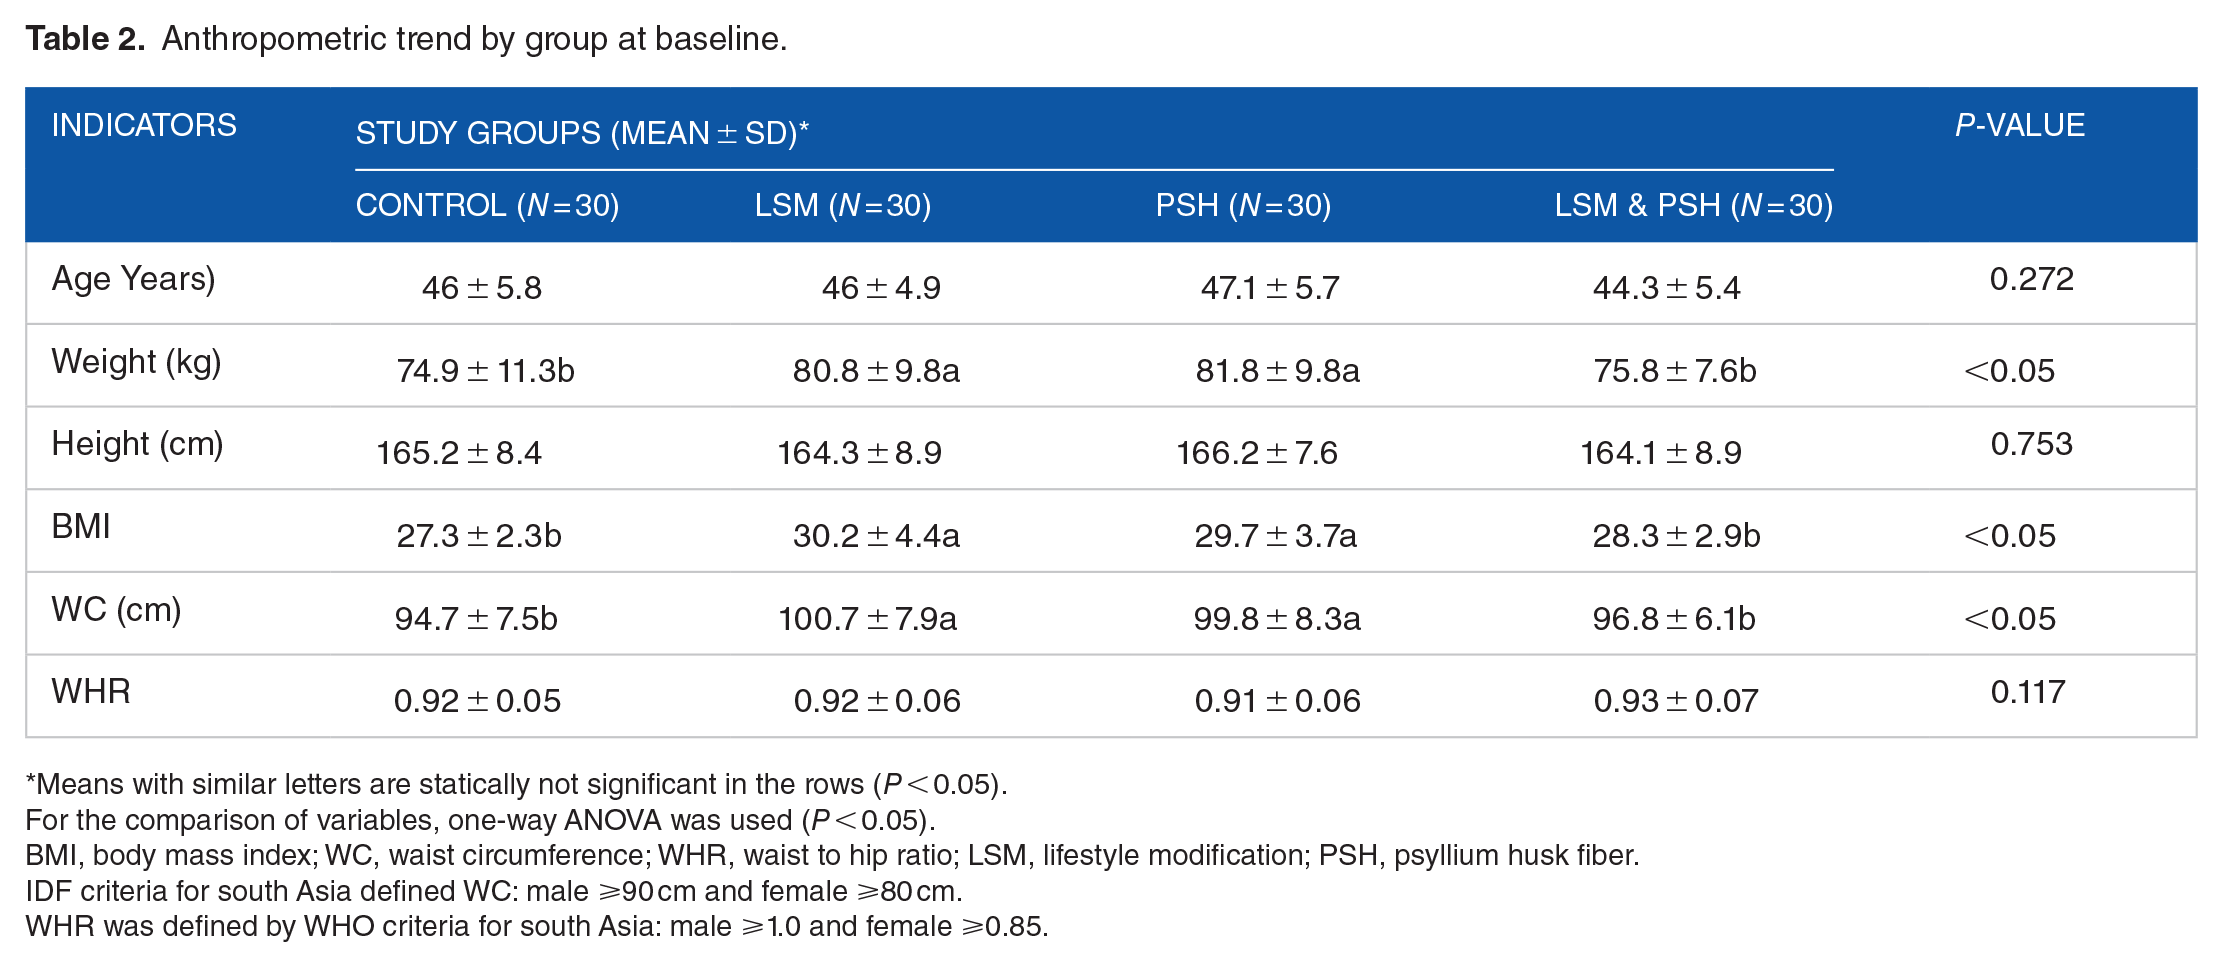
Means with similar letters are statically not significant in the rows (P < 0.05).
For the comparison of variables, one-way ANOVA was used (P < 0.05).
BMI, body mass index; WC, waist circumference; WHR, waist to hip ratio; LSM, lifestyle modification; PSH, psyllium husk fiber.
IDF criteria for south Asia defined WC: male ⩾90 cm and female ⩾80 cm.
WHR was defined by WHO criteria for south Asia: male ⩾1.0 and female ⩾0.85.
The growing prevalence of cardiovascular diseases, type 2 diabetes, and some cancers are related to excess weight, which is exceptionally high in middle-income countries like Eastern Europe, Latin America, and Asia, where obesity is considered the fifth most common cause of these burdens ranking just below the underweight. 32 According to Khan et al 33 increasing age is also related to an increase in BMI, waist circumference, and waist to height ratio (WHtR), with the female having a higher BMI due to her shorter height.
Fasting blood glucose at baseline
Figure 1 illustrates a significant difference observed between the control and interventional groups in overnight fasting blood glucose. The combined group of LSM&PSH has the highest value of FBG level with a mean of 88 ± 14 mg/dl, while the most negligible value for FBG was observed in the control group with a mean of 82 ± 8 mg/dl. The LSM has a mean value of 87 ± 6, and the PSH has a mean FBG level of 83 ± 8 mg/dl.

Baseline fasting blood glucose.
Fasting blood glucose is one of the most influencing parameters which either directly or indirectly affects all other parameters like lipid profile, blood pressure, SGOT, SGPT, and fat deposition in individuals. Vitals were elevated in males as compared to females in the condition of elevated fasting blood glucose. 34 In multiple studies, it has been observed that morning fasting glucose levels affect the ability to recall a word list and other tasks related to memory recall and counting backward, influencing cognition via several mechanisms. 35 Elevated blood sugar is strongly associated with delayed associative memory, reduced accuracy or working memory processing among women, and slower working memory processing among men, affecting the sensitive indicators of cognitive status in healthy adults. 36
Insulin resistance by HOMA-IR method at baseline
Figure 2 explains the insulin resistance calculated based on the homeostasis model assessment index (HOMA) method. Group-wise data revealed a significant difference (P < 0.05) between the control and intervention groups. The control group has the mean HOMA IR of 1.7 ± 0.9, in which 23% were <1, 40% were in 1−<2, and 37% were in the>2 HOMA-IR range. The LSM group had a mean HOMA-IR of 2.6 ± 1.2, where 3% were <1, 37% were in 1−<2, and 60% were in the >2 HOMA-IR range. The mean HOMA-IR of the PSH group was 2.4 ± 1, in which 10% were in <1, 20% in 1−<2, and 70% were in >2 HOMA-IR range. The mean HOMA-IR of the combined group of LSM&PSH was 1.9 ± 0.8, in which 3% were in <1, 67% were in 1−<2, and 30% were in >2 HOMA-IR range.

Mean HOMA-IR at baseline.
Insulin is a peptide hormone released from the β cells of pancreatic islets of Langerhans to maintain the average blood glucose level by facilitating the uptake of glucose from bloodstream to cell by regulating the carbohydrate, lipid, and protein metabolism. However, due to some biological response, this average insulin level elevated and developed insulin resistance, 37 classically this refers to impaired sensitivity to insulin-mediated glucose disposal. 38 Epidemiological studies have correlated the fasting and post-meal load insulin level with the risk of coronary heath disease. Impaired insulin levels are one of the reliable markers of insulin resistance. 39 Age and gender profoundly affect the HOMA-IR level, which increases in women over fifty years of age. 40
Post-intervention anthropometric changes, a group-wise trend
Figures 3 and 4 depict the pretest (baseline) and posttest (post-intervention) change in weight, Waist circumference, and BMI, between the control and intervention groups. No significant change was observed in mean weight, BMI, and WC between the control and intervention groups. However maximum change in weight −0.8 ± 0.6 (−2.0−0.4) kg, BMI −0.3 ± 0.2 (−0.8−0.2)−kg/m2 and WC −0.9 ± 0.7 (−2.5−0.5) cm was observed in the combined group of LMS&PSH. An increase in weight 0.2 ± 0.5 (−0.8−1.1) kg, BMI 0.03 ± 0.2 (−0.3−0.4) kg/m2, and WC 0.2 ± 0.6 (−1.0−1.5) cm were in the PSH group.

Post-intervention anthropometric trend by the group.

Post-intervention fasting blood glucose.
Human studies showed controversial results, most of them proved a non-significant relationship between consumption of psyllium husk fiber and improvement of body weight and composition. 41 Similar findings were shared by Hylander and Rössner 42 where a high fiber diet and psyllium husk fiber improved the satiety but had no effect on weight loss. Anderson et al 43 also reported that consumption of psyllium husk fiber improves lipid profile but has no effect on weight loss. Akbarzadeh 44 reported that short-term usage of psyllium husk fiber had a non-significant effect on anthropometry; however, it improved digestion and increased satiety. Likewise (45,46 found unconvincing evidence that fiber supplements can reduce body weight. A similar difference of healthy weight loss of 1.29 kg was reported by Pai and Prabhu 47 in their experiment, where 50 healthy subjects consumed psyllium husk fiber daily for 93 days. In a 10.5 gm/day dose of psyllium husk fiber Abutair et al 48 reported a weight loss of 2.7 kg in the intervention group compared to the control group. Anderson et al 49 reported that 5.1 gm psyllium husk fiber twice a day reduces the subjects’ weight with a percent change of −0.3 ± 0.4 if compared to baseline. In a 12 weeks study with a 10 gm daily dose of psyllium husk fiber. Abutair et al 48 reported a similar decrease in BMI of 0.98 kg/m2 in 8 week interventional study of psyllium husk fiber on change in anthropometric measurement of 10.5 gm of the daily dose of psyllium husk fiber.
Post-intervention anthropometric changes
Table 3 shows the adjusted mean weight, BMI, and WC between the control and intervention groups. A non-significant change was observed between the control and intervention groups after covariate for gender, age, and baseline weight. The mean effect on weight was non-significant (P = 0.244) between the control and intervention groups. Similarly, mean changes in BMI and waist circumference were also non-significant (P = 0.56, P = 0.314, respectively).
Trend in mean anthropometric measurements.

Covariates appearing in the model are evaluated at the following values: Gender = 1.50, Age = 45.91, Weight Baseline = 78.4679, BMI Baseline = 28.8917, WC Baseline = 96.7083. BMI, body mass index; WC, waist circumference; LSM, lifestyle modification; PSH, psyllium husk fiber; R Squared weight = .928 (Adjusted R Squared = .925), R Squared BMI = .898 (Adjusted R Squared = .893), R Squared WC = .769 (Adjusted R Squared = .757), Design: Intercept + Gender + Age + Weight/BMI/WC + Study group.
Post-intervention effect on Blood glucose
A significant change (P < 0.05) in fasting blood glucose level was observed between the control and intervention groups. The combined group of LSM&PSH showed a higher mean change of −7.5 ± 2.6 (−9%), followed by the PSH group means the change of −6.3 ± 2.1 (−7%). The LSM group showed a mean change of −0.5 ± 1.7 (−1%), and the mean change observed in the control group was −1.53 ± 1.7 (−2%). Changes in FBG glucose observed were affected by the baseline FBG level. The higher at baseline, the maximum change reported post-intervention.
Our findings match Cicero, 50 who demonstrated that the long-term effect of dietary fiber (psyllium husk fiber) improves the individuals’ glycemic and plasma lipid management. According to Knowler et al 51 lifestyle adjustments (at least 150 minutes of physical activity each week) can significantly lower the risk of diabetes by up to 58%. Schellenberg 52 demonstrated in a meta-analysis that comprehensive lifestyle intervention successfully reduces the occurrence of type 2 diabetes in high-risk individuals while having no effect on people who already have type II diabetes.
Post-intervention fasting blood glucose trend
Figure 5 illustrates the weekly trend of fasting blood glucose. The intervention effect on fasting blood glucose was chaotic, although the overall week-wise change was significant (P < 0.05). At week four, the mean FBG level raised with a mean change of 3.17 ± 0.9 (4%), while were at week eight, the FBG level dropped with a mean change of −0.54 ± 0.9, (−1%), at week 12, a raise was observed in FBG with a mean change of 1.89 ± 0.9, (2%) and at week 16 a significant fall was observed with a mean change of −3.97 ± 0.9, (−5%), compared the baseline mean FBG level of 82.63 ± 0.7 mg/dl.

Fasting blood glucose, blood pressure, pulse rate, and average weekly walk.
HOMA-IR post-intervention trend between groups
Figure 6 showed the mean HOMA-IR of the control and intervention groups co-variated for gender, age, and baseline. A highly significant (P < 0.001) effect was observed between the groups. The maximum mean effect was observed in the combined group of LSM&PSH with a mean HOMA-IR value 1.02 ± 0.14, (1.29; 0.75) Molar units and the change observed was −1.0 ± 0.1, (−1.3; −0.8) Molar units, (−58%), followed by the PSH group with mean 1.55 ± 0.14, (1.82; 1.28) Molar units and change observed was −0.7 ± 0.1, (−1.0; −0.4) Molar units, (−33%). Mean HOMA-IR of the LSM and the control group were 1.69 ± 0.14, (1.96; 1.42) Molar units, (−27%) and 1.82 ± 0.14, (2.09; 1.55) Molar units, (−6%) respectively.

Post-intervention adjusted mean HOMA-IR.
Wegge et al 53 observed a similar effect of a rigorous diet (low fat and high fiber) and exercise intervention on plasma lipid, inflammatory, and circulating adhesion markers. Lipid, insulin, glucose, C-reactive protein, and interleukin-6 levels were determined in fasting blood serum. After 2 weeks, a substantial reduction in lipid profile, glucose (11%), and insulin (26%) levels, as well as HOMA-IR (34%) was found (P = 0.01). Breneman and Tucker 54 reported similar findings in a cross-sectional design evaluating the effect of dietary fiber and lifestyle modification (Physical activity alone) on insulin resistance; subjects with high dietary fiber consumption have a significant effect on insulin resistance, compared to the control group. Simultaneously, patients who ingested a large intake of insoluble fiber did not vary significantly from their counterparts—after correcting for other variables, the link between soluble and HOMA IR was reduced by 32% (P = 0.0094).
Conclusion
The study concluded
That psyllium husk fiber along with lifestyle modification has a significant effect on fasting blood glucose and reduce significantly the HOMA-IR value and can improve the biomarker of cardiovascular health among the healthy individuals. Folsom et al55
Footnotes
Funding:
The author(s) received no financial support for the research, authorship, and/or publication of this article.
Declaration of conflicting interests:
The author(s) declared no potential conflicts of interest with respect to the research, authorship, and/or publication of this article.