
Abstract
Microplastics (MPs) are a growing environmental concern due to their widespread occurrence, persistence, and ecological impacts. However, data on MP pollution in freshwater-dominated subtropical estuaries, particularly in South Asia, remain scarce. This study aimed to assess the spatial distribution, characteristics, sources, and ecological risks of MP contamination in the Feni River Estuary, Bangladesh. MPs were isolated by density separation, characterized by stereomicroscopy, and Fourier Transform Infrared spectroscopy. MP abundances ranged from 426.66 ± 140.23 to 546.66 ± 136.11 items/m3 (mean: 468.33 ± 105.76 items/m3), with no statistically significant variation among stations (p > .05). MPs were dominated by fibers, followed by fragments and films, with minor foams (porous plastics) and microbeads (spherical primary plastics). Polymer characterization identified polyethylene terephthalate (PET, 78%) as the dominant type, with polyethylene (PE), polypropylene (PP), and polystyrene (PS) also detected, reflecting strong consumer plastic inputs and secondary fragmentation processes. Contamination indices (CF) indicated non-negligible pollution, with both the contamination factor (CF, 1 ⩽ CF < 3) and pollution load index (PLI > 1) confirming moderate MP contamination. polymer hazard index (PHI) scores ranged from 0.1 to 9.1, placing polymers into risk categories I (<1) and II (1–10). Notably, PS (9.1), PET (8.6), and PE (7.3) were classified as moderate ecological risks (Category II), whereas PP (0.1) posed a negligible risk (Category I). Multivariate analyses using principal component analysis (PCA) and hierarchical cluster analysis (HCA) revealed spatial heterogeneity in MP distribution, influenced by municipal discharge, aquaculture, industrial inputs, and estuarine hydrodynamics.
Introduction
Plastics have become an indispensable component of modern life due to their low cost and unparalleled functional features. By 2025, global plastic production is projected to reach 400 million tons (Plastics Europe, 2022), with widespread utilization across industries encompassing manufacturing, packaging, agriculture, and beyond (Bappy et al., 2025). Plastics persist in the environment, continuously breaking down into smaller particles through various environmental processes. A significant concern arises from the emergence of these smaller particles of plastics or microplastics (MPs; <0.5 mm), which are minute or fragmented components of larger plastic items. They exhibit diverse morphologies, including fibers, foams, fragments, spheres, pellets, flakes, and films (Rios Mendoza & Balcer, 2019).
MPs are now widely reported in river ecosystems worldwide (André-Marie et al., 2023; Baldwin et al., 2016; Banik et al., 2024; Simon-Sánchez et al., 2019). Their dispersion in rivers and estuaries is shaped by tides, cyclones, wind, and hydrodynamics (Liubartseva et al., 2016; Besseling et al., 2017), while diverse sources—including landfills, atmospheric fallout, wastewater, and agriculture facilitate their entry (C. Li et al., 2020). Once present, MPs are ingested by fish, crustaceans, and mollusks, or adhere to external tissues such as gills and guts, causing physiological and behavioral disruptions (Bhatt & Chauhan, 2023; Egbeocha et al., 2018; Pingki et al., 2025; Sawangproh & Paejaroen, 2025). They also serve as substrates for invasive species, threatening ecological balance (Shen et al., 2019). Therefore, given the increasing global concern over MP pollution, evaluating the risks posed by MPs in freshwater environments is imperative.
The Feni Estuary is an essential fishing center in southeastern Bangladesh, yielding 1,368 metric tons of fish each year (DoF, 2022) and providing a significant source of protein and employment for local populations. It fosters extensive ichthyofaunal diversity (Yeasmin et al., 2017), serves as a crucial breeding and feeding habitat for economically significant species, possesses diverse aquatic habitats (salt marsh, mangroves, etc), and sustains various fishing methods that support local employment and revenue (Dipty et al., 2024). In contrast to other estuaries in Bangladesh, it is directly impacted by the transboundary Feni River and the Muhuri irrigation project, rendering it particularly susceptible to upstream contributions and hydrological changes. This unique environment fosters a complex interaction between natural processes and human-induced stresses, subjecting the system to many stressors including agricultural runoff, unregulated settlements, and alterations in hydrology (Siddiqye et al., 2018). The Feni Estuary is distinguished as an ecosystem of national and regional significance due to its high fishing productivity, socio-economic relevance, and unique vulnerability.
MP contamination has been extensively documented in large-scale tropical estuarine systems worldwide, including the Pearl Estuary in China (Zhao et al., 2015), the Udyavara River Estuary in India (Unnikrishnan et al., 2023), the Meghna River Estuary (Hossain et al., 2023), and multiple estuaries in Bangladesh, such as the Karnaphuli, Naf, Matamuhuri, Bakkhali, and Meghna River Estuaries (Banik et al., 2024). These findings underlined the growing concern over MP contamination in estuarine ecosystems. Despite the increasing body of research on MP pollution in large estuarine systems, no prior studies have specifically examined the status of MP contamination in the Feni River Estuary. The absence of data on this system represents a crucial research gap, limiting our understanding of MP pollution dynamics in estuarine environments of the sub-tropical region. We hypothesize that MP contamination in the Feni River Estuary exhibits distinct spatial patterns shaped by both terrestrial inputs and estuarine hydrodynamics, with polymer types differing in their ecological risk profiles. To test this, the study aims to (i) quantify MP abundance and distribution across 10 representative sites; (ii) characterize their physical traits and polymer composition; (iii) evaluate contamination levels using established indices (pollution load index, PLI; contamination factor, CF); (iv) assess ecological risks via polymer-specific hazard classification (polymer hazard index, PHI); and (v) identify sources and spatial patterns through multivariate statistical analyses (principal component analysis, PCA; hierarchical cluster analysis, HCA). This study presents the first comprehensive assessment of MP contamination in the Feni River Estuary, enhancing our understanding of coastal pollution beyond major river systems and informing effective policy-making and ecosystem management.
Materials and Methods
Study Area
This study was conducted in the upper stretch of the Feni River (22.9568° N, 91.5539° E), spanning from the Little Feni River Bridge to the Mosapur Closure Dam (Figure 1). The Feni River is a transboundary watercourse originating in India and discharging into the Sandwip Channel of the Bay of Bengal. It encompasses a catchment area of approximately 3,800 km2 and is subject to diverse anthropogenic influences along its course. This catchment area serves a variety of purposes that are crucial for both environmental and human activities, such as water supply, agriculture, biodiversity, ecosystem services, recreation and tourism, commercial and sport fishing, and transportation. The average annual temperature varies from 29.2°C (84.56°F) to 23.03°C (73.45°F), and the annual rainfall is 139.3 mm (5.48 in; Bangladesh Meteorological Department [BMD], 2024). Approximately 1.6 million people reside around Feni, with 21% of the population relying on agriculture and 35% on various industries. Several large and small industries surround the Feni River, such as four heavy industries, 17 medium industries, 826 small industries and 3,419 cottage industries. The river is fed by the Muhuri River near its mouth. It is primarily rain-fed, and its flow fluctuates according to the season and rainfall patterns.
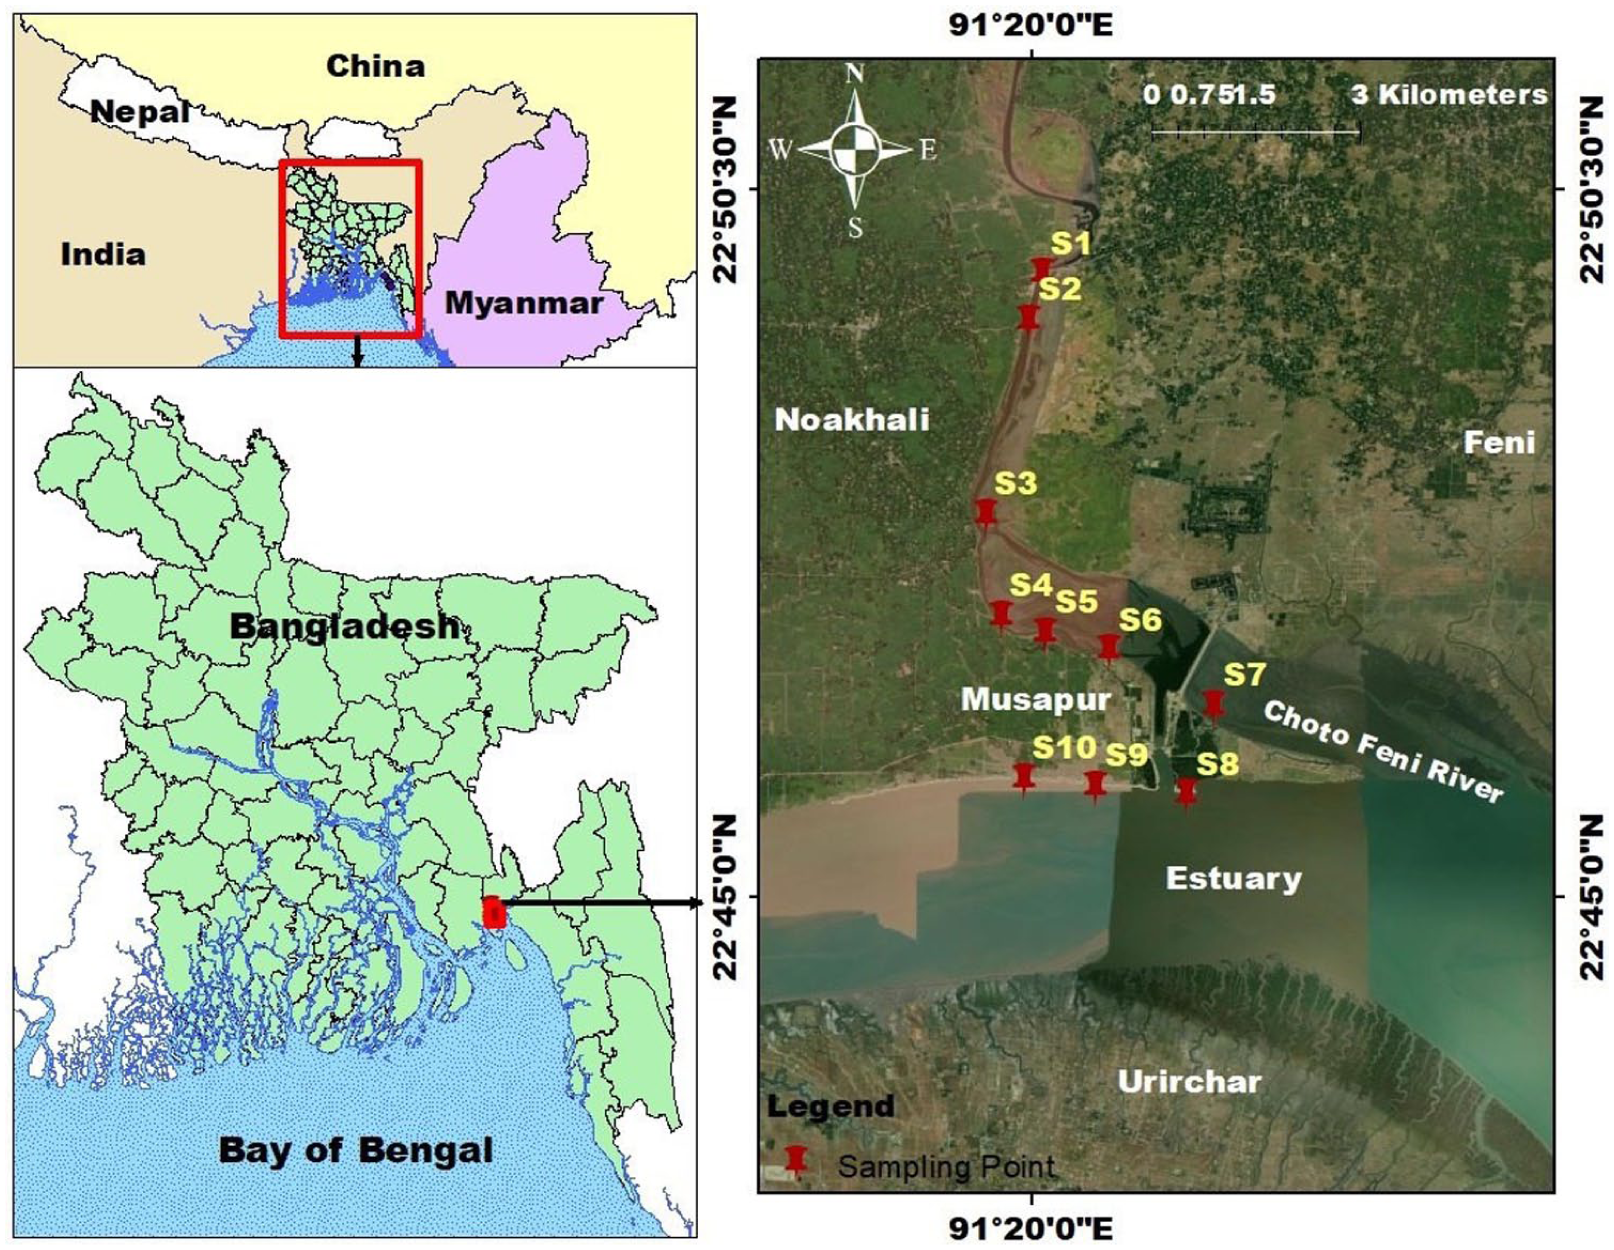
Sampling station along the Feni river estuary in Bangladesh near the Bay of Bengal.
Sample Collection
Fifty water samples, each with five replicates, were collected from 10 sampling stations of the Feni River Estuary (stations S1–S10) between March and April 2022, during the pre-monsoon period (Figure 1). Stations included areas characterized by agricultural and terrestrial runoff (e.g. S2, S7), aquaculture and fisheries activities (S4, S5, S10), industrial impacts (S3, S10), urban and municipal discharges (S1, S6, S9), along with a site of comparatively low impact near Noakhali Beribadh (S8; Supplemental Table S1). Surface water samples (60 l) were obtained from a depth of 0.5 m using a plankton net with a mesh size of 330 µm. The mesh size aligns with established protocols for MPs sampling in surface waters, as advised by A. L. Lusher et al. (2017), and has been utilized in recent regional investigations (Banik et al., 2024; Hossain et al., 2023). The use of a 330 µm mesh facilitated effective filtering of substantial water volumes, reducing clogging and maintaining sample integrity—essential considerations in dynamic and turbid environments such as estuaries. A. L. Lusher et al. (2017) emphasize that mesh sizes ranging from 300 to 500 µm are commonly employed in environmental monitoring because of their practicality and capacity to collect a representative segment of the MPs size range in these contexts. The distance between each of the two sampling stations was approximately 2 km. All water samples were transported in glass storage containers with screw tops coated with polytetrafluoroethylene (PTFE) after collection (A. L. Lusher et al., 2017; W. Zhang et al., 2017). After that, the samples were stored at −20°C in a refrigerator until further processing.
Procedure for Isolating MPs From the Water Sample
The extraction procedure entails two main steps: reduction in water volume and filtration or screening of the samples using density separation. These actions have not been subject to any set of standards. MPs were extracted from water using the methods described by Masura et al. (2015) and Banik et al. (2022). First, each sample of collected water was placed into a 500 ml glass beaker and dried in a hot air oven (DSI-500D, China) at 90°C until dryness. The average melting temperature of MPs is 136°C; hence, drying at 90°C does not melt them (Ter Halle et al., 2017). It is common knowledge that placing oil in water is what happens when MPs, including PE and polyethylene terephthalate (PET), are exposed to moisture or water. To eliminate organic debris, 20 ml of each 30% H2O2 (Scharlab, Spain) and FeSO4 (0.05 M; Loba Chemi, India) solution was used after drying. The MPs were then separated by flotation by overnight storage of the digested solutions in a density separator with NaCl salt solution (1.2 g/cm3; Loba Chemi, India; Banik et al., 2022). The denser undigested components were sorted from the floating MPs at this stage. The supernatant solution was then filtered through 47 mm-diameter 5.0-micron cellulose nitrate filter paper (Minipore, India; Bonello et al., 2018). The MP-containing filter paper was then utilized for Fourier Transform Infrared Spectroscopy (FTIR) measurements and viewed under a microscope.
Microscopic Analysis of Morphological Features of MPs
MPs retained on filter papers were visually identified and measured under a stereomicroscope (Leica EZ4E, Germany) at magnifications ranging from 8× to 35×. Each suspected MP particle was manually counted to estimate abundance, following established protocols (Lots et al., 2017). High-resolution digital images were captured, and particle dimensions were quantified using ImageJ software (version 2.0.0) for precise size analysis (Hossain et al., 2021). To confirm plastic origin, the hot-needle test was employed, wherein a heated needle was brought near the particles; plastic items typically melted or deformed upon contact, distinguishing them from non-plastic materials such as organic debris (Banik et al., 2022). MPs were categorized morphologically, with films defined as thin, sheet-like fragments derived from degraded plastic materials, and fibers characterized by their elongated, thread-like structure. The term “MPs pellets” is used to describe rounded spherical particles. Fragment classification is used when an MP cannot be distinguished as a fiber, pellet, or film. The categorization method proposed by Su et al. (2016) served as the basis for this approach. All laboratory work was conducted in the Laboratory for Ecology, Environment and Biodiversity (LEEB).
Assessment of Chemical Composition of MPs
The polymer composition of MP particles was analyzed using fourier transform infrared (FTIR) spectroscopy (Model 8400 S, Shimadzu Corporation, Japan) across a spectral range of 4,000 to 400 cm−1, employing the potassium bromide (KBr) pellet method. Larger MP fragments were selectively retrieved from filter papers for analysis, following the approach of Ujjaman Nur et al. (2022). Approximately 1 to 3 mg of finely ground MP material was homogenized with 200 mg of KBr powder and compressed into a transparent pellet under a pressure of 10 tons for 1 min using a Shimadzu IR Prestige-21 hydraulic press. The entire pellet preparation process was conducted under vacuum to prevent atmospheric contamination. The resulting pellets were scanned using the FTIR spectrometer at a resolution of 2 cm−1, averaging 30 scans per sample to ensure spectral clarity and accuracy. Spectral measurements were performed over the 4,000 to 1,000 cm−1 range with a resolution of 4 cm−1, averaging 16 scans per sample to ensure precise polymer identification. Automated contrast with wide-spectrum libraries was used for the identification step. By comparing the FTIR spectra to previously published studies, incorrect identification that relies solely on automated libraries may be eliminated (Jung et al., 2018; Noda et al., 2007). A total of 60 MP particles were randomly selected from the processed samples for polymer identification. The selection covered representative morphotypes (fibers, fragments, foams, sheets, and microbeads) across all sampling stations to ensure analytical representativeness. Out of these, 53 particles were confirmed as synthetic polymers based on FTIR spectra, while seven particles displayed non-plastic signatures and were excluded from further analysis.
Contamination Control
To minimize the risk of MP cross-contamination, all reagents—including FeSO4, H2O2, and NaCl solutions—were pre-filtered through 5.0 μm cellulose nitrate membrane filters. Particular caution was exercised during the handling of mixed H2O2 solutions due to their continued oxidative activity during the digestion process. The entire reaction was conducted in a fume hood to ensure safety and prevent contamination. Laboratory equipment and surfaces were cleaned with distilled water followed by 70% alcohol throughout the day. Additional precautions were implemented to avoid cross-contamination from airborne pollutants and synthetic fibers from clothing. As a procedural control, 800 ml of laboratory-filtered distilled water was placed in a 1,000 ml glass beaker and re-filtered through fresh 5.0 μm cellulose nitrate filter paper (Minipore, India) to assess potential contamination from the water or filter materials (Karami et al., 2017). Blank samples, processed using identical protocols as the test samples, confirmed the absence of MP contamination. During the processing of bottled water samples, deionized water was exposed to ambient conditions in an open beaker and subsequently filtered to detect any airborne contamination. To minimize airborne contamination, all sample processing was conducted in a clean and dry environment. Laboratory staff dressed in cotton lab coats and nitrile gloves. No MPs were identified in the control samples, signifying effective contamination management. These techniques adhere to the established principles proposed by Karami et al. (2017). All dried samples intended for microscopic analysis were stored in clean glass Petri dishes to prevent post-filtration contamination.
Ecological Risk and Potential Hazard Assessment
Three approaches were employed to evaluate the ecological risk and potential hazard of MPs in surface water. The first method, contamination factor (CF), measures the level of MP contamination relative to a baseline or background concentration. The second method, pollution load index (PLI), integrates CF values across stations to assess the overall degree of MP pollution and its potential effects on aquatic organisms (Tomlinson et al., 1980). The third method, polymer hazard index (PHI), evaluates the chemical toxicity of different MP polymer types to the environment (Lithner et al., 2011).


Ci/Co denotes the proportion of the measured MP concentration relative to the ambient level. The background value was unavailable, so the lowest MP concentration found in this study (33.3 items/m3 water) was utilized (C. Li et al., 2020).
The third method involved calculating the polymer hazard index (PHI) to evaluate the chemical toxicity of different MP polymer types to the environment. The PHI was determined using the following equation:

where, Pn = the percentage of specific polymer types extracted from each sample
Sn = the hazard scores of polymers derived from Lithner et al. (2011).
Statistical Analysis
MP abundance in surface water of the Feni River estuary was expressed as items per cubic meter (items/m3) at each sampling station. Spatial variability in MP concentrations among stations was evaluated using one-way analysis of variance (ANOVA) with a significance level of p < .05. All statistical analyses were performed using PAST (Paleontological Statistics, version 4.03) and SPSS (version 25). The geographical distribution of sampling sites was visualized in ArcGIS (version 10.3). To further investigate potential sources and compositional patterns of MPs, PCA was applied to identify associations between MP types and sampling sites, thereby supporting source identification. Hierarchical cluster analysis (HCA) was employed to group stations based on similarities in MP abundance and composition. PCA and HCA were chosen because they are widely used in environmental research for pollution source apportionment and spatial pattern recognition, providing a detailed framework to interpret MP origins, transport pathways, and heterogeneity within the estuarine environment.
Results and Discussions
Abundance and Spatial Dynamics of MPs
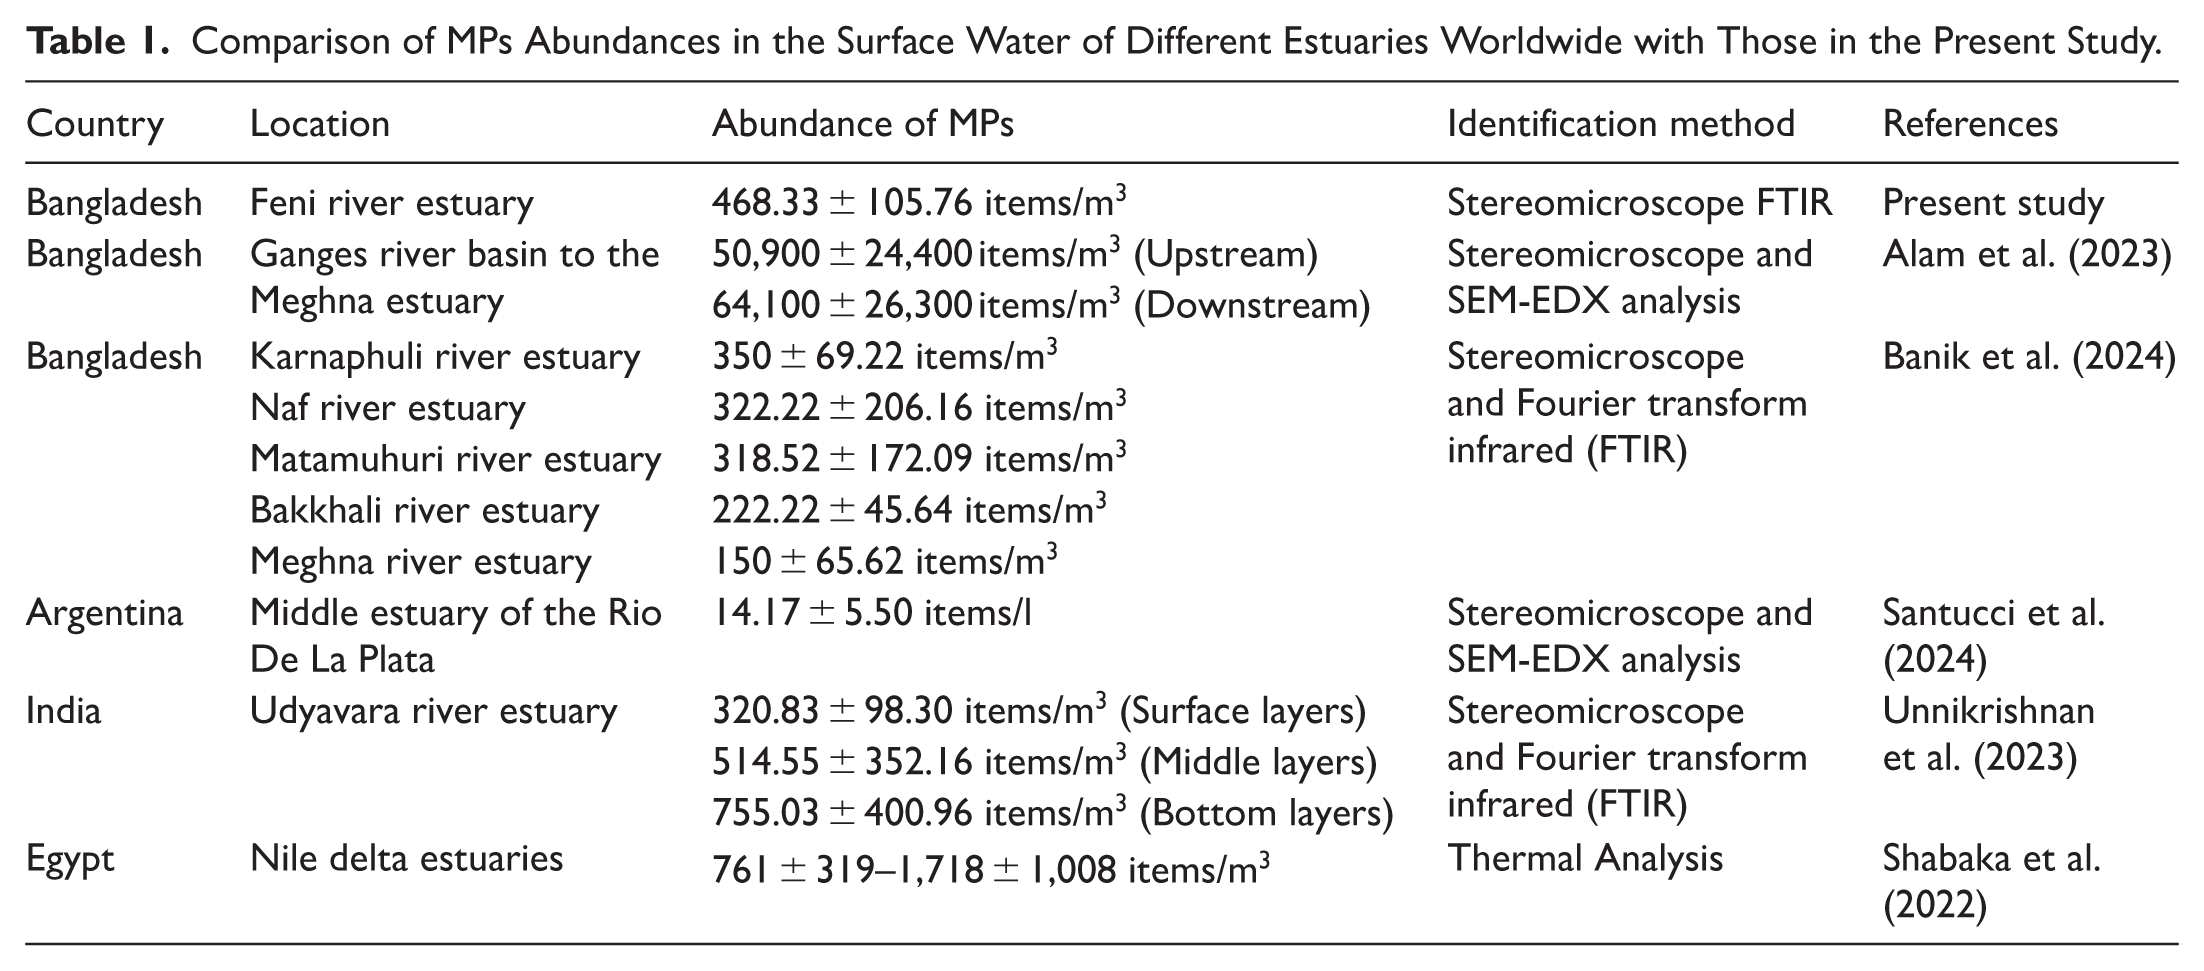
MPs were present in all collected samples and the mean abundance was 468.33 ± 105.76 items/m3, with a range from 426.66 ± 140.23 to 546.66 ± 136.11 items/m3 (Table 1; Figure 2). The distribution of MP abundance varied across the sampling stations, with the lowest observed at S8 near Noakhali Beribadh and the highest at S6 near southern Musapur. Noakhali Beribadh, located further from direct pollution sources and areas of high human activity and industrial operations, likely experienced reduced MPs inputs. In contrast, the waterway near Musapur (S6) experienced significant tourist activity, which may have contributed to higher plastic waste, including packaging, food consumption, and general littering (Jannah et al., 2024). Statistical analysis revealed no significant changes in MPs concentrations across the study sites (p > .05). Nevertheless, minor variations observed may be influenced by factors such as sampling season and local conditions (Hosseini et al., 2020). Freshwater inflow and tidal flushing can all enhance water column mixing, thereby reducing regional heterogeneity in the distribution of MP (Luo et al., 2019). T. Wang et al. (2022) highlighted that hydrodynamic processes, including estuary fronts, turbulent diffusion, and tidal exchange, are fundamental factors influencing MPs transport and redistribution in estuarine environments. These variables certainly contributed to the spatial homogeneity found in our investigation, despite the lack of statistically significant variances among sampling locations. During winter months (November to February), reduced outdoor activities such as boating, fishing, and recreational pursuits near estuaries may result in decreased plastic waste entering water bodies (Cheung et al., 2016).
Comparison of MPs Abundances in the Surface Water of Different Estuaries Worldwide with Those in the Present Study.
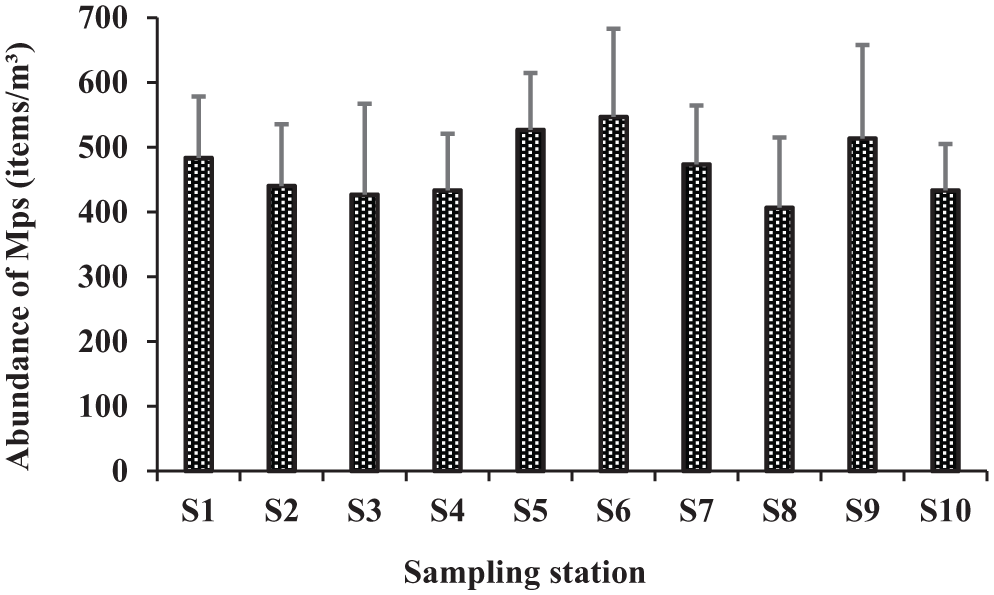
Abundance of MPs in the Feni river estuary.
Because there are no universally established protocols for sampling, analysis, or monitoring, direct comparisons of MPs abundances across studies remain challenging (Shan et al., 2018). Nevertheless, the present results were evaluated against published research that used comparable methods and reporting units (Table 1). The Feni River estuary in Bangladesh shows among the highest recorded concentrations, with 468.33 ± 105.76 items/m3, exceeding levels in other Bangladeshi estuaries such as the Karnaphuli River (350 ± 69.22 items/m3), Naf River (322.22 ± 206.16 items/m3), and Matamuhuri River (318.52 ± 172.09 items/m3; Banik et al., 2024). In contrast, the Bakkhali River estuary reported 222.22 ± 45.64 items/m3, while the Meghna River estuary had the lowest values at 150 ± 65.62 items/m3. The Ganges River Basin exhibited intermediate contamination, with 50.9 ± 24.4 particles/l upstream and 64.1 ± 26.3 particles/l downstream, indicating an increasing trend toward the estuary (Alam et al., 2023). Similarly, in the middle estuary of the Río de la Plata in Argentina, the concentration of MP was found to be 14.17 ± 5.50 MPs l−1 and 320.83 ± 98.30 particles m−3 (Santucci et al., 2024). These results are similar to, or in some instances, higher than the concentration of MPs in some of the world’s moderately to heavily affected estuarine systems. Concentrations of MPs at these levels reflect the high pressure of plastic pollution and make the Río de la Plata a hotspot for MP pollution, reflecting the high level of human activity in the area. India’s Udyavara River estuary showed a vertical stratification, with higher concentrations in the middle water layers (755.03 ± 400.96 particles/m3) than at the surface (514.55 ± 352.16 particles/m3), suggesting sedimentation and accumulation processes (Unnikrishnan et al. (2023).”
The highest MP concentrations are reported in Egypt’s Nile Delta estuaries, ranging from 761 ± 319 to 1,718 ± 1,008 MPs/m3, reflecting significant pollution in the region (Shabaka et al., 2022). These variations in MP abundance across estuaries are influenced by several factors, including regional differences in population density, industrial activities, wastewater management, and hydrodynamic conditions. MPs produced by human activities are discharged through wastewater treatment plants and transported to oceans via freshwater systems. Rainwater runoff and atmospheric transport also contribute to MP transfer (K. Zhang et al., 2018). Although most studies have concentrated on oceanic MP pollution, reported MPs concentrations in freshwater systems (rivers and lakes) are often up to three orders of magnitude higher than those in marine waters, reflecting greater proximity to anthropogenic sources (Aliabad et al., 2019; Khalik et al., 2018). Specific hydrological and environmental conditions, such as tidal currents, water flow patterns, and sedimentation rates, can influence the distribution and retention of MPs within estuaries. Estuarine systems often have complex dynamics that might trap or concentrate MPs more than inland freshwater environments (Luo et al., 2019).
Morphology and Characteristics of MPs
MPs retrieved from water samples were categorized into five types: fibers, fragments, foams, microbeads, and sheets through visual observation under a stereomicroscope (Figure 3). Although films are commonly included in standard MP classification schemes, no film-type particles were detected in the present study. Fibers were the most dominant, accounting for 89.80% of the total MPs found, followed by 3.49% fragments, 2.36% foams, 2.20% sheets and 2.15% microbeads (Figure 4(A)). The spatial variations in fragments and fibers in the water of the studied areas were statistically significant (p < .05). The elevated concentrations of fibrous MP in water are primarily related to household and recreational sewage waste, in addition to plastics from equipment and threads (Gallagher et al., 2016). Additionally, several factors, including unplanned human settlement in the catchment area of the Feni River estuary, agricultural practices, fish farming, fishing equipment (e.g. nets), industrial waste from textiles (Islam et al., 2018) and others, may have contributed to fibrous plastic pollution.
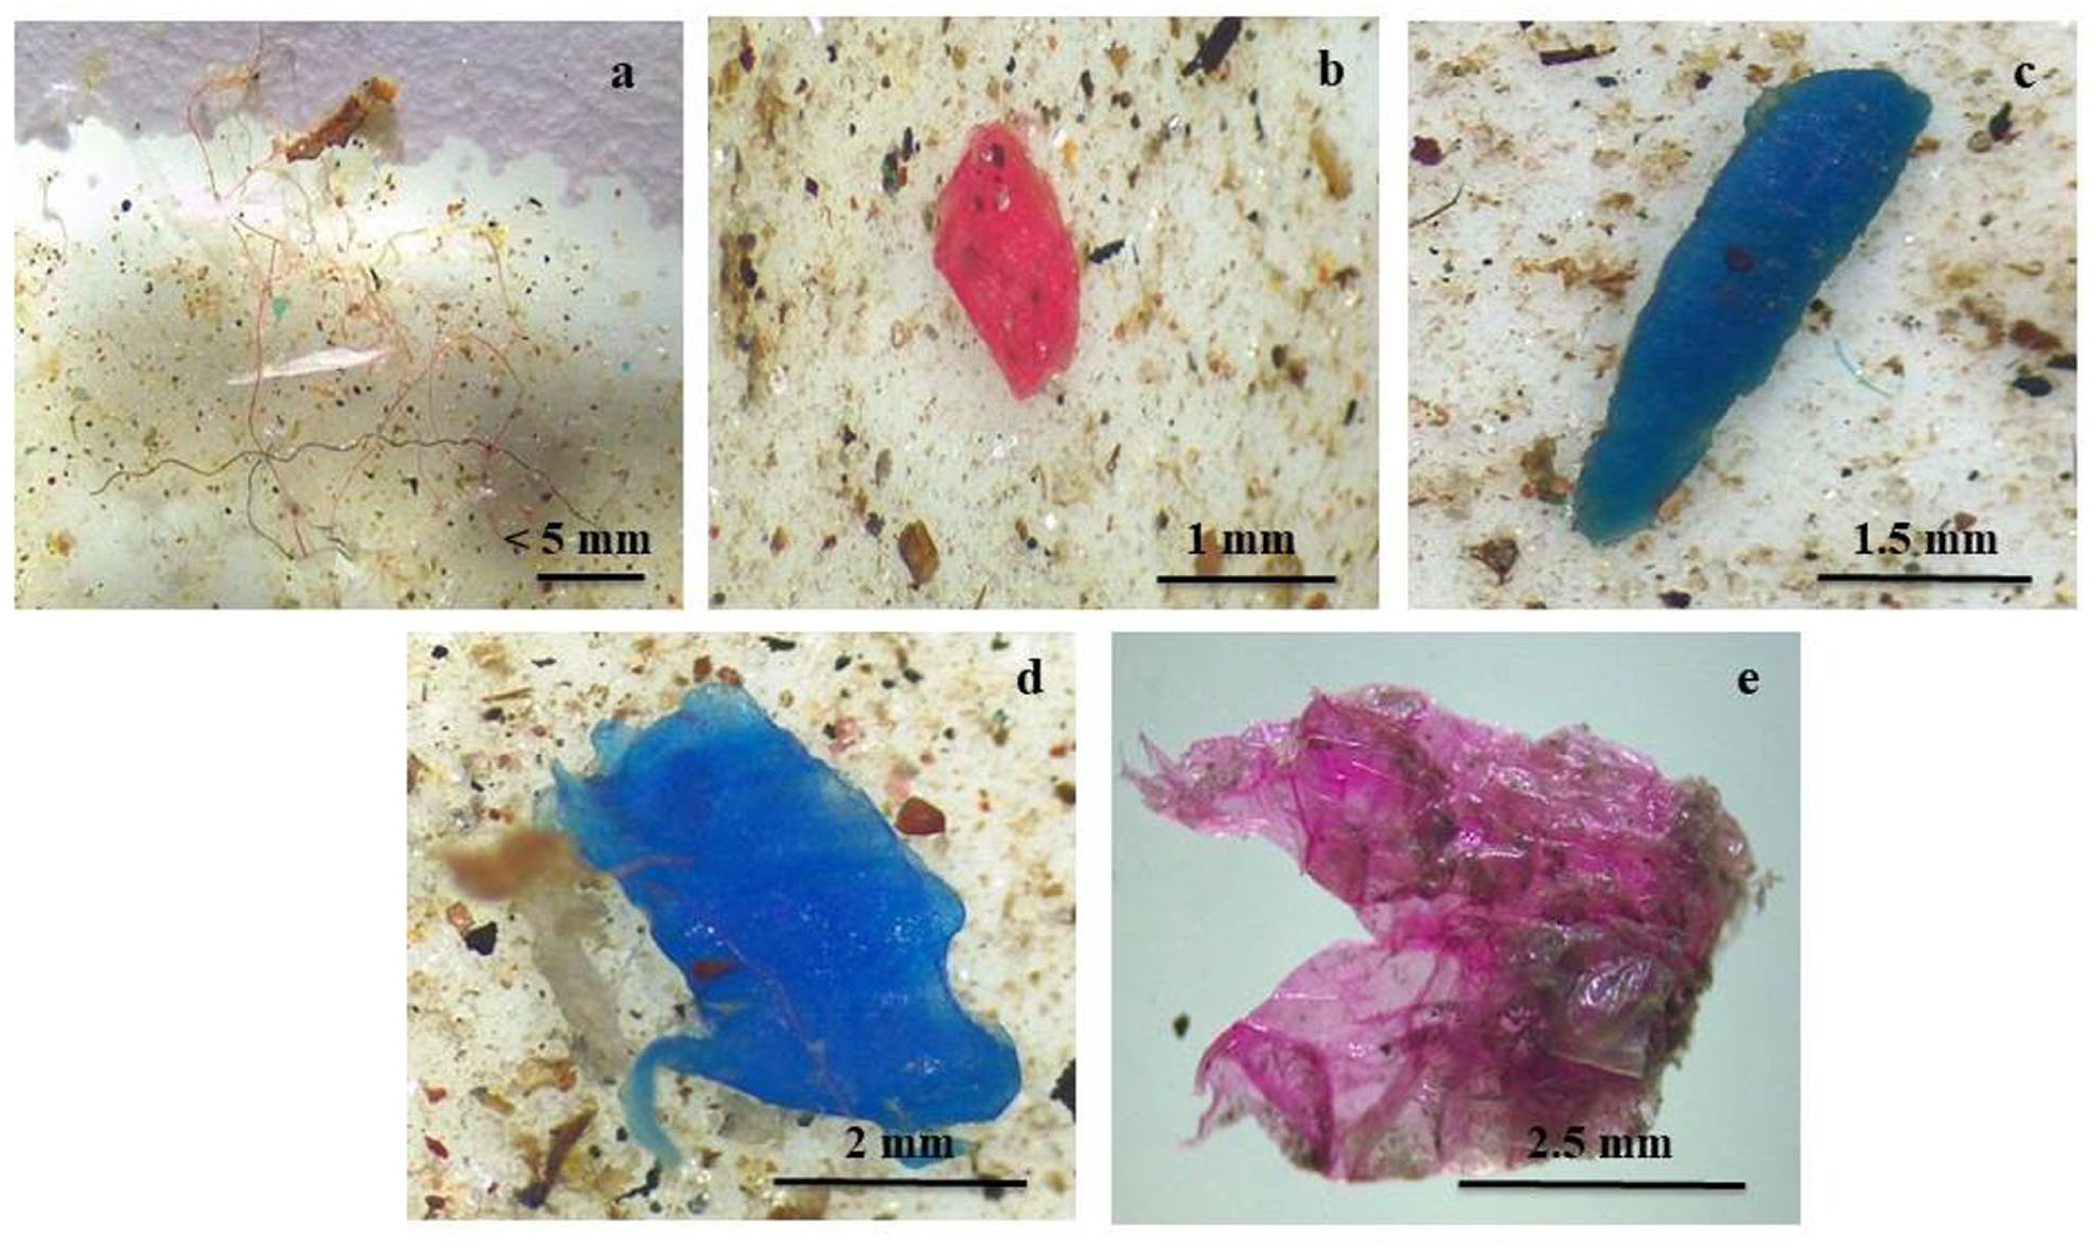
MPs types under a stereo-microscope, namely, fibers (a) and microbeads (b), foam (c), fragments (d) and sheet (e) from the Feni estuary.
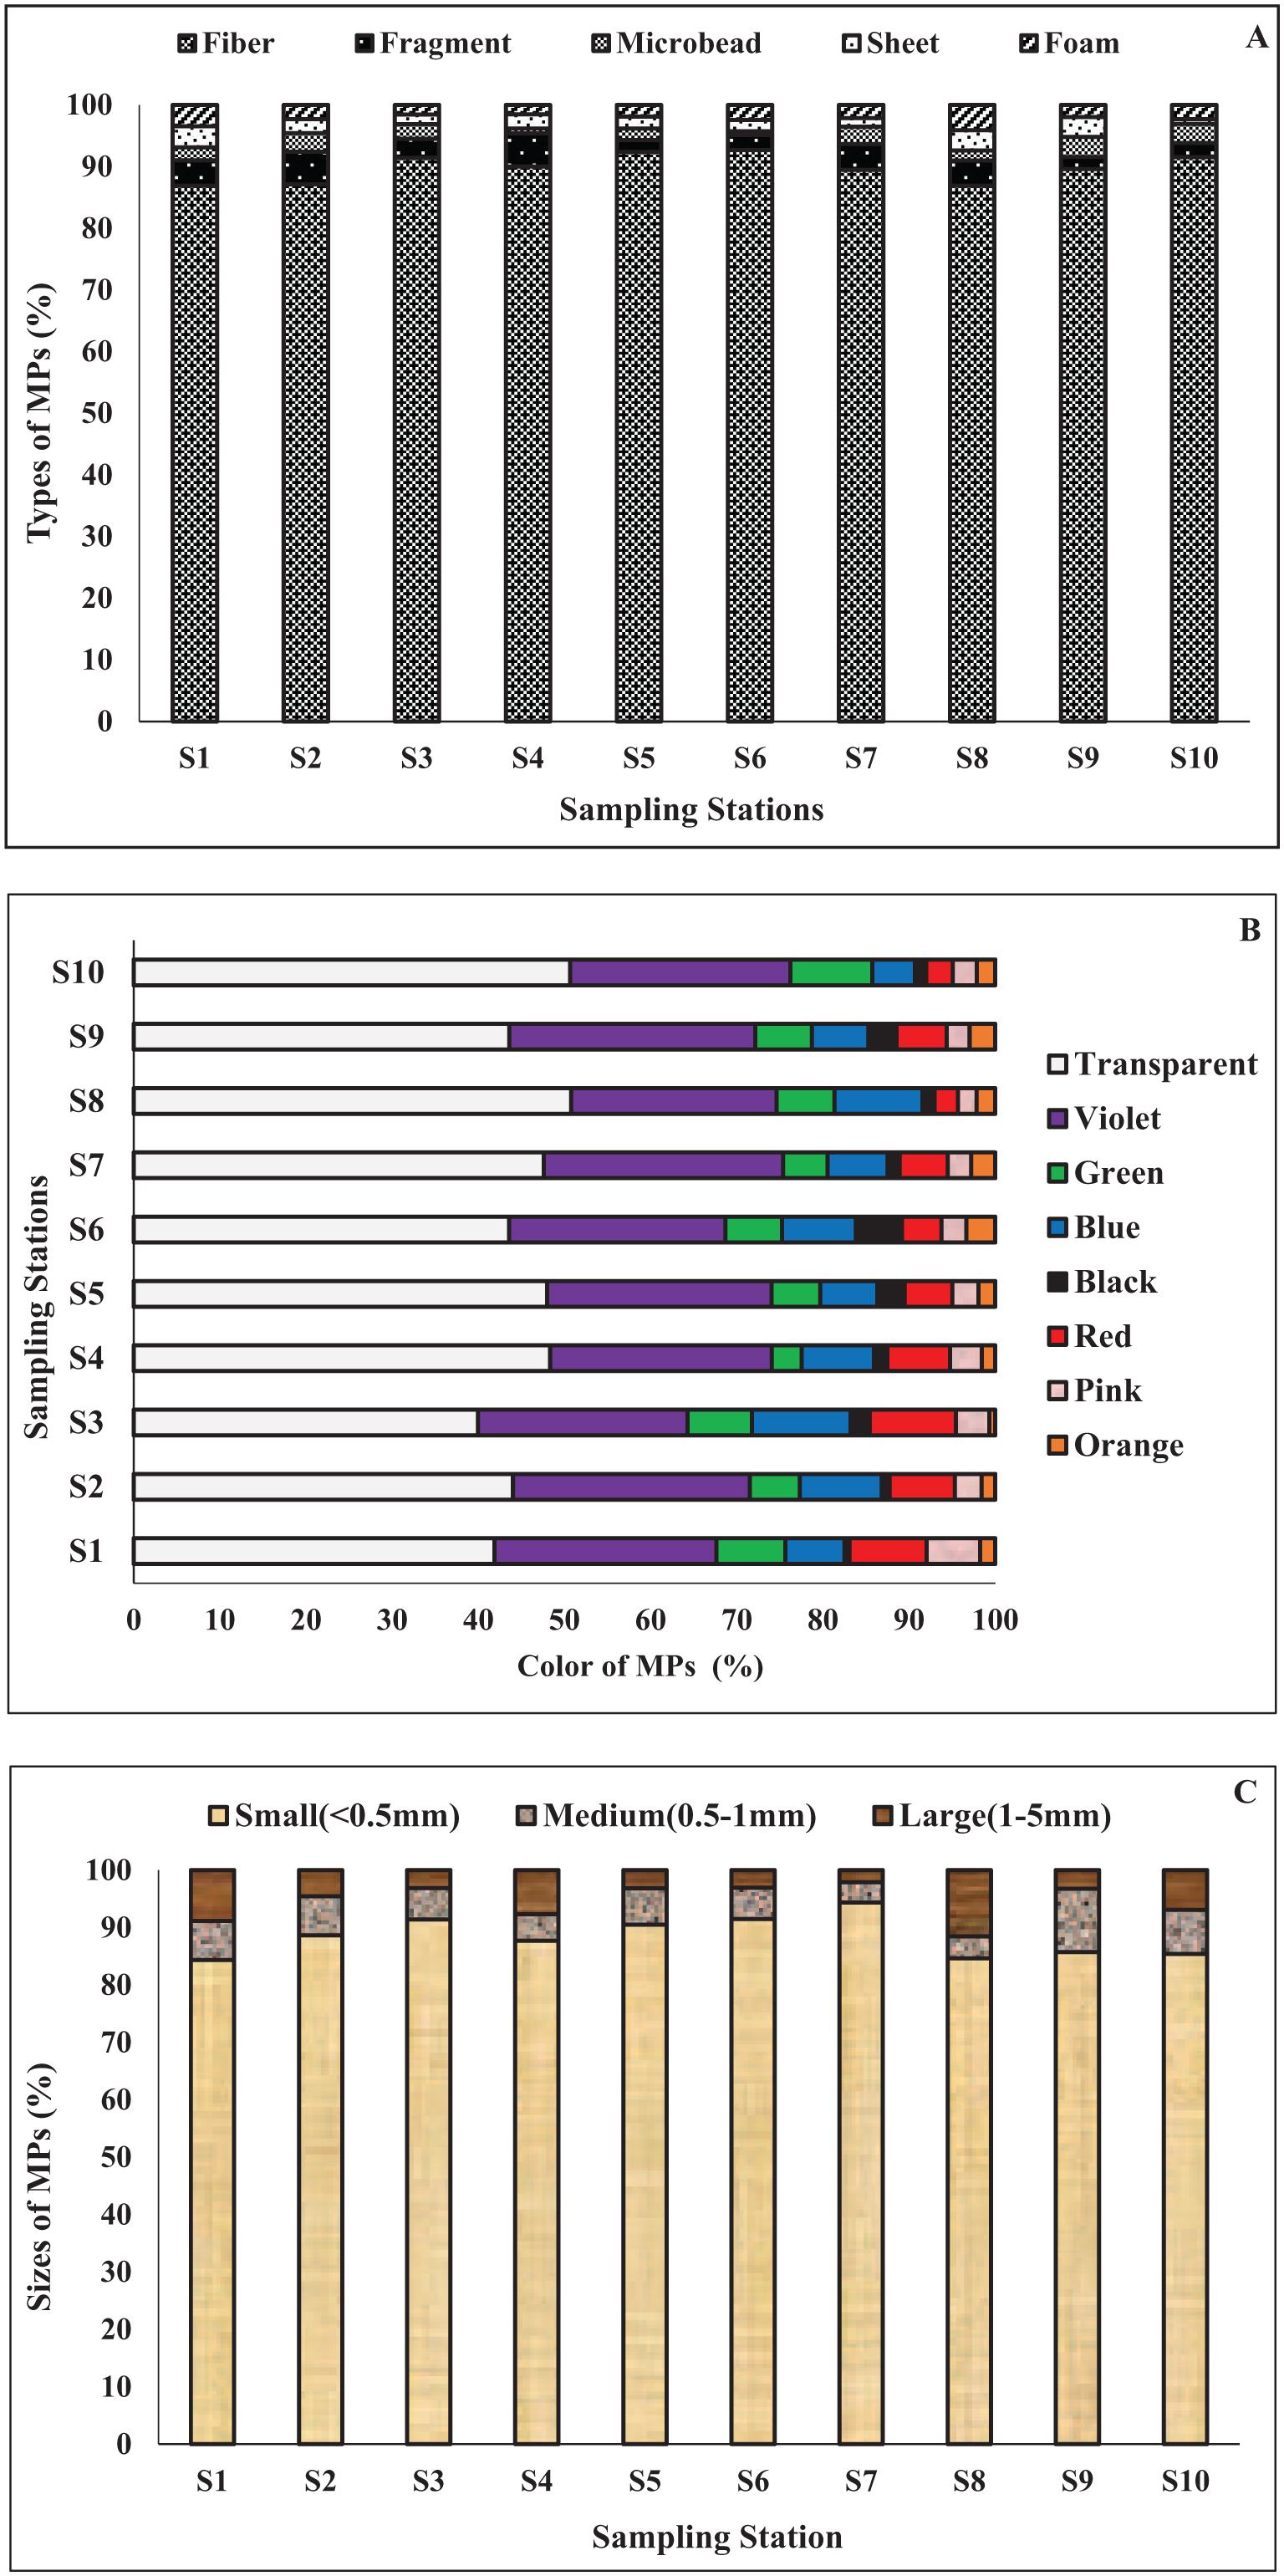
The morphological characteristics of MPs extracted from the water samples: (a) type, (b) color and (c) size.
MPs exhibit a wide range of colors, reflecting their diverse plastic sources or products (L. Li et al., 2019). A total of eight colored MPs, for example, transparent, violet, blue, green, red, pink, black, and orange, were recorded in the present study. Violet was found to be abundant, whereas orange had the lowest abundance. Transparent MPs constituted the predominant color (~40%–45%), succeeded by violet (~10%–20%), with smaller percentages of green (~5%–10%), blue (~5%–8%), red (~3%–7%), black (~2%–5%), pink (~2%–4%), and orange (~1%–3%) observed at all sampling stations (Figure 4(B)). The results of our research demonstrated that violet particles were the only particles with substantial spatial variation (p < .05). The transparent color of MPs were mostly found in all samples, which is similar to the findings of freshwater studies of the Beijing and Pearl River Delta regions, the North and West Rivers of Guangdong Province, China (Sun et al., 2021), South China (G. Wang et al., 2021), the Tuojiang River basin, China (G. Zhou et al., 2020), the Ganga River, India (Singh et al., 2021). Transparent MPs are highly prevalent in aquatic ecosystems due to their origin from widely used transparent plastic products, as well as the gradual weathering and bleaching of colored plastics, which lose their pigments over time and eventually resemble transparent particles, allowing them to persist in the environment (A. Lusher, 2015; Weis, 2020).
Larger plastic items degrade into smaller fragments under environmental forces such as UV radiation, temperature fluctuations, physical abrasion (waves, wind, etc.), and biological activity (Dimassi et al., 2022). In this study, MPs in surface samples were grouped into three size classes: <0.5, 0.5 to 1, and 1 to 5 mm. The majority were <0.5 mm (88.41% of total MPs), with a mean abundance of 415.99 ± 101.08 items/m3. These very small particles are particularly abundant and widespread due to their ease of transport, longer environmental residence times, and the difficulty of effective removal or remediation (Hale et al., 2020). The 0.5 to 1 mm fraction accounted for 6.61% of MPs, while the 1 to 5 mm fraction represented 5.42%. The relative proportions of each size class are illustrated in Figure 4(C).
Chemical Composition (Polymer) of the MPs From Feni Estuary
Characterizing MPs based on their polymer composition provides essential insights into pollution levels and potential source pathways in the Feni River Estuary. FTIR analysis revealed that the recovered MPs were primarily composed of four polymer types: PE, PS, PP, and PET identified through their diagnostic absorbance peaks (Figure 5).

FTIR spectra of the selected MPs shows different polymers in the Feni river estuary.
The study revealed that PET constituted the predominant MP type at 78%, followed by PE at 10%, PP at 7%, and PS at 5%. The significant prevalence of PET likely indicates considerable human-generated contributions from beverage containers, food packaging, and textile waste. Local sources, including untreated effluents from textile and packaging businesses, are likely contributors to pollution in the Feni River estuary, as noted by Islam et al. (2018), who reported substantial industrial contamination in this area. The physical features of PET, which are susceptible to fragmentation through thermal and oxidative degradation, further promote its disintegration into MPs under environmental stressors (Das & Tiwari, 2019). Its environmental longevity and extensive application in consumer products render it a prevalent contaminant in estuarine ecosystems (Nisticò, 2020). Fardullah et al. (2024) corroborated that PET is the predominant polymer in the coastal sediments of Bangladesh. Again, over time, these products may deteriorate due to exposure to external factors, including heat and sunlight, which may eventually cause MPs to be released into the environment (Wu et al., 2023). On the other hand, improper disposal, rainwater runoff from streets, sidewalks, and urban surfaces can carry PE and PP into stormwater drains. Leachate can be produced in landfills that contain plastic trash derived from these polymers (Lutz et al., 2021). This fluid, which is frequently tainted with MPs, has the ability to seep into groundwater and reach adjacent rivers, which then enter larger streams. The polymer types identified in this study were compared with those reported in other river systems globally. In the Haihe River, China, polyethylene (PE), expanded polystyrene composite (EPC), polyamide (PA), and polypropylene (PP) were the dominant MPs polymers (Liu et al., 2020). In contrast, the Tsurumi River in Japan was primarily contaminated by alkyd, PET, PE, PP, and polymethyl methacrylate (PMMA), highlighting regional variability in polymer composition linked to differing anthropogenic inputs and usage patterns (Kameda et al., 2021). Globally, PE and PP are the most prevalent polymers, consistent with reports of surface waters from the USA, France, and China (Constant et al., 2020; Lenaker et al., 2019; L. Li et al., 2019).
Pollution Status and Ecological Hazards of Identified MPs in the Study Area
Pollution Load Index (PLI) and Contamination Factor (CF) of MPs
The PLI and CF are utilized in the assessment of MP risk to precisely measure the degree of pollution and evaluate the comparative levels of contamination in various environmental compartments. The PLI offers a comprehensive assessment of pollution levels by combining data from various contaminants. This makes it valuable for doing comparative analyses across different locations. CF assists in determining the distinct impact of different pollutants, allowing for precise management and mitigation approaches to address MPs contamination.
The pollutant load index > 1, indicating significant MPs contamination and suggesting that the Feni River estuary is environmentally polluted by MPs (Figure 6). This also implies that the levels of plastic particles found in the area are significant enough to be considered a form of pollution. The CF results (1 ⩽ CF < 3) also clearly showed that all the sampling sites in the river were significantly polluted with MPs as the values exceeded 1 (Figure 6). When comparing the PLI and CF values of the Feni River estuary with those of other estuaries such as the Karnaphuli, Meghna, and Matamuhiri River estuaries, the Feni River estuary showed lower PLI and CF values (Banik et al., 2024; Rakib et al., 2021). This was likely due to lower urbanization and reduced industrial discharges in the Feni River estuary. However, the utilization of only the PLI and CF values to assess the ecological risk of MPs in the study region is subject to some limitations. These measurements may not accurately consider the harmful impacts of MP polymers themselves and may underestimate the influence of MPs on river pollution. PHI values can suggest more specified hazards related with MPs.

Pollution load and risk assessment of MPs in surface water samples from the Feni river estuary.
Potential Hazards of MPs Based on Polymer Hazard Index (PHI) of the Identified MPs
The PHI is employed to assess and communicate potential ecological and health risks posed by different polymer types in specific environments (L. Huang et al., 2023). In the Feni River Estuary, PHI scores ranged from 0.1 to 9.1 (Figure 7), placing the detected polymers within hazard categories ranging from grade I (<1) to grade II (1–10), indicating low to moderate contamination risk. With a moderate potential hazard index falling into Category II, PS presented a significant risk to ecological health in the estuary. Additionally, PET and PE posed a moderate risk to ecological health in the examined waters, as evidenced by their highest hazard scores. In contrast, PP exhibited PHI values in Category I (PHI <1), signifying a minimal health risk in the investigated areas (Miller et al., 2020).

The polymer hazard index (PHI) and polymer percentage of identified plastic pollution in this study.
Comparing the PHI results between the Feni River estuary and other estuaries showed significant differences in levels of hazard risks and the related environmental concerns. When comparing the data supplied by Banik et al. (2024), it was found that the Feni River estuary in Bangladesh had low PHI values. This indicates that there is a relatively low to moderate level of risk in that area. In contrast to other estuaries in Bangladesh, such as the Meghna River estuary (PHI = 1,583), Karnaphuli River estuary (PHI = 133), Matamuhuri River estuary (PHI = 1,300), Bakkhali River estuary (PHI = 2,380), and Naf River estuary (PHI = 31,580), which have considerably higher PHI values (Banik et al., 2024; Rakib et al., 2021), this estuary stands out due to its lower PHI value. The elevated values seen in large estuaries indicated that there were higher quantities of MPs, which were presumably affected by more intense industrial and urban activity in these water bodies. The Yellow River in China has a wide range of PHI values, varying from 4 to 1,382.22 (T. Zhou et al., 2024). This variability in this estuary was a result of the river’s enormous catchment area and the presence of several sources of plastic pollution. Conversely, the Feni River estuary had lower PHI values from this estuary, indicating a comparatively lower level of human-induced effects and fewer MPs inputs in comparison to other estuaries. This phenomenon can be attributed to decreased urbanization, diminished industrial activity, and potentially improved waste management in nearby regions. Nevertheless, even when the PHI values are lower, it is still necessary to monitor and implement proactive management techniques to limit the environmental implications of MPs contamination on aquatic ecosystems.
Pattern and Pollution Source Identification by Multivariate Analyses
PCA demonstrated station-wise differences in MP contamination throughout the Feni River Estuary, with the first two components (PC1 and PC2) collectively accounting for 70.5% of the total variance (Figure 8(A); Table 2). PC1 (42.8%) classified the sampling sites into two distinct clusters: sites S3, S4, S5, and S10 exhibited substantial positive loadings, signifying significant contributions from industrial effluents and aquaculture-related activities, where MPs likely originated from packaging materials, fishing gear, and aquaculture inputs. Conversely, sites S2 and S7 exhibited significant negative loadings, indicating MPs predominantly introduced by terrestrial runoff and land-based trash contributions. PC2 (27.7%) significantly differentiated household and municipal influences from aquaculture-related sources. Sites S1, S6, and S9, exhibiting positive loadings, were linked to sewage and urban waste contributions, whereas S5 and S8, displaying negative loadings, represented aquaculture and fisheries operations, including net abrasion and feed bags. The PCA revealed unique MPs source fingerprints throughout the estuary, indicating that industrial effluents, aquaculture activities, riverine runoff, and municipal garbage jointly influenced the spatial distribution of MP contamination throughout the system (X. Li et al., 2018; Peng et al., 2018).

The outcomes of multivariate analyses derived from MP abundance data collected at 10 sample sites (S1–S10) in the Feni River Estuary. The figure (A) displays a principal component analysis (PCA) plot, whereas the figure (B) depicts a hierarchical cluster dendrogram.
Loading Scores, Eigenvalue, and Cumulative Variance Percent of PCA.

The hierarchical cluster analysis (HCA) revealed clear spatial grouping of microplastic (MP) contamination across the estuary (Figure 8(B)). Clustering was performed using Ward’s hierarchical agglomerative method with Euclidean distance. The dendrogram showed the presence of two main clusters. Cluster I included stations S1, S6, S2, S7, S9, S3, S8, S10, and S5, whereas Cluster II consisted exclusively of station S4, indicating its distinct MP contamination characteristics relative to all other sites. Within Cluster I, two well-defined subclusters were evident. Subcluster I comprised stations S1 and S6, suggesting a high degree of similarity in MP contamination patterns between these locations. Subcluster II grouped stations S2, S7, S9, S3, S8, S10, and S5, reflecting a second group of sites with comparable MP characteristics but clearly separated from Subcluster I. The isolation of station S4 as the sole member of Cluster II indicates a localized and distinct MP contamination signature, separating it from the general estuarine pattern represented by Cluster I. This clustering structure highlights spatial heterogeneity in MP distribution across the estuary and supports the presence of site-specific contamination at S4.
The clustering pattern substantiates the PCA results, confirming that MPs contamination in the estuary is influenced by various sources, including land runoff, home trash, industrial operations, and aquaculture, all contributing to regional variability (X. Li et al., 2018; Dris et al., 2015). The combined application of PCA and HCA confirms the spatial variability of MPs pollution and emphasizes the influence of hydrodynamic processes and terrestrial inputs in determining contamination patterns across the estuary.
Conclusion
This study offers the first thorough assessment of MP contamination in the surface waters of the Feni River Estuary, establishing essential baseline data on abundance, polymer composition, spatial distribution, and associated concerns in a subtropical estuary environment. MPs were predominantly consisted of fibrous, small-sized particles (<0.5 mm), primarily consisting of PET, suggesting significant terrestrial contributions from consumer plastics and secondary fragmentation of bigger debris. Quantitative indices (CF, PLI) indicated considerable contamination with varied loads among stations, whereas polymer-specific hazard scores classified PS as a high-risk polymer and PET and PE as intermediate ecological risks. These findings emphasize that polymers contribute disproportionately to ecological risk, highlighting the necessity for polymer-specific management strategies. Multivariate studies (PCA and HCA) validated that the distribution of MPs was non-uniform, influenced by a confluence of terrestrial discharges, aquaculture, industrial operations, and estuary hydrodynamics, illustrating the complicated and diverse character of plastic pollution. Collectively, our findings indicate that estuarine MPs are affected by both localized human activities and natural transport mechanisms. The outcomes stress the immediate necessity for localized management measures and additional study on sediments and biota to comprehensively evaluate the ecological and human health risks associated with MP contamination. These findings correspond with the objectives of the Bangladesh National Plastic Action Plan, which promotes the mitigation of plastic leakage into the environment by improved waste management, augmented monitoring, and strategic policy interventions in high-risk regions such as estuaries. Future research should look at MP ingestion by ecologically and economically significant fish species in the region, such as Hilsha (Tenualosa ilisha), to enhance understanding of possible hazards to aquatic food webs and consequences for food safety and human health.
Supplemental Material
sj-docx-1-asw-10.1177_11786221261429893 – Supplemental material for Microplastic Contamination in a Freshwater-Dominated Subtropical Estuary: Multi-Approach Assessment of Spatial Dynamics, Sources and Ecological Hazard
Supplemental material, sj-docx-1-asw-10.1177_11786221261429893 for Microplastic Contamination in a Freshwater-Dominated Subtropical Estuary: Multi-Approach Assessment of Spatial Dynamics, Sources and Ecological Hazard by Sribush Mojumder, Jahanara Akhter Lipi, Yusuf Ali, Salma Sultana, Partho Banik, Yeasmin N. Jolly, Jimmy Yu, Takaomi Arai, Norhayati Ngah and Mohammad Belal Hossain in Air, Soil and Water Research
Footnotes
Acknowledgements
Assistance from all volunteers from the LEEB is highly appreciated.
Ethical Considerations
This study did not involve any human or animal subjects, nor did it have any direct implications for such, as it was based solely on the analysis of surface river water samples. According to international ethical guidelines, such research does not typically require formal ethical approval. However, the research was officially approved and supervised by the Department of Fisheries and Marine Science, Noakhali Science and Technology University (NSTU), as part of the first author’s undergraduate thesis project.
Author Contributions
Conceptualization, M.B.H., J.A.L.; methodology, P.B., Y.N.J., M. Y. A., and S.M.; software, S.M.; validation, Y.N.J., M.B.H.; investigation, S.M., P.B. S.S. and S.M.; writing—original draft preparation, S.M., J.A.L., M.B.H., S.S. and S.M.; review and edit, M.B.H., J.A.L., Ngha, Y.A., J.Y. and T.A.; funding acquisition, T.A. All authors have read and agreed to the published version of the manuscript.
Funding
The authors disclosed receipt of the following financial support for the research, authorship, and/or publication of this article: This study was supported by Universiti Brunei Darussalam Faculty/Institute/Center Research Grant (UBD/RSCH/1.4/FICBF/2024/074).
Data Availability Statement
Data are provided in the article and will be available upon request.
Supplemental Material
Supplemental material for this article is available online.
References
Supplementary Material
Please find the following supplemental material available below.
For Open Access articles published under a Creative Commons License, all supplemental material carries the same license as the article it is associated with.
For non-Open Access articles published, all supplemental material carries a non-exclusive license, and permission requests for re-use of supplemental material or any part of supplemental material shall be sent directly to the copyright owner as specified in the copyright notice associated with the article.