
Abstract
Microplastics (MPs) are a growing threat to aquatic ecosystems, yet research and regulations often treat all plastics as one homogenous group. This overlooks critical distinctions, leading to regulatory gaps and inconsistent research that hinders risk assessment and environmental modeling. This review proposes a prioritized list of plastic and MP types based on available data. Factors like usage, waste generation, existing regulations, toxicity (including additives and monomers), ease of identification, and degradation mechanisms are considered. We identified polyester, polyamide, acrylic fibers (PES/PA/PAN), polyethylene (PE), polyethylene terephthalate (PET), polyvinyl chloride (PVC), and polystyrene (PS) as top priorities. The extensive use and short lifespans of single-use PP, PE, and PET products lead to significant waste generation. Except for PE, all prioritized polymers have potentially toxic additives or monomers. PET and PVC pose isolation and identification challenges, while PVC, PET, and PA readily fragment into MPs. Among MP forms, fibers are a top concern due to high production volumes, potential for containing toxic additives, and difficulty in identification. Spherical MPs, primarily originating from direct production, warrant focus for regulatory efforts. Based on the analysis of the available data, we propose recommendations to develop stronger and more relevant regulations and key research opportunity areas to advance our understanding of MPs in the environment. By prioritizing specific plastic types and MP forms, we can achieve greater efficiency in addressing the growing problem of plastic pollution.
Graphical abstract
Introduction
The widespread emergence of plastics in the 1950s marked a significant turning point in human history. Today, plastic has become a pervasive component of our environment, thanks to its practicality as a lightweight, versatile, oxygen/moisture-resistant, and cost-effective material (Andrady, 2011). Unfortunately, over 86% of plastics generated end up in landfills, open dumps, or water bodies due to inadequate waste management, illegal dumping, and environmental runoff (X. Zhang et al., 2020). Plastics take hundreds of years to decompose completely, and over this decomposition period they break down into smaller pieces that reach micrometric size called microplastics (MPs). MPs are plastic particles that measure between 1 and 5 mm in their longest dimension and can be categorized into two main types based on their origin. Secondary MPs form when larger plastic items, like bottles or bags, break down over time in the environment. Primary MPs, on the other hand, are deliberately manufactured for specific uses, such as for cosmetics (Van Wezel et al., 2016) . The widespread presence of MPs in all water bodies tested has raised serious concerns about their impact on wildlife and flora. Studies even suggest potential health risks for humans (Ambrosini et al., 2019; X. Zhang et al., 2020). However, significant knowledge gaps remain regarding MP concentration in the environment. Additionally, factors like MP type, size, form, and the presence of adsorbed compounds, which may amplify potential risks, require further investigation (Stock et al., 2021).
The diverse physical and chemical properties of MPs pose a significant challenge to their detection, isolation, and identification (Lambert & Wagner, 2018). Current techniques often struggle to capture the full spectrum of MPs in the environment, leading to significant knowledge gaps about their concentrations (Jin et al., 2022; Q. Yu et al., 2020). These limitations arise from two key issues. First, some separation methods damage certain types and forms of plastics, potentially causing underestimation (Prata et al., 2019). Second, some identification methods may overlook a portion of MPs entirely (Sá et al., 2018). These incomplete analyses hinder our ability to conduct focused toxicity tests, establish relevant regulations, and develop realistic environmental models for assessing the impact of MPs on human and environmental health.
Prioritizing the most relevant types and forms of plastics and MPs based on specific criteria would not only help researchers develop more homogeneous, standard, and precise methodologies for collecting, separating, and identifying MPs from the environment (Horton & Svendsen, 2017), it would also equip policymakers, consumers, and industry leaders with valuable tools for making informed decisions regarding regulations, product modifications, and production strategies. Although there are several reviews regarding different MPs’ characteristics (e.g. Karimi Estahbanati et al., 2021), environmental concentrations (e.g. Horton et al., 2017), analytical methods (e.g. Shim et al., 2017), effects on organisms (e.g. Sá et al., 2018), and recently, prioritization reviews on toxicity (Gouin et al., 2022; Yuan et al., 2022), sources, and emission (National Institute for Public Health and the Environment (RIVM), 2014), an approach based on relevant multicriteria to determine which MPs experimental research should focus on is missing. The objective of this article is to compile a list of plastic and MP types warranting increased attention based on drivers that affect their abundance and their effect on environmental and human health.
This article is structured in four sections. The first section includes the methods for determining prioritization strategies and parameters for each analyzed criterion and their respective rankings. Section two includes the results and analysis from each criterion studied, as well as a comparison of the obtained results with existing research or publicly available information. This section also includes the identification of future research directions and regulatory recommendations. The final section provides conclusions and identifies the audience for the review, while acknowledging any limitations.
Materials and Methods
Based on available literature, we first determined key criteria for prioritizing microplastics (MPs) and plastic types. These criteria included plastic use and waste (e.g. Klingelhöfer et al., 2020), plastic regulation (Klingelhöfer et al., 2020), MP toxicity related to size, form, and type (Rios-Fuster et al., 2023), plastic toxicity due to additives and monomers (Yuan et al., 2022), current methods for identifying MPs in the environment (e.g. Jenkins et al., 2022; Jin et al., 2022; Q. Yu et al., 2020), and polymer thermo- and photodegradation (Hernández et al., 2023). Next, we developed a semi-quantitative approach based on specific questions and search strategies, using Scopus and Google Scholar as well as official websites and reports for sources of information (see Table 1B in Supplemental Material B), and established ranking parameters for each criterion. Parameters for plastic usage/waste, plastic regulations, and MP toxicity based on size, form, and type are explained in sections 3.1, 3.2, and 3.3 in this document. Parameters for additive and monomer toxicity can be found in Tables 2B and 3B of Supplemental Material B. Ranking parameters for pre-treatment and identification methods used in current experimental methods for MPs in the environment are detailed in Table 7B of Supplemental Material B and parameters for polymer degradation are provided in Tables 10A and 11A of Supplemental Material A. The final list of priority plastics was then analyzed, and the results were compared to published information. Figure 1 offers an overview of the methodology.

Summarized methodology followed in this study.
Results and Discussion
The following sections present the results for each MP prioritization criterion.
MP prioritization based on plastic use and plastic waste generation
Mismanaged waste is a major culprit for MP pollution in water bodies (Mitrano & Wohlleben, 2020). To effectively address this issue, identifying the most commonly discarded plastics is crucial. This review takes a comprehensive approach, considering data on plastic usage, sectors with major consumption, waste management practices, and product lifespans for plastic goods in key regions like North America, China, India, and the European Union (EU). Data sources include reports from the OECD (2022), Geyer et al. (2017), and Ryberg et al. (2019).
Figure 2 illustrates the percentage of plastic used and discarded by different sectors, categorized by product lifespan (sector’s definition and the types of plastics they include are presented in Table 1A of Supplemental Material A). This distinction is crucial because mismanaged plastic waste from these sectors significantly contributes to water body pollution. Poor waste management practices are a major concern, exceeding 80% in developing countries like India and Pakistan, and over 70% in China, the world’s largest plastic waste generator (Ritchie & Roser, 2018). Details on the data used to create Figure 2 and the methodologies employed in this section are available in Supplemental Tables 2A to 5A.
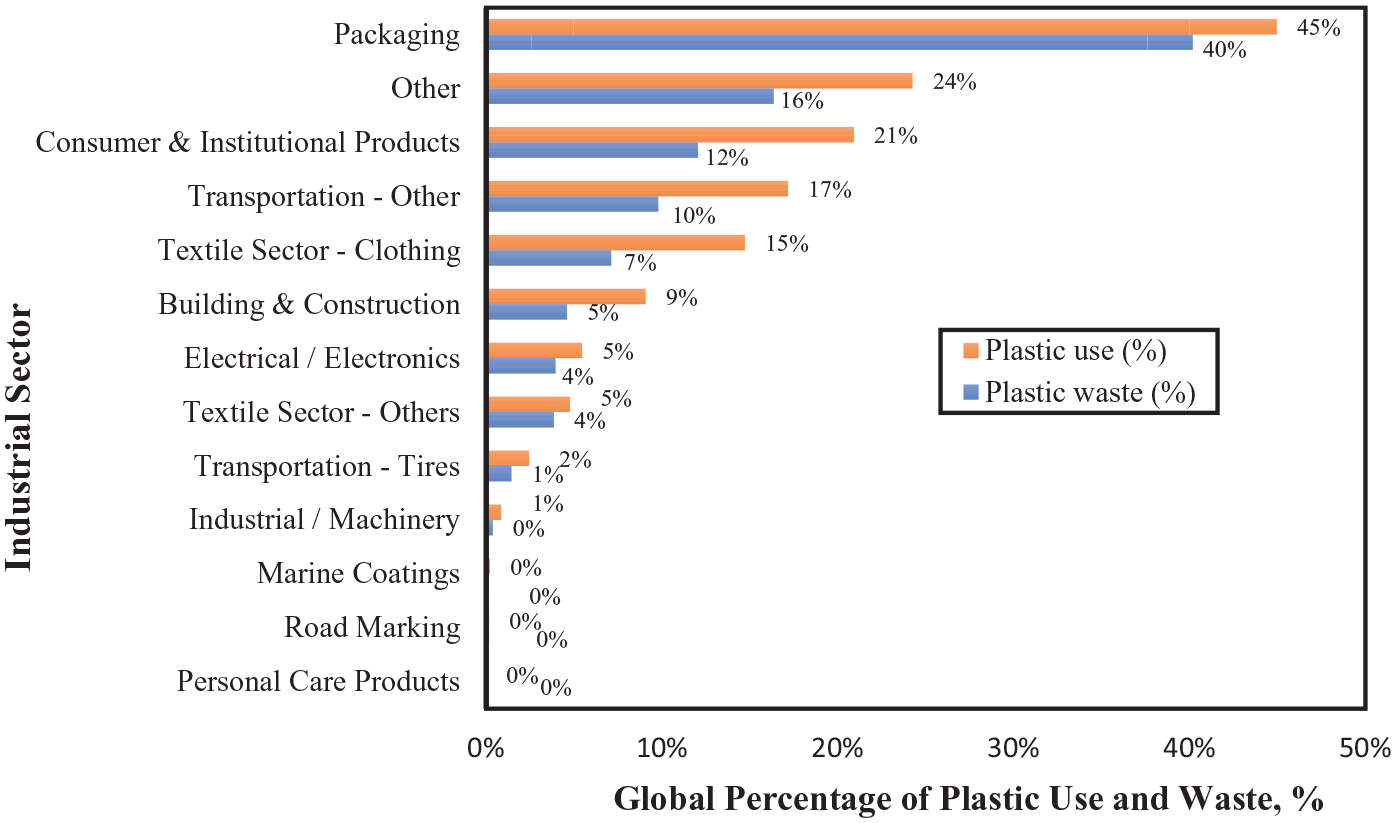
Percentage of plastic use and plastic waste estimated by industrial sector in 2019 (with data from OECD, 2022).
A closer look at Figure 2 reveals some key insights. Packaging, typically disposed of within a year, dominates plastic waste generation, accounting for 45% of the global annual total. Similarly, textiles and consumer/institutional products, with lifespans of less than 5 years, contribute significantly, at 12% and 11% of annual plastic waste, respectively (Geyer et al., 2017). In contrast, sectors like building and construction, electrical and electronics, and industrial/machinery have longer lifespans, resulting in a lower contribution to annual plastic waste generation (Geyer et al., 2017). While sectors like marine coatings, road markings, and personal care products represent a smaller portion of overall plastic waste due to lower production volumes, it is important to note that most plastics within these sectors have short lifespans and are discarded annually (Ryberg et al., 2019).
Based on the results from Figure 2, the top 4 sectors (excluding “other”) that generate the most plastic waste were selected: packaging, consumer and institutional products, textiles-other/clothing (combined), and transportation-other/tires (combined). Based on polymer percentages within each of these sectors, detailed in Supplemental Table 4A, the amount of plastic waste by polymer type was estimated (Figure 3). This analysis aimed to identify the types of plastic that warrant prioritization for intervention strategies.
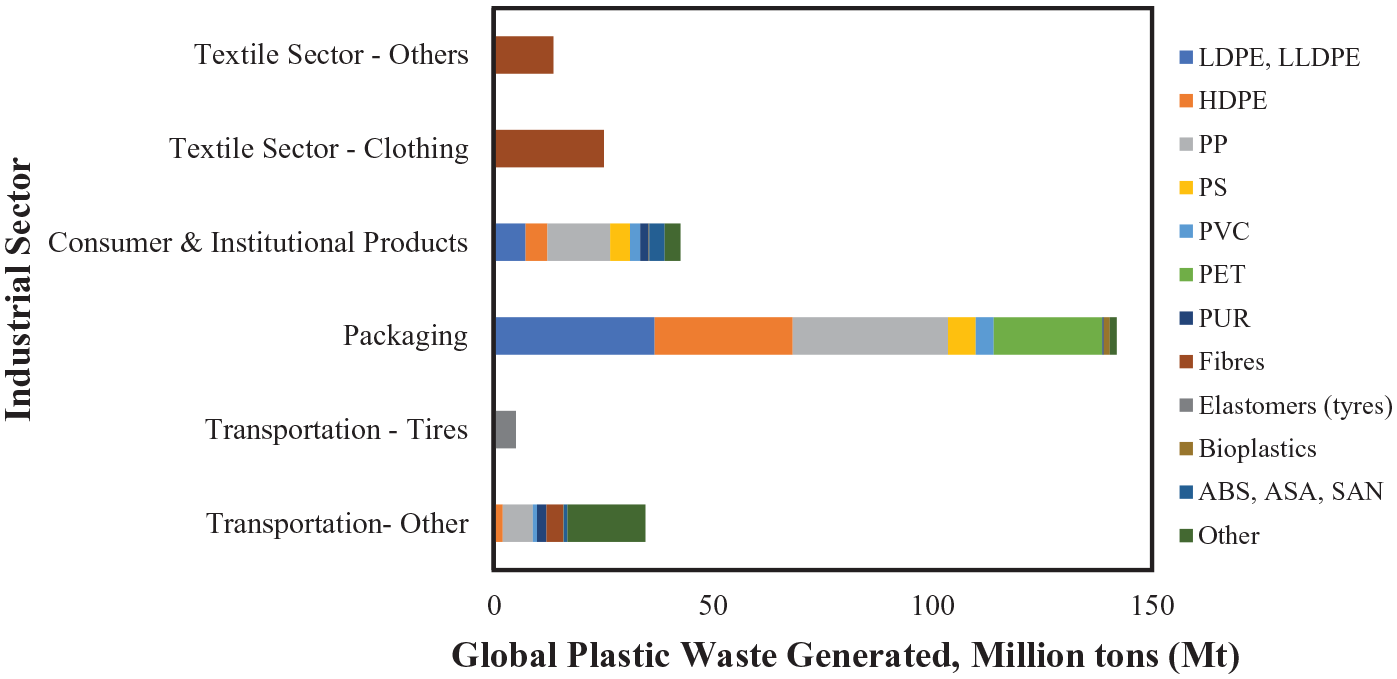
Global plastic waste by industrial sector and polymer type in 2019. Own elaboration with data from OECD (2022), Geyer et al. (2017), and Ryberg et al. (2019).
As observed in Figure 3, the plastics in the packaging sector are mainly PE (HDPE, LDPE, LLDPE), PP, and PET; in the consumer and institutional sector, PP and PE; in the transportation sector PP, elastomers (tires), fibers, and PUR (OECD, 2022; Ryberg et al., 2019); and in the textile sector PES, PA, and PAN fibers (Geyer et al., 2017). These are the polymer types that were used for the final prioritization in this section (see the detailed process in Supplemental Tables 4A and 5A).
It’s important to acknowledge that the plastic usage patterns analyzed in this section, based on the work of Geyer et al. (2017), predate the COVID-19 pandemic. Consequently, the substantial increase in both the quantity and types of plastics generated during this global health crisis is not fully accounted for. To address this gap, an additional section has been added to specifically address the types and quantities of plastics that have emerged since the pandemic.
Plastics produced and disposed of during the COVID-19 pandemic
Prior to the COVID-19 pandemic in 2020, the use of personal protective equipment (PPE) was largely confined to healthcare settings. However, the pandemic triggered a surge in single-use plastic consumption for items like masks, gloves, gowns, and specific packaging materials. Additionally, pandemic-related home-confinement led to an increase in takeout food and packaged home deliveries, further contributing to the global plastic waste burden.
According to Peng et al. (2021), an estimated 8.4 ± 1.4 million tons of plastic waste were generated due to the pandemic across 193 countries by August 23, 2021. Of this amount, an estimated 25.9 ± 3.8000 t entered the world’s oceans, representing approximately 1.5 ± 0.2% of the total global riverine plastic discharge, from which:
● 87.4% was estimated to have come from hospitals (Peng et al., 2021), including:
○ Surgical masks: PP, PS, PC, and PES
○ Others: PE, PP, and PET (Correia Prata et al., 2020)
● 7.6% came from PPE used by individuals, including:
○ General masks: PP, PUR, or polyacrylonitrile
○ N95 masks: PP and PET
● 4.7% was related to packaging from home delivery products, including:
○ Multilayer materials, EPS, plastic film, or adhesive tape (Bastos de Sousa, 2021).
● 0.3% included COVID-19 test kits which contained the following plastics:
○ PP, PE, PES, and PET (Seif et al., 2021)
The pandemic’s impact on plastic use was uneven across sectors (OECD, 2022). While sectors like transportation and construction saw a 10 Mt decline, healthcare and packaging experienced an increase. This shift is concerning because pandemic-generated plastics often have the shortest lifespans, reaching the environment quickly and posing a threat to wildlife as documented by Peng et al. (2021). Therefore, stricter regulations and enhanced plastic waste management practices encompassing pandemic-related waste are crucial.
The list of the types and forms of priority plastics based on their use, annual waste generation, and associated sector is presented in Table 1. Each polymer is assigned a score from 1 to 5, with 5 representing the highest level of annual waste generation.
Priority Ranking of Plastics (Types and Forms) Based on Waste Generation.
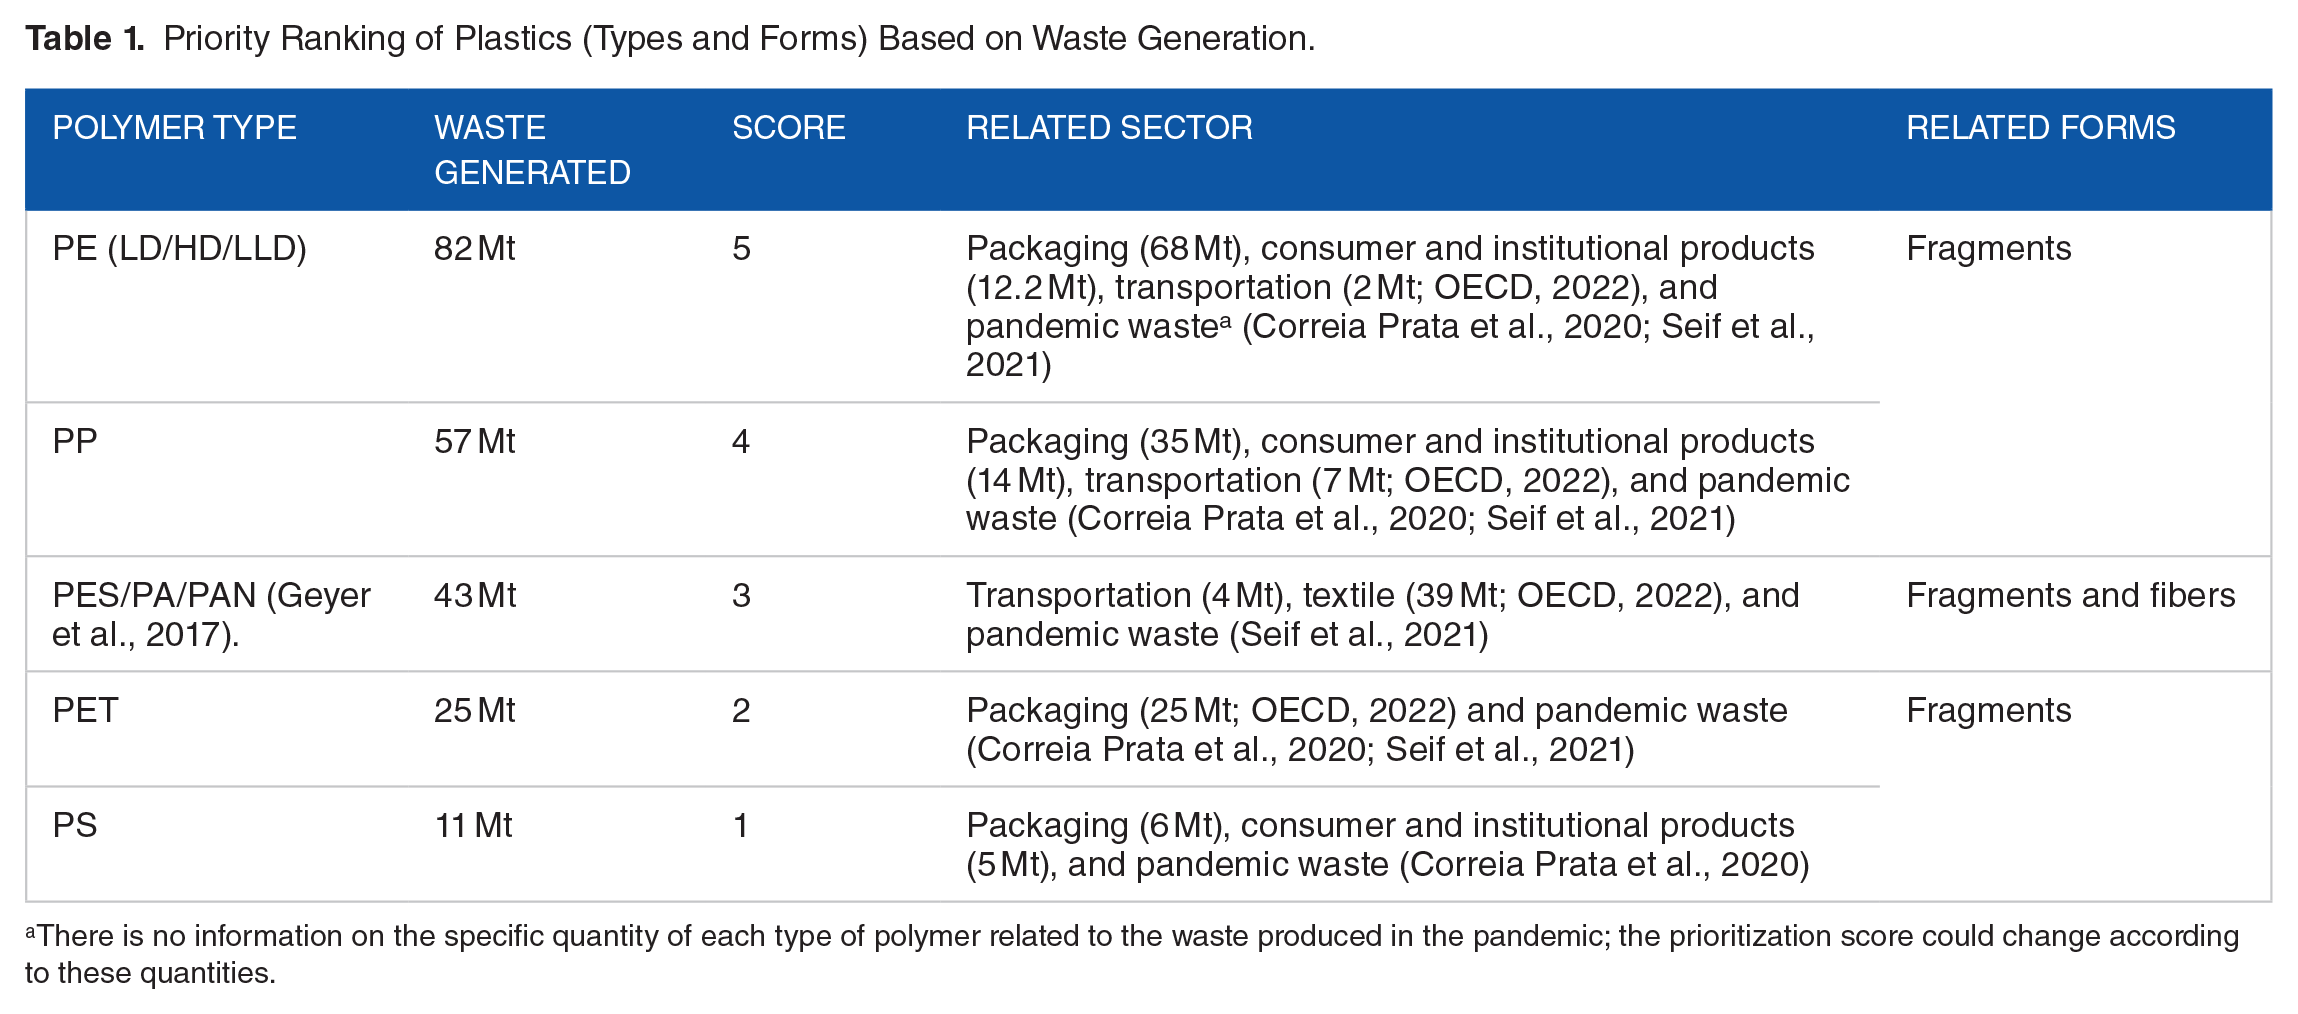
There is no information on the specific quantity of each type of polymer related to the waste produced in the pandemic; the prioritization score could change according to these quantities.
This section analyzes plastic use and disposal patterns, highlighting the concerning amount of plastic waste generated. However, it is important to acknowledge that a significant portion of this waste problem could be mitigated through the implementation of appropriate management strategies. These strategies include adequate landfill disposal (where appropriate), waste reduction at the source, reuse of plastic products, robust recycling programs, and proper incineration with energy recovery (PlasticsEurope & EPRO, 2008). Research suggests that countries with established regulations and practices in these areas demonstrate significantly lower levels of plastic pollution in water bodies (Plastics Europe & EPRO, 2008).
MP prioritization based on macro-and micro-plastic regulations around the world
Current regulation on plastics
Existing plastic regulations often target items identified as litter in natural environments (European Commission, 2019). This focus aligns with the findings of the previous section, which highlighted sectors like packaging and institutional/consumer products as major contributors of short-lived plastics. Consequently, many countries and states have implemented regulations specifically aimed at “single-use plastics” (European Commission, 2019; UNEP, 2021).).
Common regulatory strategies for single-use plastics used at the international level are: (a) bans and restrictions of use, manufacture, or imports; (b) economic instruments, such as taxes; (c) standards, certification, and labeling programs to promote responsible production and use; (d) product end-of-life management legislation, including Extended Producer Responsibility (where producers are responsible for the management of their products at the end of their life cycle (OECD, 2021)), reuse and recycling, or take-back and deposit-refund schemes; and (e) additional strategies that include education, alternative materials, and public involvement (UNEP, 2021).
While significant efforts are underway to tackle plastic waste and pollution, several policy challenges remain (OECD, 2022; UNEP, 2018b, 2021). These challenges include: (a) loopholes in existing regulations, such as exemptions for so-called “biodegradable” plastics that only degrade under specific, uncommon environmental conditions, or permits for certain plastic applications; (b) unintended consequences of regulations, where restrictions on one type of plastic can inadvertently promote the use of unregulated alternatives that may be equally or even more harmful to the environment; (c) lack of supporting regulations in many countries, hindering effective implementation of existing policies; and (d) a persistent focus on end-of-life management (primarily consumer behavior) rather than tackling the problem at its source. More stringent production controls, such as restrictions on virgin plastic use or mandatory minimum percentages of recycled content, are needed (OECD, 2022; UNEP, 2018b, 2021).
Since single-use plastics are a major target for existing and emerging regulations (e.g. European Union Directive 2019/904 on reducing the impact of certain plastic products on the environment), they represent a logical entry point for stricter controls. This focus is strategic because many single-use plastic products are considered replaceable and non-essential. Prioritizing stricter regulations on their production can lead to significant reductions in plastic waste generation.
The analysis of global regulations on single-use plastics (Alam et al., 2018; L.A. County, 2022) reveals a clear pattern. Plastic bags, primarily made from low-density polyethylene (LDPE) or high-density polyethylene (HDPE) – both prioritized polymers from section 1 – are the most regulated single-use items worldwide (in 127 out of 192 countries studied). This focus is reflected in Table 2, where PE receives the highest score.
Polymer Type Priority Ranking Based on Current Regulations on Plastic Products.

Regulations also encompass a broader range of single-use items, such as cutlery, bottles, trays, containers, straws, plates, cups, and packaging (UNEP, 2018a). These products are typically made from PE (LDPE/HDPE), polystyrene (PS), expanded polystyrene (EPS), polyethylene terephthalate (PET), and polypropylene (PP). Since these polymers are not exclusive to bags, they are assigned the second-highest priority score in Table 2.
Current regulations on primary microplastics (1° MPs)
While plastic bans often target single-use items, a growing concern is the intentional addition of primary microplastics (1° MPs) to commercial products. Unlike larger plastics or secondary microplastics (formed from the breakdown of larger plastics), 1° MPs are designed to be µm-sized and cannot be collected or recycled before entering the environment. Recognizing their environmental impact, scientists called for their removal from personal care products (PCPs) in 2012 (Dauvergne, 2018). Since then, many countries have implemented or proposed regulations to restrict 1° MPs in specific products (UNEP, 2018a, 2018b). Notably, the European Union is leading the way with a proposal to restrict their use across consumer and professional products (Proposal to Regulation (EC) No 1907/2006 amending Annex XVII of the European Parliament and the Council concerning the Registration, Evaluation, Authorization, and Restriction of Chemicals (REACH) related to synthetic polymer microparticles (2022)).
Bans on intentionally added 1° MPs typically target their sale, distribution, or use in products. Yet, this approach varies from country to country, as does the definition of MPs and the specific products to which the regulation applies. Most countries that have regulations for primary microplastics (MPs) focus solely on the personal care products (PCPs) market. Consequently, for this review, the data primarily focuses on the PCP market, as it currently has the most readily available information on regulations and restrictions for 1° MPs.
A vast array of polymers with different properties are used in personal care products (PCPs; Leslie, 2014). These polymers can be thermoplastics or thermosets (like silicones), homopolymers, copolymers, or blends. They vary significantly in size (from microscopic to millimeters), chain length, degree of cross-linking, and molecular weight. The added microplastics themselves can also have various shapes, such as spherical, sponge-like, or irregular.
For our current prioritization strategy, we focus on spherical microplastics because they are most likely to be intentionally added 1° MPs released into the environment. Building on this concept, the European Chemicals Agency (ECHA, 2019) provides a comprehensive list that serves as the foundation for our work. This list, verified against other databases (CosmEthics, INCI, Que CHoisir), includes 520 polymers commonly used in cosmetics. For Table 3, we specifically selected polymers with a prevalence exceeding 5% in all PCPs (both leave-on and rinse-off products).
Polymer Priority Ranking Based on the Most Common MPs on the INCI Database.

The polymers identified in Table 3 as the most prevalent in PCPs are prioritized for potential regulation due to the lack of existing regulations on specific plastic types in these products. Each polymer is assigned a score from 1 to 5 based on its frequency of occurrence.
However, current MPs regulations in the PCP market face challenges, as the definition of a microplastic can vary between regulatory bodies. For example, the European Commission’s draft amendment to Annex XVII (2022) defines a microplastic as a solid particle ranging from 0.1 to 5 µm, which may exclude certain polymers in Table 3 that exist in a semi-liquid state (e.g. Carbomer). These loopholes could allow thousands of products containing unregulated polymers to remain on the market (Dauvergne, 2018).
While PCPs are a focus of MPs research, they are not the only source of 1° MPs. Significant emissions also come from the healthcare sector, paints, industrial processes, and plastic production itself. These emissions are estimated to be higher than those from PCPs, yet receive less research attention (Boucher & Friot, 2017). Another under-regulated source is tire and textile wear, which contributes the most 1° MPs found in the oceans (OECD, 2021). Recommendations offered by the OECD (2021) for mitigating textile or tire related MP emissions include: (a) source-directed interventions (sustainable design and manufacture); (b) use-oriented interventions (best use practices like eco-driving and optimal laundering parameters) and mitigation technologies (e.g. filters); (c) end-of-life interventions (separate collection schemes and waste management); and (d) end-of-pipe interventions (improved wastewater, stormwater, and road runoff management). However, to create effective regulations, more comprehensive data is needed on the specific types and quantities of microplastics used or emitted (OECD, 2021).
Toxic Effects based on size, shape, and plastic type of MPs
Several reviews related to toxicology have already been published (World Health Organization, 2022). For this reason, this section will not be a repetition of this information. Instead, some observations and recommendations are made for future lines of research.
MPs are known to have diverse toxic effects such as hematological, hepatic, neurological, digestive, reproductive, antioxidant, metabolic, and others (Guerrera et al., 2021). They can also be transported through the food chain and accumulate in some species (Saeedi, 2023). However, despite numerous studies, the precise mechanisms of MP toxicity remain unclear.
When performing toxicological studies for regular chemical compounds and establishing safe concentrations for humans, some uncertainties are considered according to the taxonomic groups covered by the species studied, the type of study carried out (short, long-term, or statistical (SSD)), and/or the sample size, among others (ECHA, 2008). These uncertainties are then corrected with an extrapolation value called “Assessment Factor (AF).” However, unlike traditional chemical testing, current MP studies lack consistent controls for factors like particle concentration, color, size, and shape of the polymer. These variations can significantly influence results.
Through the assessment of the different toxicological studies, it can be observed that MPs’ toxicity varies due to: (a) direct aspects of MPs, such as their morphology, size, type, concentration, and their agglomeration dynamics; (b) indirect aspects of MPs, including their associated chemicals (monomers, additives, and pollutants), and (c) aspects of the toxicological study like the observed physiological response, the organism analyzed, the conditions under which the organisms are exposed, time, and whether the MP is internalized or the exposure is on the surface of the target organism or organ (Abarghouei et al., 2021; An et al., 2021; H. Cheng et al., 2021).
To improve our understanding of MP toxicity, future toxicity studies should consider: (a) the evaluation of MPs’ “agglomeration,” since this phenomenon increases the “particle” size, causing the same effects as larger particles, and is usually not reported; (b) the standardization of the physiological responses, species, exposure times, and concentrations for MP toxicological assessment; and (c) the consistency of variables or parameters that are not being studied and should remain constant in the toxicological experiment to address the effect of a specific variable of interest. For example, when studying the toxic effects of different MP sizes, other variables (e.g. type, concentration, and morphology) should be held constant to observe the real effect that the size has on the physiological response (Niu et al., 2021; Stock et al., 2021; Wu et al., 2021).
MP morphology and type significantly influence their toxicological effects (Abarghouei et al., 2021; An et al., 2021; H. Cheng et al., 2021). This knowledge can guide regulatory strategies. For example, studies comparing different MP shapes could inform the development of targeted mitigation measures, such as special washing machine filters to capture plastic fibers before they enter waterways (Erdle et al., 2021). Similarly, since spherical MPs are often intentionally added (e.g. in PCPs), prioritizing regulations on this specific shape may be feasible (see section 3.2.2). Furthermore, as discussed earlier, single-use plastics (PE, PS, PET, and PP) are prime candidates for regulation due to their prevalence and manageability.
Future research should focus on the comparative effects of different MP sizes, shapes, and types. Ideally, these studies should incorporate realistic environmental conditions, including current and projected concentrations, and consider long-term exposure scenarios. Understanding the mechanisms of MP toxicity is also crucial. This includes identifying whether the primary toxicant is the polymer itself, associated additives, adsorbed pollutants, physical blockage of organs, or a combination of factors.
MP prioritization based on their added additives and monomers
Different chemical compounds, called additives, are mixed with plastic polymers to give them specific properties, such as improved strength, flexibility, color, or resistance to heat and light (British Plastics Federation, 2022). These additives include plasticizers, heat and light stabilizers, antioxidants, impact modifiers, fillers, flame retardants, and many others. Another key component of plastics is monomers, the building blocks that link together to form the polymer backbone.
Previously, it was thought that plastic polymers, being non-biodegradable, would not interact with living organisms. However, because polymerization reactions are rarely complete, leftover monomers can potentially escape into the environment and become toxic (Feng et al., 2021). Therefore, understanding residual monomers is crucial for MPs prioritization.
While research comparing the toxicity of additives and monomers within MPs is limited, the Norwegian Climate and Pollution Agency’s report on “Hazardous Substances in Plastic Materials” (Hansen et al., 2013) provides valuable information. This report identifies 43 hazardous additives commonly used in plastics, referencing both the Norwegian (Norwegian Priority Substance List of Hazardous Substances) and European Union’s lists of concerning chemicals (“Candidate List of Substances of Very High Concern for Authorization”). Additionally, an article by Lithner et al. (2011) provides comparable data on the toxicity of monomers. By combining information from both sources, an initial prioritization list of monomers and additives was developed.
An initial screening identified 28 additives with the potential to be problematic in water environments. These additives were assessed based on various criteria, including their tendency to accumulate in living organisms, how they move through the environment, how long they persist, their toxicity, and the types of products they are used in Supplemental Material B, Tables 2B–6B.
From this initial list, ten key additives were chosen using a rating system detailed in the Supplemental Materials. Table 4 presents the final prioritization list. Table 4 includes the types of plastics that can contain these ten additives, with a score of 1 to 5 assigned to each plastic based on how many of the ten concerning additives it can potentially contain.
Priority Ranking of Polymers Based on the 10 Most Relevant Additives.
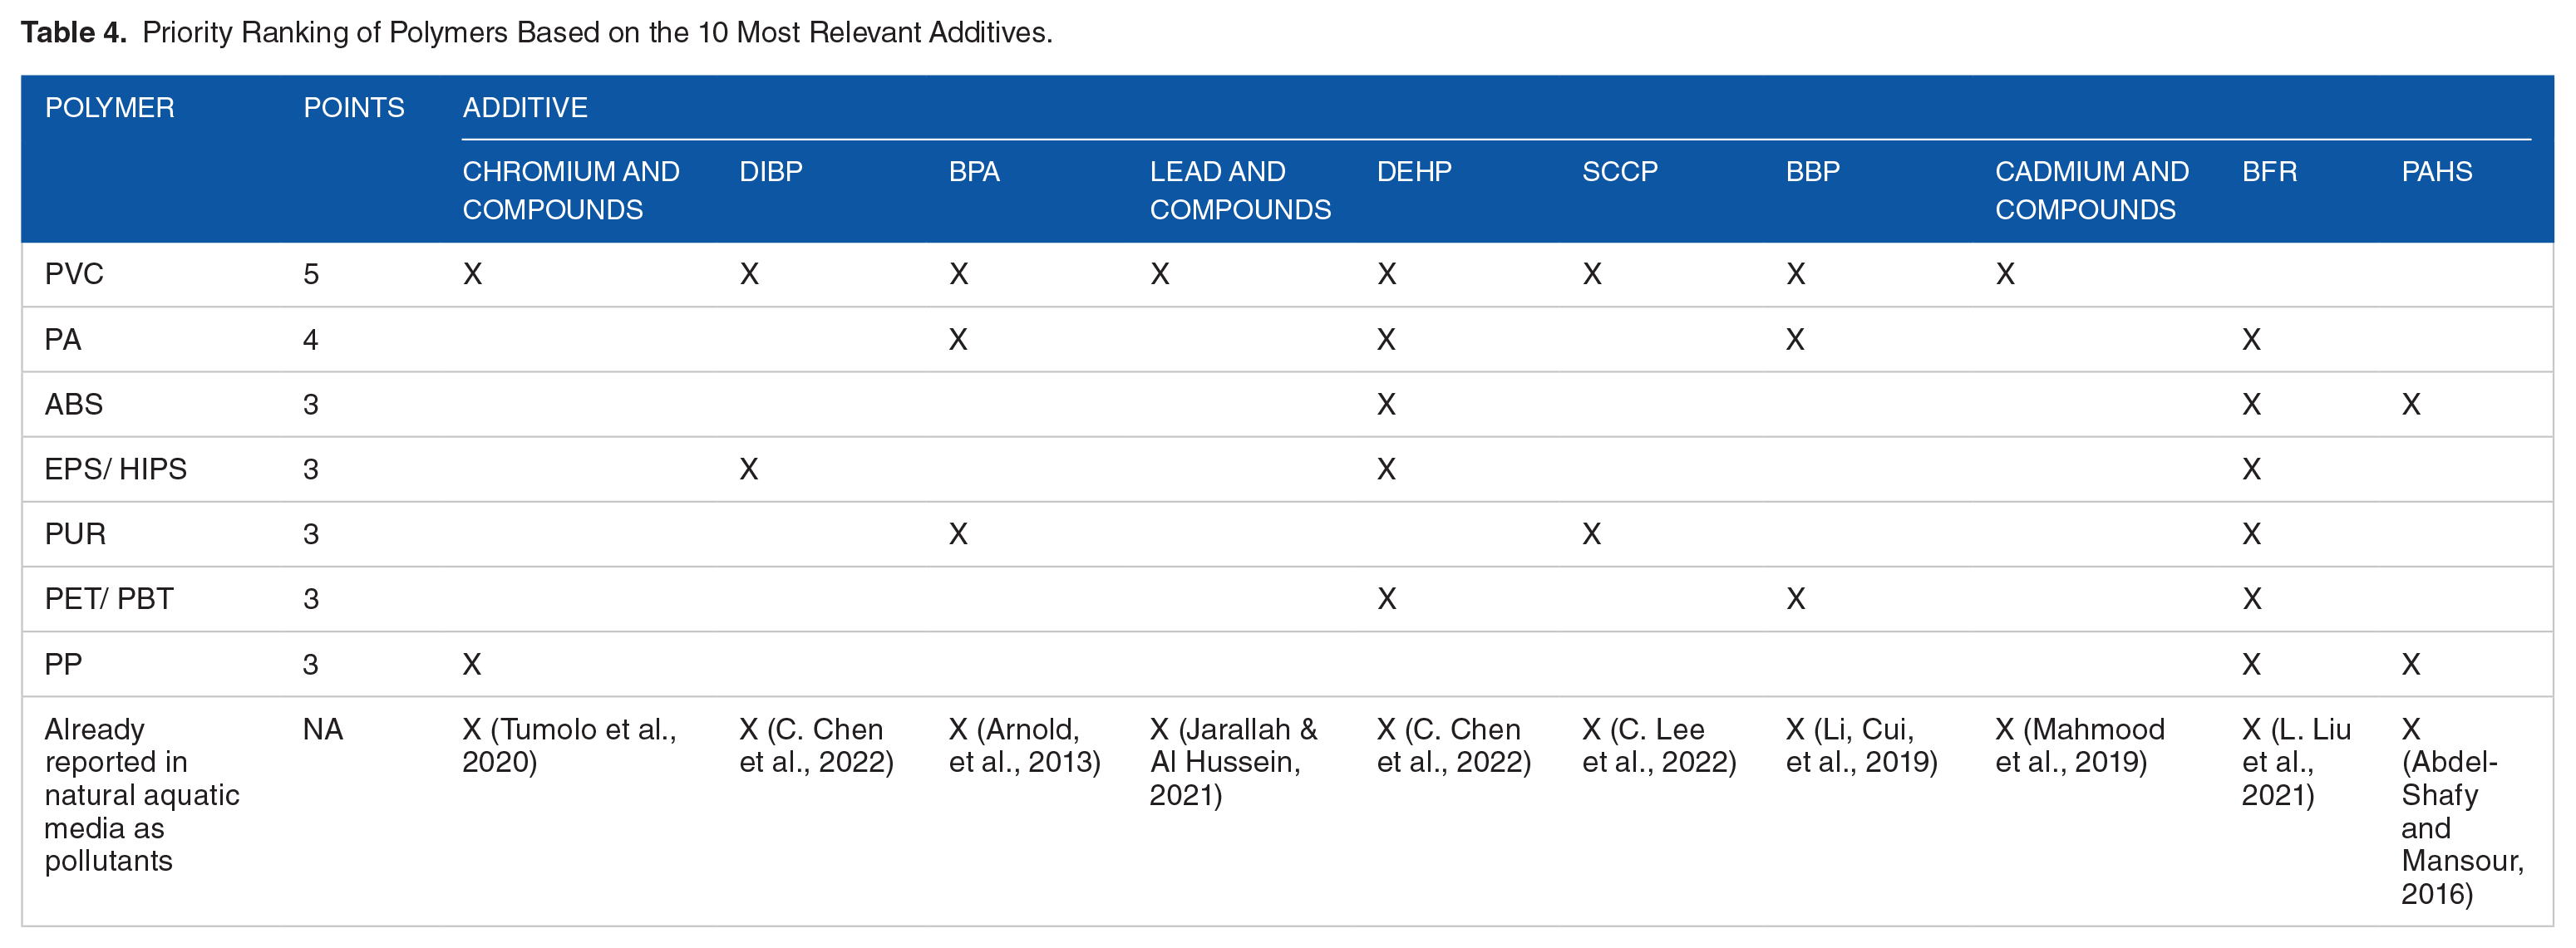
The ten additives identified in Table 4 are not only potentially risky in water environments, but they have also already been detected in real-world aquatic settings, including sediments and water bodies (see bottom column of Table 4). This confirms their presence as environmental pollutants. These additives are used in various products, including packaging (BFR, DIBP, lead, BPA) and textiles (BFR, chromium, DEHP, SCCP), some of the most discarded polymer products globally (as discussed earlier). It is particularly concerning that many of these additives are not strongly bound to the plastic, potentially allowing them to leach out and contaminate water bodies (Hansen et al., 2013).
Following a similar approach to the additives, a shortlist of 39 monomers was created based on the polymers identified in the NCPA report and the Lithner et al. (2011) study. Each monomer was then evaluated using the same criteria applied to the additives (refer to Supplemental Material B, Tables 2B, 4B, and 6B). The eight monomers with the highest scores were chosen for the final prioritization list in Table 5. Similar to the ranking for additives, polymers in Table 5 are assigned scores from 1 to 5, with higher scores indicating the presence of a greater number of these concerning monomers.
Priority Ranking of Polymers Based on the Eight Most Relevant Monomers.

Detected in air.
Detected in algae.
Like the additives, the data in the bottom row of Table 5 suggests that leaching may be occurring for many of these residual monomers. Their presence in the environment indicates that they are not fully incorporated into the final polymer structure.
MP prioritization based on research methods
MP research is challenging due to the wide variety of characteristics of these materials, such as size, forms, and polymer types. As a result, there are no standardized methods for their separation, identification, or quantification. Researchers are adapting MP methodologies based on the sample requirements and the MPs’ nature, which can hinder comparisons between studies. In general, the methodology for MPs’ quantitative analysis consists of sampling, a pretreatment process in the laboratory for isolation, and a final instrumental analysis for quantification and identification (Shim et al., 2017). From the previous steps, variations, or similarities between pretreatment processes for isolation as well as the analytical methodologies used for the quantification and identification of MPs are key to determining whether different studies are comparable. The analysis below addresses which aspects need to be taken into consideration when studying MPs, and which polymers should be prioritized because of difficulties in the pre-treatment or detection and quantification steps.
Pre-treatment
Pre-treatment of the samples is performed to isolate MPs and remove organic and inorganic matter. For instance, in water samples, organic matter like algae, microorganisms, and dissolved organic compounds can mask MPs (Expósito et al., 2021, 2022). In soil samples, the presence of organic matter, minerals, and other debris can complicate the extraction and identification of MPs (Z. Zhang et al., 2022). In air samples, MPs can be attached to various particles or fibers that need to be removed for accurate analysis (Huang et al., 2020).
Different approaches are applied such as acid and alkaline digestion, oxidation, enzymatic digestion, and density separation (Löder et al., 2017; Tagg et al., 2017). However, some of these processes can affect MPs’ characteristics, hindering their identification. Table 6 describes the challenges found during pre-treatment processes to isolate specific MPs (due to changes in their physicochemical properties).
Review of Affected Microplastics After Different Pre-Treatment Processes.

When different approaches are applied for the isolation of MPs such as acid and alkaline digestion, oxidation, density separation, and fluorescence staining, PA, PET, and PVC are the polymers affected by more pre-treatment processes. When exposed to HNO3, HCl, or NAOH, some of the most common chemicals for digestion, all three materials suffer degradation. In addition, SEM analysis showed that the MPs surface morphologies are slightly rough and broken after alkaline digestion, especially for PET (Li, Cui, et al., 2019), while PVC shows changes in color and degradation (Dehaut et al., 2016; Tirkey et al., 2021). Alkaline digestion combined with oxidation leads to slight changes in PET (Budimir et al., 2018) and oxidation of PVC leads to a decrease in the intensity of Raman peaks (Karami et al., 2017). Finally, in most studies, density separation is used to isolate MPs from inorganic matter with NaCl, as recommended by the US National Oceanic and Atmospheric Administration (NOAA; Masura et al., 2015). However, due to the low density of NaCl, high density polymers like PVC and PET cannot be effectively separated.
Polymers affected by two or three isolation processes, showing changes either in morphology or polymer degradation, include PE and PC, followed by PUR.
In addition, MPs morphology also influences their extraction from samples. For example, Li, Wu, et al. (2019) found that spherical MPs are easier to extract than fibrous ones. Additionally, Lares et al. (2019) suggest that PET fibers are more flexible and prone to loss than other fibers because they pass through sieves more easily. Finally, acid digestions have proven to be inefficient at isolating fibers (Claessens et al., 2013). For this reason, we also include fibers in the prioritization list.
Analytical methods for identification of MPs
After the samples go through a pre-treatment process, isolated MPs can be quantified and identified through several techniques. The most common approach consists of visual identification followed by spectroscopic confirmation (Expósito et al., 2021; Hanvey et al., 2017). However, current methods need to be improved or new methods need to be developed to reduce the identification time and effort for micro-, submicro-, or nanoplastics in the environment and obtain more useful physical and chemical information from the analyzed MPs. The most used methods to identify MPs based on microimaging are Fourier Transform Infrared spectroscopy (FTIR), Raman spectroscopy, and scanning electron microscopy (SEM; H. Lee et al., 2023). In addition, thermal methods are currently gaining more attention due to their potential for MPs identification. Nevertheless, each method has its challenges in identifying specific types of MPs, as presented below.
Optical techniques
Visual inspection and quantification of MPs in the samples can be performed simply with the naked eye or using an optical microscope (Song et al., 2015). Although this technique is fast, simple, and inexpensive, it usually leads to an over- or underestimation of MPs due to difficulties in distinguishing between them and other non-plastic particles (Qiu et al., 2016; Song et al., 2015). Transparent or white color fragments can also be challenging to identify with optical microscopy (Song et al., 2015). Furthermore, it is difficult to distinguish between synthetic (e.g. polyester) and natural (e.g. colored cotton) fibers by this technique alone (Song et al., 2015).
Electron microscopy
SEM can provide high-resolution images of plastic particles. In some cases, it is coupled with Energy Dispersive Spectroscopy (SEM-EDS). One of the main limitations of SEM-EDS is that it is time-consuming and expensive, limiting the number of particles that can be analyzed. Moreover, the colors of the particles cannot be used as identifiers in SEM analysis (Shim et al., 2017). This technique is suitable for determining the presence of additives of plastic polymers or adsorbed pollutants onto the MPs’ surface. However, the EDS spectra cannot differentiate between elemental signatures of plastic additives or adsorbed pollutants on MPs surface or both (Dehghani et al., 2017).
Spectral analytical methods: Infrared and Raman spectroscopy
Infrared and Raman spectroscopy are the most used techniques for the characterization of MPs. Raman is a non-destructive technique usually applied for the characterization of MPs down to 1 μm (Ribeiro-Claro et al., 2017), which provides a good response for non-polar symmetric bonds (Lenz et al., 2015). However, Raman spectra can be limited in its use for identification if MP samples have been degraded by UV exposure due to reductions in peak intensity (Lenz et al., 2015). Furthermore, black samples strongly absorb light and produce an intense background emission, requiring different acquisition conditions than other particles. Finally, fibers are more prone to damage (via “burning”) if analyzed at high laser power, and the presence of pigments and additives in MPs can interfere with the spectra and identification of polymers (Nava et al., 2021; Tagg et al 2015, Van Cauwenberghe et al 2013).
On the other hand, infrared spectroscopy can be used to identify particles larger than 10 to 20 μm (Ribeiro-Claro et al 2017) and has a better response for polar groups than Raman (Lenz et al., 2015). It can be said that Fourier Transform Infrared spectroscopy (FTIR) has Raman’s complementary spectrum. However, one of the main limitations of FTIR is that it is easily disturbed by water, leading to low horizontal resolution and complex spectrums; therefore, samples should be dry before identification. μ-FTIR is the combination of microscopy and FTIR for the characterization of MPs (Imhof et al., 2012), with a detection limit below 10 μm. However, this method usually produces a weak signal for MPs of small size (the authors of the article did not establish what “small size” refers to) and has specific requirements on the thickness and characteristics of MPs (Sobhani et al., 2020). For example, very thin or transparent particles may produce weak signals, making their identification and characterization challenging.
Currently, an important disadvantage of Raman and μ-FTIR is the time required for the analysis of individual MPs, as it is done manually. To reduce the identification time, new automated methods need to be developed. For example, Primpke et al. (2017) developed an automated Focal Plane Array FTIR (FPA-FTIR) analysis to reduce the time for data analysis and increase the data quality. The proposed automated method resulted in an increment in the number of polymers found, mainly due to underestimations of PP and PVC recorded by manual analysis (Primpke et al., 2017). However, such automated methods are still under development and are not widely available.
Thermal analysis
In contrast to Raman and FTIR analysis, thermal analysis is a destructive method, providing no information about the size, shape, color, and number of MPs. The main thermal degradation methods used for MPs analysis include pyrolysis-gas chromatography-mass spectrometry (Pyr-GC/ MS), thermal extraction-desorption in combination with gas chromatography-mass spectrometry (TED-GC/MS; Dümichen et al., 2017), and thermogravimetric analysis coupled to differential scanning calorimetric (TGA-DSC) methods (Majewsky et al., 2016).
Pyr-GC is a common technique to analyze the chemical compositions of polymers and has been used to identify different MP types and associated organic additives by analyzing their thermal degradation products. Although some authors have used this technique to effectively identify MPs, this technique does not distinguish between polymer subtypes (e.g. low- or high-density PE; Dehaut et al., 2016). Furthermore, results by Pyr-GC-MS cannot determine the MPs’ number, type, or morphology, as it only analyzes the sample’s polymer mass (Hanvey et al., 2017). Additional limitations of this technique are that the sample size is limited to 0.5 mg and the continuous use of the reaction tube between samples can lead to cross contamination (Ye et al., 2021).
TED-GC–MS can analyze sample weights up to 100 mg and overcome the limitation of sample contamination in Pyr-GS-MS. Still, this method only reaches temperatures of up to 1,000°C, requires pretreatment, and only has good detection results for PE and PP (Ye et al., 2021).
The third most common thermal method, TGA-DSC has been used to detect PE and PP but failed to identify PVC, PA, PES, PET, and PUR due to their overlapping phase transition signals (Majewsky et al., 2016).
Fluorescence staining
Another method commonly used for MP quantification is fluorescent staining. The most common dye that is used for this purpose is Nile Red. However, fibers are not effectively stained using this method (Tamminga et al., 2017) and some polymers are only weakly fluorescent, and, therefore, might not be detected, such as PC, PVC, PUR, and PET (Erni-Cassola et al., 2017).
This work aims to point out the importance of pre-treatment choices and analytical methods for the appropriate identification of MPs, considering that certain types of MPs may be damaged during pre-treatment and identification, and therefore, the results may not be reliable and representative. Moreover, additives adsorbed on the surface of MPs or within the MPs’ structure itself may interfere with their identification, depending on the analytical methods used. Based on the above discussion, Supplemental Table S7B is used for the prioritization of MPs polymers, where the highest score from 1 to 5 is given based on the number of pre-treatment processes by which they are affected and the identification methods that miss detecting them effectively. As a result, PET is the polymer with the highest score on the prioritization list, followed by PVC, PA, and finally PE (see Table 7). Furthermore, in both the pre-treatment processes and identification methods, it stands out that fibers might not be separated or identified effectively, and therefore are also included in Table 7.
Prioritization Determined by the Impact of Various Pretreatment Methods on MPs or the Inability to Detect Them Using Current Identification Methods.

In the case of analytical methods that have limitations for all kinds of MPs, no information was included for the prioritization, but the above information serves as a guide for researchers in this field to pay attention to the choice of identification method used.
MP prioritization based on their degradation in water bodies
Beyond the factors already discussed, such as composition, size, and polymer production, understanding how microplastics (MPs) degrade is crucial. Degradation is a complex process influenced by various environmental conditions (e.g. temperature and light), the specific polymer’s chemical structure, and the presence of impurities or additives within the plastic. Due to limited data on MP degradation, this study focused on assessing the degradation mechanisms and products of the most frequently recurring polymers identified in the prioritization lists from previous sections.
It is important to note that this section does not consider complete degradation. Typically, it is the partial degradation that leads to the formation of MPs (Chamas et al., 2020), and therefore, the more “degradable” the polymer type is, the higher priority it will receive as it will generate more MPs.
As mentioned before, environmental conditions influence the degradation mechanism of polymers. The fragmentation of polymers in the environment has been reported to occur mainly by photo-oxidation, through mechanical forces and/or thermal oxidation (X. Zhang et al., 2021). The first one is more likely to occur in surface water bodies (floating particles), regardless of the temperature; mechanical degradation is likely to occur in plastics settled in sediments and thermal oxidation is more likely to occur in landfills or when buried at higher temperatures.
Photooxidation may occur in polymers with light active functional groups (Decker, 1984; Yousif & Haddad, 2013), such as the phenyl ring in the case of PET or the presence of alkyl halides in PVC. However, light active functional groups can also result from environmental exposure. Da Costa et al. (2018) analyzed the degradation of PE pellets in seawater, in stirred batch reactors, and in the dark. They concluded that this exposure significantly increased the amount of oxidized functional groups on the polymeric structure. Furthermore, the resulting functional groups made the polymer more light-sensitive, which in the long term could lead to the breaking of the polymer into MPs, a process that would be accelerated with mechanical degradation.
Mechanical degradation is based on the disintegration of plastic by external forces that can be caused by collisions and abrasion of plastics with rocks, wind, and waves. It is more common in plastics of higher density or those whose shape affects their transport to the sediments (e.g. plastic bags filled with sand). Although some studies simulate the mechanical stress that plastics experience during their use lifespan to improve the final product, there are very few studies that simulate environmental conditions to observe what happens to the plastic product at the end of its useful life. Chubarenko et al. (2020) reported the results of a group of polymers (LDPE, PS, PP, PS-foam), of varying sizes, subject to mechanical degradation from exposure to different types of sediments, simulating oceanic conditions for 24 hours. For their experiment, the authors used products mostly found in the environment as pollutants. However, as there is not sufficient information regarding the number of MPs attributed to this type of fragmentation for all polymer types studied, this information will not be considered for prioritization. Nevertheless, information is in Supplemental Table 9A for information purposes of the reader.
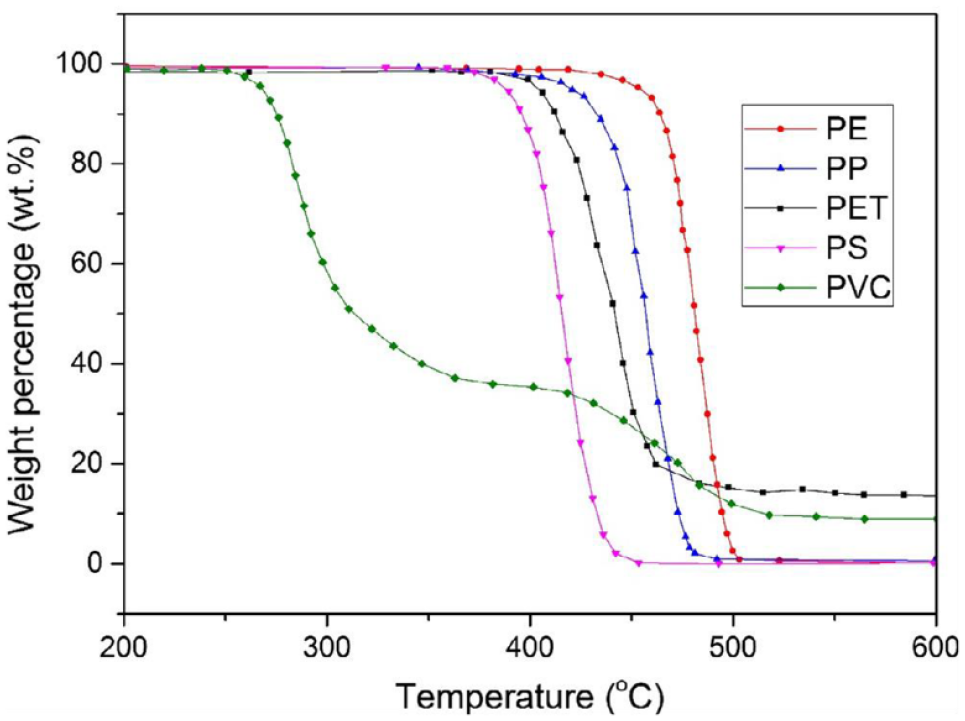
Finally, thermal degradation depends on the stability of the polymers, which is related mostly to the polymeric structure of the material (Figure 4) and its incorporated monomers (diverse stabilizers and antioxidants added to prolong the lifespan of plastic materials and slow down degradation in environmental conditions (Chamas et al., 2020)). In addition, as observed in Figure 4, polymers containing functional groups such as PS, PET, and PVC (see Table 8) fragment at lower temperatures than those containing only carbon and hydrogen in their structure such as PE and PP.
Kinetics of polymer degradation at varying temperature increments. Image reproduced from (J. Yu et al., 2016) “Reprinted from Thermal degradation of PVC: A review, 48. Yu et al., Thermal degradation of PVC: A review, 302, Copyright (2023), with permission from Elsevier.”
Degradation Temperatures and UV Highly Active Groups for Selected Polymers.

Table 8 lists the selected polymers, their respective UV highly active functional groups (if any), and the values found in the literature on the thermal stability of the raw polymeric materials.
Thermal degradation kinetics and the presence of highly active UV groups were used to generate the prioritization list for this section (Table 9), where a higher score was given to polymers that degrade at lower temperatures and to those with more functional groups that accelerate the MP formation (see Supplemental Tables 10A–12A).
Prioritization List of Polymers Based on Susceptibility to Degradation.

Besides the complexity of the degradation mechanism by which a polymer can go through, it is also important to consider the by-products generated during these processes for a complete prioritization. The toxicity of these substances should be evaluated to assess the potential danger they could present to the environment and the health of living beings. However, studies regarding these products are scarce and most focus on the functional groups that are obtained. Another important criterion to consider is degradation time, but no single nor standardized values were found related to this topic. Chamas et al. (2020) reported that degradation rates depend on the specific product (polymers with different additives), polymer type, and the degradation method applied, and proposed some methodologies to homogenize this information. In Supplemental Table 13A the values found for some of the selected plastic materials regarding their surface degradation and estimated half-lives in the marine environment can be observed, as well as some of the diverse families of the degradation products.
While some studies explore the biodegradation of plastics, this complex process involving numerous interrelated environmental factors (Ali et al., 2021) is beyond the scope of the current review.
Cross reference and result summary
This section compares the prioritization results for chosen criteria (plastic use, waste, regulations, additives, research methods, and aquatic degradation) with previously published research and publicly available information. Supplemental Table 14A summarizes the data from Tables 1 to 5, 7, and 9, presenting polymer types and their scores for each criterion.
Global estimates of plastic are limited, with several current studies using the same references as this review, or reporting total plastic waste, disregarding polymer type (e.g. Lau et al., 2020). However, in Table 10, we compare our findings with two national estimates of plastic waste for China and the USA, which include polymer-type information.
Comparison of Most Discarded Polymer Types Between This Study and National Estimates.
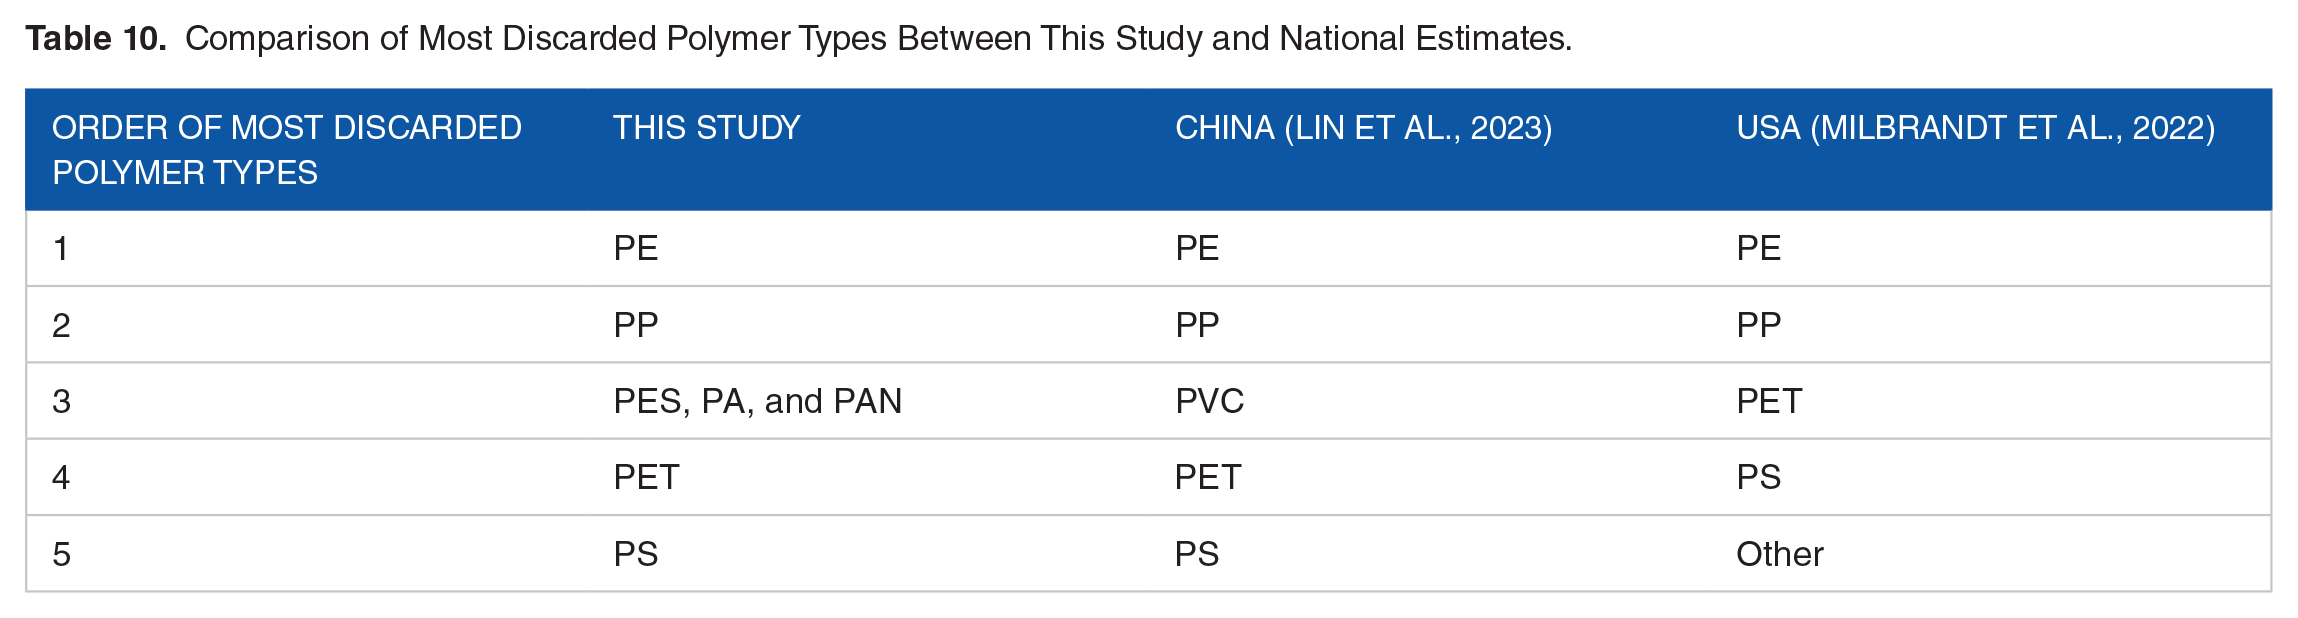
As observed in Table 10, the studies consistently identified PE, PP, PET, and PS as major discarded polymers. However, the fibers (PES/PA/PAN) estimated in our study and the PVC reported for China differ. MP fibers are considered a significant component of plastic waste in this review (Geyer et al., 2017), while Lin et al. (2023) and Milbrandt et al. (2022) primarily focused on the types of polymers found in municipal waste, without considering the forms. On the other hand, the prevalence of PVC in China can likely be attributed to its status as the world’s largest producer and consumer, fueled by rapid urbanization and economic growth (Lin et al., 2023; Y. Liu et al., 2020).
While current regulations support the prioritization outlined earlier, their impact on MPs and polymer pollution remains relatively unchanged. As discussed before, regulations often target consumers, leading to unintended consequences. For example, regulations in Kenya have led to a black market for disposable bags, while in California, they have increased plastic usage. This is due to insufficient analysis of the current situation and limited engagement with society and industry (Huang & Woodward, 2022; Pinto da Costa et al., 2020). In contrast, Costa Rica plans to ban single-use plastics by 2024, accompanied by changes in education, financial support for research and companies, and an emphasis on producer responsibility. However, the true impact remains to be seen (Schachter et al., 2021).
These examples highlight the need for regulation of single use plastic types based on a comprehensive analysis of social, economic, and environmental factors, and engagement with all stakeholders, both before and after the implementation, to achieve favorable outcomes. The responsibility should shift from consumers to producers, who bear the primary responsibility for plastic production (Pinto da Costa et al., 2020). As for regulations related to intentionally added MPs (1° MPs) and their prioritization, there are no studies that collectively examine the polymers presented in Table 3, as many fall outside the current definition of MPs (discussed in section 3.2). However, due to their extensive use in personal care products (PCPs), there is research on their toxicity and biodegradability.
Studies have found that certain water-soluble polymers, including carbomers, have a notable adverse impact on beneficial bacteria in wastewater treatment and exhibit poor biodegradability (Rozman & Kalčíková, 2021). Similarly, PVP has been shown to resist biodegradation under standard conditions (Julinová et al., 2018). Research also indicates that PA polymers (Nylon-6 and Nylon-12), commonly used in PCPs, can act as carriers for pharmaceutical drugs in wastewater, potentially leading to desorption and risk to aquatic organisms (Wagstaff et al., 2022). Among the Table 3 polymers, PE is the most found in PCPs within the REACH MP definition (Refer to section 3.2). However, potential gaps in its regulation could incentivize the use of nanoplastic particles. Lastly, although no recent studies on PB were found, given its prevalence in personal care products, comprehensive research is needed to assess its safety and environmental fate.
Research suggests that the harmful effects of plastics often stem from additives and monomers, rather than the base polymers themselves. These additives and monomers are often extracted together during testing, forming a mixture known as leachate. While no direct comparisons exist in the literature for leachates from the polymers identified in Tables 4 and 5 (PVC, PA, PS, PUR, PET/PBT, PP, PC, and PAN), the available evidence suggests varying levels of toxicity among their leachates. PVC is recognized as one of the most toxic polymer types due to the presence of concerning additives and residual monomers in its leachates (Gewert et al., 2021; Zimmermann et al., 2020); PUR leachates can exhibit toxicity levels comparable to PVC (Lithner et al., 2009); PET leachates, while typically containing fewer additives, can still be toxic (Gewert et al., 2021); studies on PA MPs show negative impacts on aquatic life, but the source of this harm (the material itself or its additives) remains unclear (Choi et al., 2023); PC leachates appear to harm seed germination and are linked to high levels of BPA release (Jeon, 2022; Pflugmacher et al., 2020); and PAN leachates were found to be the most toxic compared to PS, PET, and PC (Johnson, 2021).
The exact ranking order presented in Tables 4 and 5 may not capture the full picture. While we incorporated information on the toxicity, biodegradability, and other relevant characteristics of associated monomers and additives (Supplemental Tables 3B and 4B), the actual release and spread of these chemicals in the environment depend on several factors. These factors include temperature, pH, biological activity, and the specific physical and chemical properties of the plastics themselves (Kwan & Takada, 2016). Therefore, further research is essential to develop standardized methods for investigating the release mechanisms and environmental impacts of leachates from the polymers listed in Tables 4 and 5. This research is particularly critical considering the potential risks these additives and monomers pose to human health and the environment.
A major hurdle in accurately assessing MP prevalence in the environment is the lack of standardized research methods. To address this challenge, Section 3.5 of this review focused on identifying the types and forms of MPs that pose the greatest difficulty in separation from environmental samples and subsequent identification using various techniques.
One study by Hurley et al. (2018) compared the effects of different organic removal treatments on various polymers. They found that polystyrene (PS), polyamide (PA), polycarbonate (PC), and polyethylene terephthalate (PET) were most susceptible to degradation from oxidative treatments (Fenton, H2O2) and strong alkaline digestions (KOH/NaOH). However, their evaluation solely considered changes in mass and size, whereas our review incorporates the impact on color as well. Our findings indicate that KOH can alter the color of PE and PVC, while acid digestion can affect the color of PVC and PA.
MP fibers pose a unique challenge due to their difficulty in separation, quantification, and identification. Consequently, they are prioritized for further research (Table 7). Their long, thin shape allows them to slip through standard sieves used in sampling and separation processes (Fernández-González et al., 2022). For example, Lutz et al. (2021) reported a much higher success rate identifying MP fragments (93% accuracy) compared to fibers (22% accuracy).
Polymer degradation is an important aspect for both research and regulation, as discussed in Section 3.6. This review prioritizes polymers that are more likely to degrade and fragment into microplastics, differing from the approach taken by Yuan et al. (2022) who prioritized faster degradation rates (under 100 years). Our prioritization reflects the concern that faster degradation can lead to a quicker release of microplastics into the environment. Additionally, this review considers variations in degradation based on polymer functional groups, whereas Yuan et al. (2022) did not.
Several studies support the prioritization results in Table 8. For example, Gewert et al. (2015) found that impurities make PVC more susceptible to degradation; that PS, PUR, and PET are sensitive to photooxidation due to the presence of specific chemical groups in their structure (phenyl rings and heteroatoms); and that PP and PE can degrade from minor impurities or irregularities, with PP more prone to fragmentation than PE (although we assigned equal priority to both in this review). Research also shows that PC degrades significantly under combined UV light and temperature exposure (Eggenhuisen & Hoeks, 2022; Redjala et al., 2023; Yan & Wu, 2022), and PA degrades due to its amide group (Achhammer et al., 1951).
Our prioritization results differ from those of Senathirajah et al. (2022). Their study aimed to identify plastic polymers of concern and target environmental hotspots for potential management strategies. In contrast, this review focuses on prioritizing polymers for future research and regulatory purposes. While there is some overlap, with both studies highlighting PVC and PS as high priorities, our review also includes PET due to its widespread use, production, and waste generation. Additionally, PET fragmentation and potential changes in surface properties can influence pollutant transport and degradation in the environment. Also, Senathirajah et al. (2022) prioritized PP, which we excluded based on the rationale explained in Section 3.6. PP’s stable functional chemistry suggests it generates fewer microplastics and has lower environmental reactivity. Furthermore, our analysis indicates that PP is typically associated with less harmful additives and monomers compared to PVC and PS. Finally, PP does not appear to be significantly affected by pre-treatment methods used in environmental MP studies.
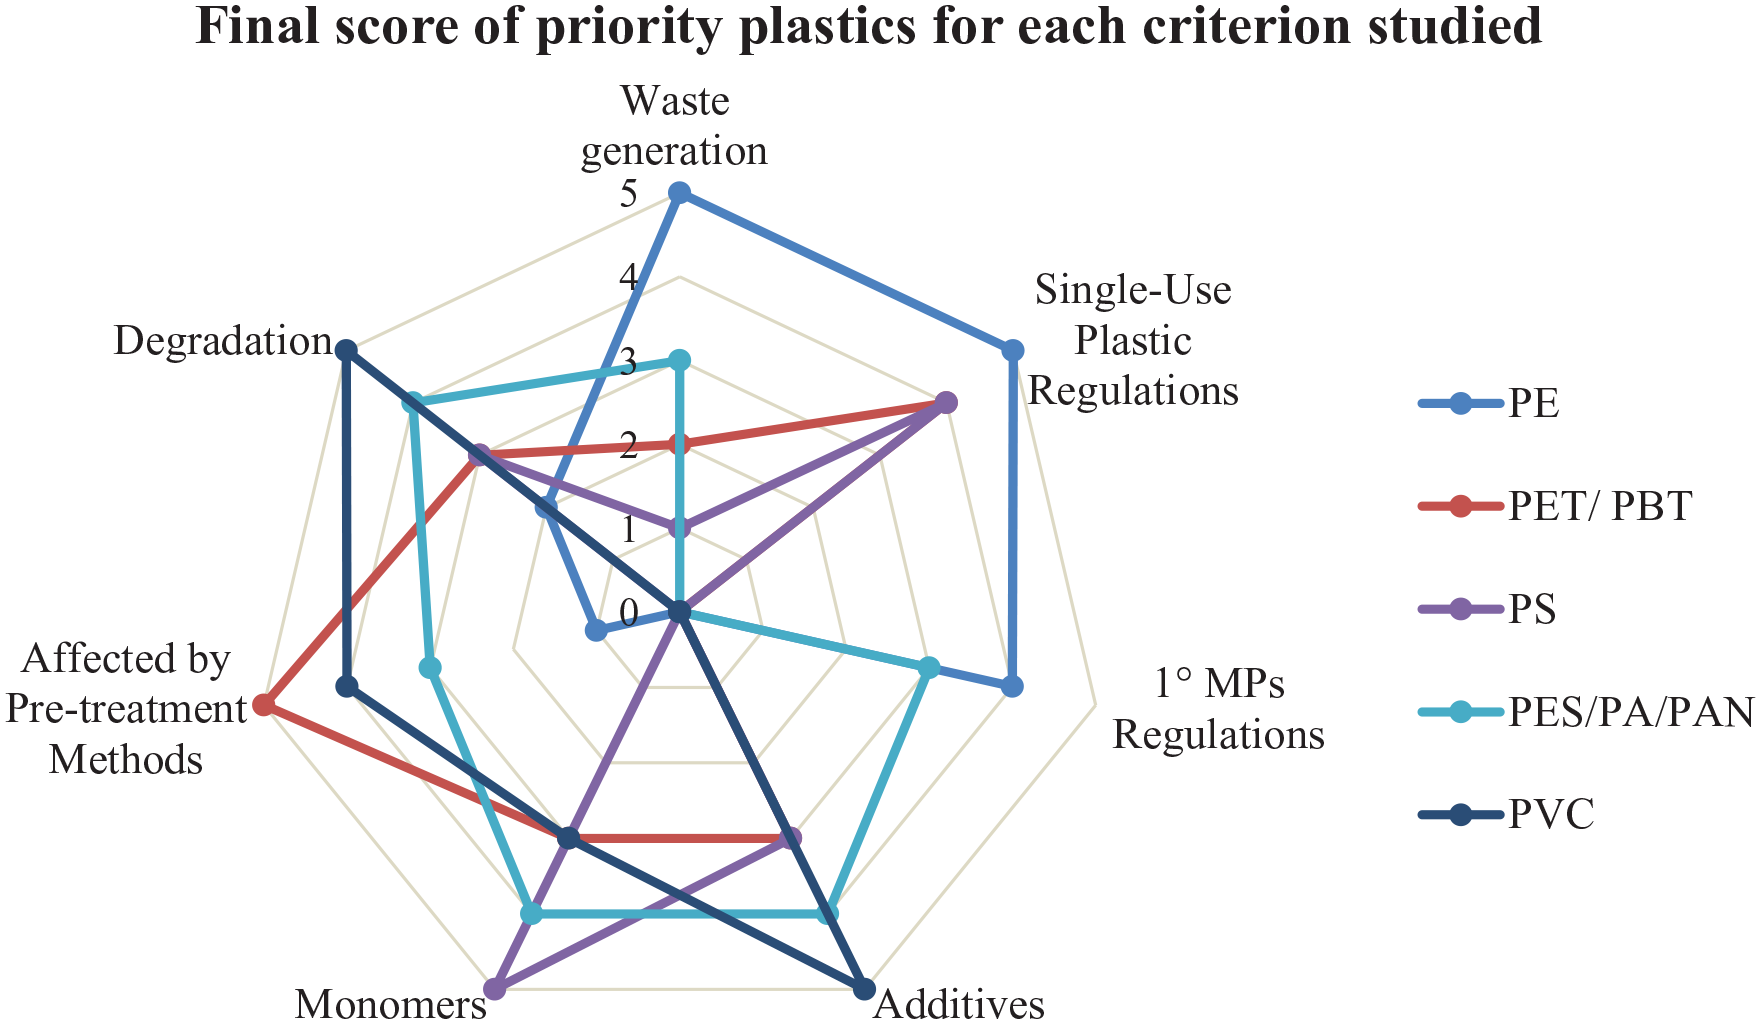
Figure 5(a–f) illustrate the scores assigned to the seven criteria for the five highest-priority polymer types.
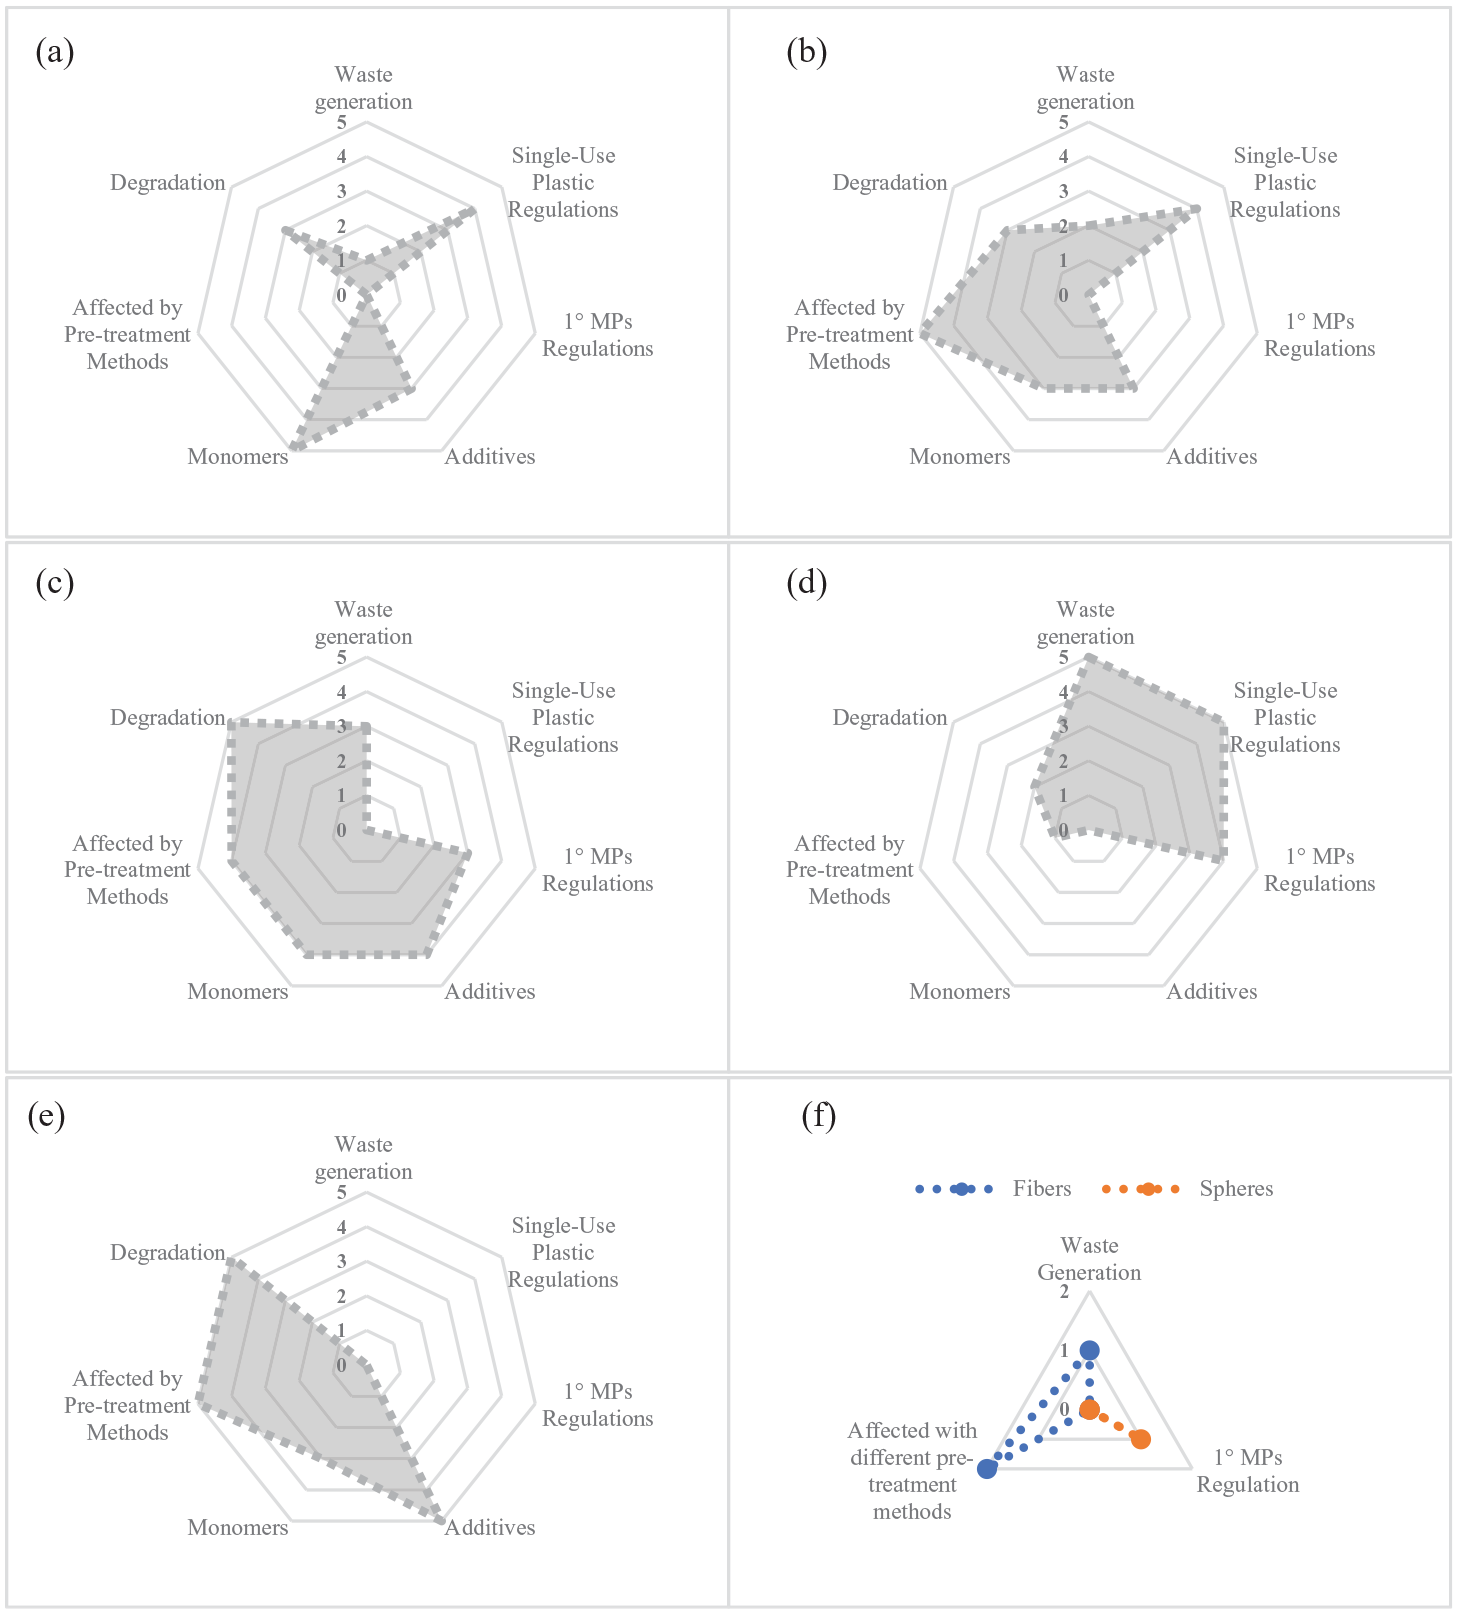
Top-ranked polymers and their scores by criteria: (a) PS, (b) PET/PBT, (c) PES/PA/PAN, (d), PE, (e) PVC, and (f) MPS priority forms.
Analysis of Figure 5(a), (b), and (d) reveals that some of the priority plastics associated with high waste generation (PE, PET/PBT, PS) are also among the types regulated as single-use plastics. However, this pattern does not hold true for the PES/PA/PAN family (Figure 5(c)), which primarily consists of fibers and currently lacks specific regulations. This highlights potential limitations in current regulatory approaches, which may focus primarily on mismanaged waste while overlooking factors like production levels or minimum recycled plastic content.
Nearly all priority polymers (except PE) raise concerns due to the presence of potentially harmful monomers and additives. This emphasizes the need for further research on how these compounds migrate from the plastic into the environment or organisms. Such research should have a particular focus on MPs and nanoplastics (NPs) due to their ability to be internalized and potentially trigger physiological responses.
PET/PBT polymers, highlighted in Figure 5(b), score high in six out of seven criteria. This is particularly concerning because, despite containing potentially harmful monomers and additives that warrant further investigation, they are commonly used in food storage applications, including packaging and single-use plastics. On the other hand, PET/PBT might be underrepresented in studies on environmental microplastics due to their susceptibility to degradation during the pre-treatment methods used in research. Therefore, developing more effective methods for separating and identifying PET/PBT microplastics should be a top priority.
Figure 5(e) reveals that PVC scores high for concerns related to additives and monomers, but it lacks ratings for regulation or waste generation. This is because PVC is often used in applications with longer lifespans, such as construction materials. Regulations often target the most common plastic pollutants found in the environment. However, PVC is present in a wide variety of everyday products and is a critical component in global water supply pipelines. With growing urban areas, PVC consumption and disposal are likely to increase. Therefore, stricter regulations on PVC use and further research on the environmental behavior of its additives and monomers are necessary.
Figure 5 highlights that only PE and PES/PA/PAN have scores for regulations on intentionally added 1° MPs. This is because they are frequently found in PCPs. However, other polymers like PB and PVP, which are not well-studied or regulated because they do not strictly meet the definition of MPs, deserve attention in future research.
The priority forms in Figure 5(e; fibers and spheres) were chosen because, while fragments are the most common type of microplastic, fiber, and sphere emissions into the environment are considered more manageable. This is because they are often released through municipal and industrial wastewater (Boucher & Friot, 2017). For fibers, specialized filters can be implemented in wastewater treatment plants (WWTPs). For spheres, intentionally produced, existing regulations can be strengthened or introduced in areas that currently lack controls.
Future research directions and regulatory recommendations
This review identified several challenges in plastic waste regulations, including exemptions for certain plastic types, the potential for harmful alternatives to be used in place of regulated plastics, a lack of regulations in some countries, and a focus solely on the waste management stage rather than the entire plastic lifecycle (Sections 3.2.1 and 3.2.2). Additionally, inconsistencies in current MP definitions create loopholes and exclude soluble polymers and other types of plastics. Based on these findings, we propose the following recommendations for improved plastic regulations: (a) establish a harmonized international definition for MPs; (b) expand the scope of current regulations to include soluble polymers, nanoparticles, and other primary plastics beyond those used for PCPs; (c) promote co-responsibility between industry and governments for plastic product waste management throughout the entire lifecycle (cradle-to-cradle approach), and implement regulations that support this co-responsibility model; and (d) support international programs to assist developing countries in overcoming waste management and plastic pollution challenges.
This review also identified several key areas for future research: (a) evaluate the environmental and human health impacts of polymers used in personal care products, particularly soluble polymers which are currently exempt from regulations; (b) develop and implement technological solutions to minimize microplastic release, with a specific focus on primary microplastics originating from sources like tires, textiles, and industrial processes; (c) establish standardized and environmentally relevant methods for assessing plastic alternatives such as bioplastics and bio-based solutions; (d) investigate the aggregation behavior of microplastics and create standardized protocols for incorporating this phenomenon into toxicological research; (e) develop standardized methodologies to study the mechanisms by which leachates are released from polymers and their subsequent environmental impacts; (f) advance experimental methodologies for more effective identification of microplastics in environmental samples; (g) develop research methods to study how polymers fragment in natural environments, particularly under mechanical stress; and (h) explore innovative wastewater treatment approaches specifically designed to target and remove prioritized polymers.
Conclusions
This paper prioritizes polymer types and forms to guide future research efforts on MPs. The results offer valuable insights for several groups. First, this prioritization can help researchers focus their efforts on detecting and quantifying the most concerning MP types in environmental samples. It also highlights which techniques and methods require further development or warrant particular attention. Second, this information can guide policymakers and decision-makers in understanding existing regulations and exploring opportunities for broader, more restrictive, or more effective regulations. This includes stakeholders in the plastics industry (manufacturing, handling, and recycling) and wastewater treatment facilities. The findings can inform them about upcoming challenges, opportunities to incorporate circular economy principles into their operations, and the development of innovative technologies for plastic separation from waste and wastewater streams. Finally, this research empowers consumers to make more informed choices that benefit their health and the environment.
It is important to recognize that the current prioritization is based on available information. As detailed in Supplemental Material A and B, certain simplifications were necessary to bridge some data gaps. These limitations highlight critical areas for future research, including plastic waste generation in regions underrepresented by global trends (such as developing countries), polymer degradation products and mechanisms, and the behavior of additives or residual monomers at micro or nano scales. It is also important to acknowledge that this review focuses on broad trends and does not consider site-specific factors that can influence organic or inorganic pollutant migration in the presence of MPs, or the fate and transport of MPs. For regional or local prioritization efforts, additional parameters and characteristics should also be considered.
By prioritizing research on the most concerning polymer types and MPs, we can develop more targeted risk assessments and environmental models. This will be crucial in finding solutions to the widespread threat of MP contamination. While the long-term effects of MPs on ecosystems and human health remain uncertain, continued research and effective plastic waste reduction strategies are essential to prevent further pollution.
Glossary of notations
MPs: Microplastics
NPs: Nanoplastics
PE: HDPE/LDPE/LLDPE: Polyethylene: High density/low density/linear low-density
PP: Polypropylene
PS: EPS/HIPS: Polystyrene: expanded/high impact
ABS: Acrylonitrile butadiene styrene
PVC: Polyvinylchloride
PET: Polyethylene terephthalate
PBT: Polybutylene terephthalate
PUR: Polyurethane
PC: Polycarbonate
PA: Polyamide (nylon and foam variants)
PES: Polyester (PET fibers)
(PES, PA, and PAN): Polyester, polyamide, and acrylic fibers
PTFE: Polytetrafluoroethylene
PAA: Poly (acrylic acid) (trade name carbomer)
PB: Polybutene
PVP: Povidone or polyvinylpyrrolidone
PAN: Polyacrylonitrile
BPA: Bisphenol A
DIBP: Di isobutyl phthalate
DEHP: Bis(2-ethylhexyl) phthalate
SCCP: Short-chain chlorinated paraffins
BBP: Benzyl butyl phthalate
BFR: Brominated flame retardant
PAHs: Polycyclic aromatic hydrocarbons
Supplemental Material
sj-docx-1-asw-10.1177_11786221241257367 – Supplemental material for A Review for Prioritizing Microplastic Regulation and Research: An Integral Approach
Supplemental material, sj-docx-1-asw-10.1177_11786221241257367 for A Review for Prioritizing Microplastic Regulation and Research: An Integral Approach by Andrea Arredondo-Navarro, Lara Dronjak, Joaquim Rovira Solano, Ricardo Navarro-Amador, Estefania Martinez-Tavera and Deborah Xanat Flores-Cervantes in Air, Soil and Water Research
Supplemental Material
sj-xlsx-2-asw-10.1177_11786221241257367 – Supplemental material for A Review for Prioritizing Microplastic Regulation and Research: An Integral Approach
Supplemental material, sj-xlsx-2-asw-10.1177_11786221241257367 for A Review for Prioritizing Microplastic Regulation and Research: An Integral Approach by Andrea Arredondo-Navarro, Lara Dronjak, Joaquim Rovira Solano, Ricardo Navarro-Amador, Estefania Martinez-Tavera and Deborah Xanat Flores-Cervantes in Air, Soil and Water Research
Footnotes
Acknowledgements
This review was possible thanks to support from the Fundación Universidad de las Americas Puebla and the Microplastics Network. The authors thank Gregory Tkac for proofreading the document.
Funding
The author(s) disclosed receipt of the following financial support for the research, authorship, and/or publication of this article: AAN is thankful to the Mexican National Council of Humanities, Science and Technology (CONAHCYT) for her doctoral scholarship, grant no. 754487.
Declaration of conflicting interests
The authors declare no potential conflicts of interest with respect to the research, authorship, and/or publication of this article.
Supplemental material
Supplemental material for this article is available online.
References
Supplementary Material
Please find the following supplemental material available below.
For Open Access articles published under a Creative Commons License, all supplemental material carries the same license as the article it is associated with.
For non-Open Access articles published, all supplemental material carries a non-exclusive license, and permission requests for re-use of supplemental material or any part of supplemental material shall be sent directly to the copyright owner as specified in the copyright notice associated with the article.