
Abstract
Despite being environmentally harmful, conventional tillage’s (CT) importance under furrow irrigation for ridge-making (RM) and furrow maintenance (FM) cannot be overemphasized. No-till (NT) practices’ soil health and sustainable production benefits are well documented. The Lower Mississippi Delta (LMD) region’s 70% land is furrow irrigated. Therefore, skepticism over NT synergy with furrow irrigation standard practices hinders NT adoption. RM and FM are crucial for judicious surface water application for row crop production and expediting drainage following precipitation to curb flash flooding and avert undesirable water logging conditions. The impact of adopting a long-term NT practice compared to the CT prevalent in the LMD region was evaluated from 2019 to 2022. NT increased soil total nitrogen, organic matter, organic sulfur, magnesium, calcium, cation exchange capacity, and stored soil water compared to CT during 4 years of soybean production following 11 years under corn. Phosphatase enzyme activity was 27% higher under NT than CT in the top 10 cm depth. NT and CT had no significant differences in wet aggregate stability and soybean yields. The loss in nutrients observed under CT in the top 10 cm manifests the impact of disturbing the surface soil and exposing it to denudation processes and consequent nutrient losses. CT developed a 5-cm thick plow pan at 10 cm depth. This was possibly due to the excess land preparation operations count, 83% higher for CT than NT for the 4-year study period. NT adoption coupled with shallow occasional FM operations is a viable conservation practice under furrow irrigation.
Highlights
NT increased STN, SOM, OS, magnesium, CEC, and stored soil water compared to CT.
NT showed 27% higher phosphatase enzyme activity than CT in the surface depth.
NT and CT had no significant differences in WSAS and soybean yields.
CT developed a 5-cm thick plow pan at 10 cm depth.
Long-term NT practice is feasible under furrow irrigation in the Mid-South USA.
Introduction
The importance of soil tillage in row crop production cannot be overstated, especially where furrow irrigation is the supplementary water source. Placement and maintenance of ridges and furrows that facilitate efficient application and delivery of irrigation water cannot be achieved without disturbing the soil (Blevins, 1993). Plowing implements are used to make and maintain the furrows. Traditionally, conventional tillage (CT) is a soil management practice characterized by intensive moldboard deep plowing that inverts the soil 20 to 30 cm depth (Franzluebbers, 2021), followed by several other farm tools to prepare the field for row crop production (Blevins, 1993). CT kills weeds (Armengot et al., 2016), enhances germination by improving seed-to-soil contact (Blunk et al., 2017), destroys soil structure (Zhang-liu et al., 2013), and expedites nutrient mineralization, increasing vulnerability to nutrient losses in downstream ecosystems (Staver, 2020). Ultimately, the benefits of CT come at the detriment of soil health, sustainable soil ecosystem services, soil function, water quality, and environmental quality (Mubvumba et al., 2023). To mitigate the adverse effects of CT, no-till (NT) is a conservation practice that excludes soil tillage as much as possible (Kassam et al., 2015). NT can potentially reduce soil erosion, increase soil moisture and soil carbon sequestration (Palm et al., 2014), and alleviate greenhouse gas emissions (Palm et al., 2014; Sanz-Cobena et al., 2017). NT can also lower production costs (González-Sánchez et al., 2016; Mitchell et al., 2016), and enhance nutrient cycling and soil fertility (Briedis et al., 2016). All these factors together enhance the soil's physical properties (Blanco-Canqui and Ruis, 2018) and promote sustainable production and environmental quality (Mitchell et al., 2016).
Although using NT conservation practice as an alternative to CT produces desirable environmental management outcomes, among other benefits, it generates its fair share of shortcomings over time. The advent of genetically engineered corn (Zea mays L.), soybean (Glycine max L.), and cotton (Gossypium arboretum L.) crop varieties with resistance to herbicides resulted in increased yields and, allowed for greater adoption of NT conservation practices (Cornish et al., 2020; Kassam et al., 2015). However, herbicide use and increased intensity over the years have developed herbicide-resistant weeds (Heap, 2014; Hulme, 2022). Perennial weeds have been reported to be a problem under some long-term NT practices (Armengot et al., 2015). Land under long-term NT is also more susceptible to soil compaction, diseases and pests, and nutrient stratification in the topsoil (Dang et al., 2015). Soil compaction is the packing of soil particles due to heavy surface loads that result in increased bulk density, reduced porosity, infiltration, water storage capacity, root growth, increased surface runoff, and nutrient discharge to the environment (Schjønning et al., 2015; Shah et al., 2017). Soil compaction is therefore undesirable for sustainable production. However, such consequences vary and may or may not affect crop yield returns in location-specific climates, soils, and landscapes. Strategic tillage, also known as occasional tillage, is a need-based practice motivated by adverse conditions under long-term NT management to combat the undesirable consequences of CT. Strategic tillage is performed on a per-need basis to minimize soil disturbance, which may potentially erode the long-term accrued NT benefits (Liu et al., 2016). Comparison of the pros and cons of CT and NT led to the reduction of tillage depth and number of field operations during land preparation for less intensive (CT) as an alternative (Cannell, 1985). Reduced tillage is the average sum of NT and intensive CT practices.
The Mississippi Delta is one of the USA’s key row crop production hubs, with 55% to 60% of the land area dedicated to agriculture and about 13% under no-till (NT) practices (USDA-NASS, 2017). In the Lower Mississippi Delta (LMD) region, approximately 70% of the land is under furrow irrigation. The lower rate of NT adoption in irrigated crop production systems is primarily due to the prevalence of furrow irrigation, which relies on raised seedbeds for maximum yields (Huitink & Tacker, 2000) and facilitates surface drainage after heavy rainfalls to avoid waterlogging (Stevens et al., 2018).
Producers are therefore skeptical about the synergy and efficacy of NT and furrow irrigation practices in water application without compromising production potential and there is no literature to that effect. The advent of herbicide-resistant crops has reduced the need for tillage (Givens et al., 2009), prompting a shift toward reduced tillage operations and the adoption of NT practices in the region. Although the common conventional tillage (CT) practice in the LMD has reduced tillage depth and the number of field operations, there are still knowledge gaps about its efficacy in resource use and conservation potential compared to the benchmark NT practice.
This research aims to evaluate the impact of prevalent CT practices in the LMD region on soil physicochemical properties, soil enzyme activities, stored soil water, and yields compared to the NT practice. It also examines the overall viability of furrow irrigation under NT compared to current LMD CT practice which technically is reduced tillage.
Materials and Methods
Study site and experimental design
This four-year study was conducted from 2019 to 2022 as part of a long-term tillage experiment established in 2008 at Stoneville, Mississippi, USA (33.42°N, 90.92°W, 32 m asl) (Figure 1). The soil type is a Dundee silt loam (fine-silty, mixed, active, thermic Typic Endoaqualfs) on a 1% slope in the LMD region. The climate is classified as warm and humid with hot summer under the Koppen–Geiger system, an average monthly minimum temperature between −3°Cand +18°C, and an average maximum temperature greater than 22°C (Kottek et al., 2006; Rubel & Kottek, 2011). The annual maximum (Tx) and minimum (Ty) temperatures during the study period were 34°C(Tx) and 2°C (TY) in 2020, 33°C (Tx) and −0.6°C (Ty) in 2021, and 39°C (Tx) and −1.1°C (Ty) in 2022. Annual precipitation was 1629, 1,182, and 1,175 mm in 2020, 2021, and 2022, respectively. The experimental site is 1.25 ha in total area, split into treatments of NT and CT. Each treatment comprised four plots measuring 62 m long by 25 m wide, for eight plots. These NT and CT plots were established in 2008 and maintained under ridge-planted corn production from 2008 to 2018 (Anapalli et al., 2018). From 2019 to 2022, they were switched to soybean production for the current study. Soil sampling was only done from 2020 to 2022. The evaluation criteria synopsis is shown in Figure 2.

Study location map, showing Stoneville in Mississippi, Washington County, USA.
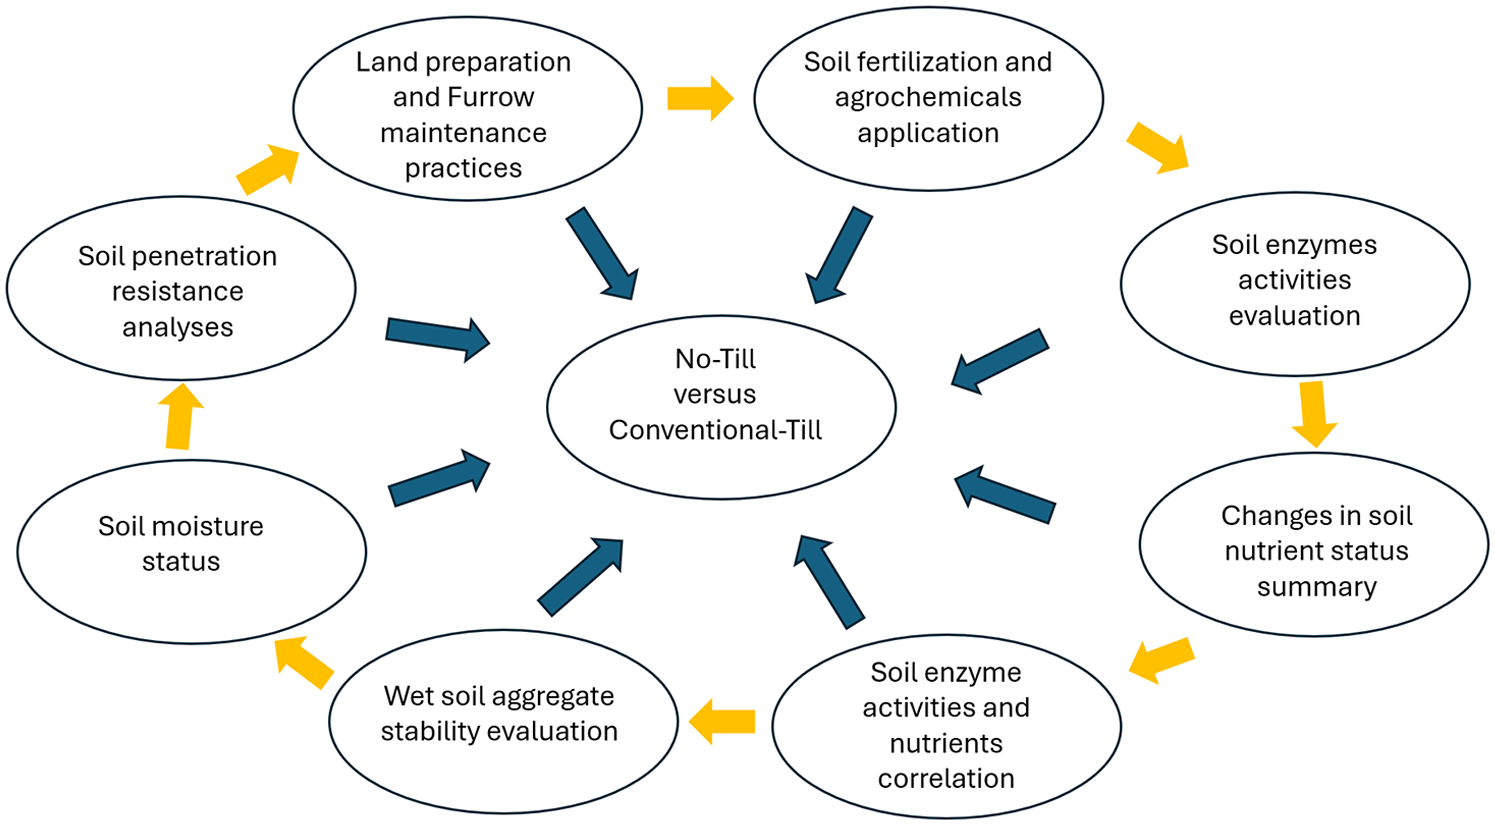
NT versus CT soil evaluation criteria synopsis.
Management practices
Land preparation
Soil tillage and ridge and furrow maintenance practices were achieved during the study period for both NT and CT as outlined in Table 1. In the NT plots, the ridge furrows prepared in 2008 for corn planting were preserved with occasional middle-row plowing, as in Table 1, and used for soybean planting in this study.
Soil Tillage and Furrow Maintenance Practices from 2019 to 2022.
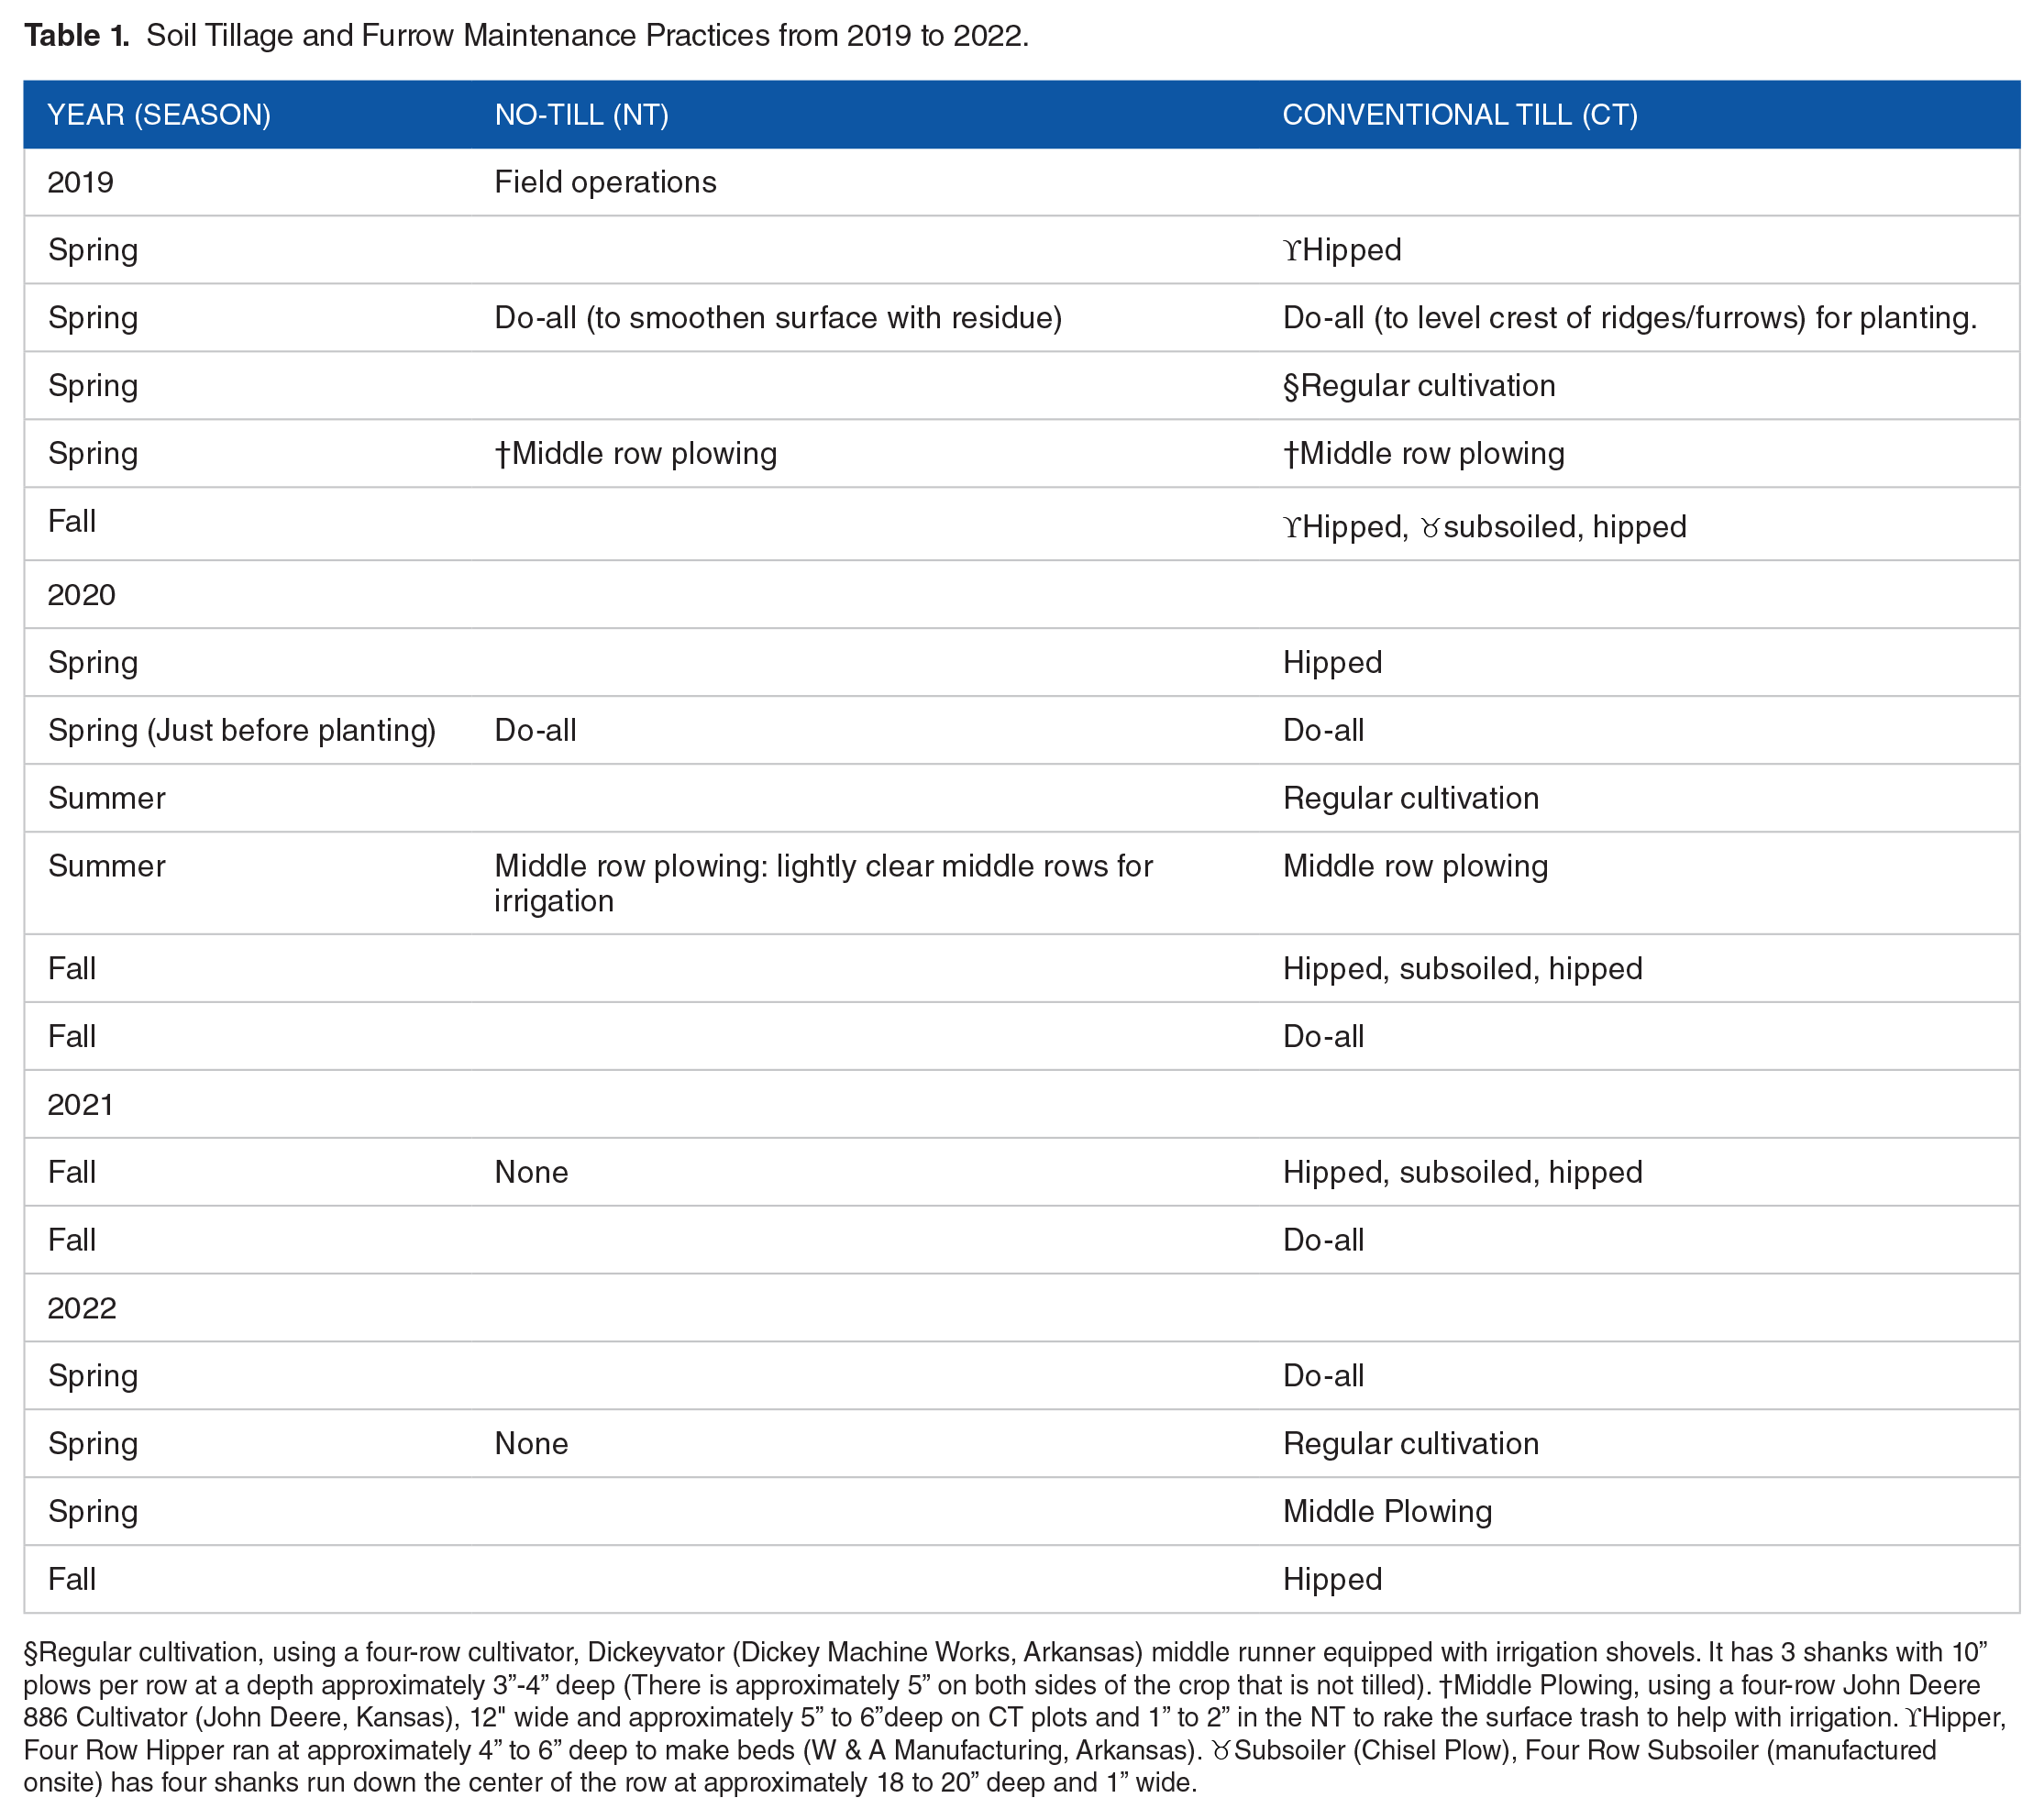
§Regular cultivation, using a four-row cultivator, Dickeyvator (Dickey Machine Works, Arkansas) middle runner equipped with irrigation shovels. It has 3 shanks with 10” plows per row at a depth approximately 3”-4” deep (There is approximately 5” on both sides of the crop that is not tilled). †Middle Plowing, using a four-row John Deere 886 Cultivator (John Deere, Kansas), 12" wide and approximately 5” to 6”deep on CT plots and 1” to 2” in the NT to rake the surface trash to help with irrigation. ϒHipper, Four Row Hipper ran at approximately 4” to 6” deep to make beds (W & A Manufacturing, Arkansas).  Subsoiler (Chisel Plow), Four Row Subsoiler (manufactured onsite) has four shanks run down the center of the row at approximately 18 to 20” deep and 1” wide.
Agronomic practices
Soybean was ridge planted every year in May at a rate of about 336,000 seeds per hectare using a John Deere 1705 Max Emerge four-row Planter at 102 cm row spacing and harvested in September and October from 2019 to 2022 (Table 1). Potassium fertilizer was aerially applied yearly using an agricultural aircraft as muriate of potash at 112–133 kg ha-1(Table 2). Herbicides were applied at manufacturer-recommended rates and are listed in Table 2.
Soybean Management Practices and Agrochemical Applications from 2020 to 2022.

The herbicides were: (1) Choice [a.i. Ammonium sulfate and ammoniacal nitrogen]; (2) Dual Magnum [a.i. S-metolachlor]; (3) Firstrate [a.i. cloransulam, Triazolopyrimidine]; (4) Intensity [a.i. clethodim]; (5) Liberty [a.i. glufosinate-ammonium, ammonium (2S)-2-amino-4-(hydroxyl[methyl]phosphoryl)butanoate]; (6) Makaze [a.i. Glyphosate N-(phosphonomethyl)glycine isopropylamine salt]; (7) Paraquat [a.i. Paraquat]; (8) Prowl [a.i. pendimethalin, Dinitroaniline]; (9) Pursuit [a.i. 2-[4,5-dihydro-4-methyl-4-(1-methylethyl)-5-oxo-1H-imidazol-2-yl]-5-ethyl-3-pyridinecarboxylic acid]; (10) Scanner [a.i. 3-oxapentane-1,5-diol, propane-1,2,3-triol, alkylphenol ethoxylate, polydimethylsiloxane]; 11) Top Gun [a.i. Fomesafen, Sodium salt ]; mop, muriate of potash.
The plots were furrow irrigated at 35% plant-available soil water depletion to replenish the soil water to field capacity level in the 0 to 60 cm depth. This was achieved by applying 4 cm of water during the soybean growth periods. Irrigation occurred on 36 days after planting (DAP) in 2019; 32, 45, 78, and 91 DAP in 2020; 47, 56, and 88 DAP in 2021 and 50 DAP in 2022.
Sample collection and analyses
Soil cores for nutrient analyses, enzyme assays, wet aggregate stability, and gravimetric water content measurements were collected after crop harvest to a depth of 30 cm in increments of 0 to 10, 10 to 20, and 20 to 30 cm every fall in 2020, 2021, and 2022. A tractor-mounted hydraulic Giddings machine (Giddings Machine Company, Inc., Windsor, Colorado, USA) with a 5-cm diameter soil probe was used. The soil was air dried at room temperature before grinding and allowed to pass through a 2 mm diameter sieve for nutrient and enzyme activities analyses. Soil total nitrogen (STN) and soil organic carbon (SOC) were analyzed using an Elementar Vario Max combustion analyzer. Soil pH was measured using a pH meter in a soil/water ratio 1:2 after shaking for 15 min (Schofield & Taylor, 1955). The soil nutrients of potassium, phosphorus, magnesium, calcium, sulfur, and zinc were extracted and determined using a Spectroblue ICP spectrophotometer, as documented in Sikora and Moore (2014). Enzyme activities of phosphatase, β-glucosidase, cellobiohydrolase, and N-acetylglucosaminidase were determined using p-nitrophenol (pNP) linked substrates in a 96-well format as described in Jackson et al. (2013).
Wet stable aggregates for the 0 to 10, 10 to 20, and 20 to 30 cm depths were determined as described in Feng et al. (2021) using a wet sieving apparatus by Eijkelkamp Equipment Company. Air-dried soil for each treatment and every depth was gently crushed and sifted through a 4 mm sieve to determine water-stable aggregates for >0.25, >0.5, >1.0, and >2.0 to 4 mm sizes. Briefly, 4 grams of soil in 0.25 mm sieve-size cups were raised and lowered in distilled water in metal cans for 3 min at 36 strokes per minute, collecting water-unstable aggregates. The metal cans were switched with a set filled with 2 g L-1 NaOH dispersing solution, which collected water-stable soil aggregates. The soil collected was oven-dried at 105°C for 24 h. The process was repeated using 0.5, 1.0-, and 2.0-mm sieve-size cups. The water stable aggregate fraction (WSAF) was computed as shown below.

where, WSA is water-stable aggregates, and WUA is water-unstable aggregates.
Soil samples for gravimetric water content were evaluated within 24 h after storing them in the refrigerator at 4oC soon after sampling. Soil wet weight was determined using a precision scale. This was followed by drying the soil at 105oC for 24 h. Soil gravimetric moisture content (MC) was computed as:

where, WS is wet soil weight, and DS is dry soil weight. Soybean was harvested every year using a Case IH 5140 8-Row Combine with Ag Leader Yield Monitor and reported at 13% moisture content.
Soil compaction
A field Scout SC900 digital soil compaction meter (Spectrum Technologies, Inc., Plainfield, IL) was used to measure soil compaction [soil penetration resistance (SPR)]. A total of ten SPR readings in each plot were taken from the soil surface every 2.5 cm to a depth of 30 cm in the fall of 2021 and 2022. The readings were taken following precipitation when the soil moisture was near field capacity, to eliminate potential differences due to variable soil moisture contents. The ten readings at each soil depth for every treatment replication were averaged as representative plot readings for further analysis.
Statistical analysis
The soil enzyme activity, soil nutrient, wet soil aggregate stability, and yield data were analyzed using Proc GLIMMIX using SAS Version 9.4 (SAS Institute Inc., Cary, NC). The GLIMMIX procedure combines generalized linear and mixed models’ characteristics (SAS Institute, 2013). Treatment was considered a fixed effect and block a random effect for the measured parameters. Block was nested within the year for soil nutrients, soil enzyme activity, wet soil aggregate stability, and yield data when analyzed by year. Mean separations were determined using Fisher’s protected least significant difference (LSD) at p < .05 when the analysis of variance (ANOVA) was significant at P < .05. Relationships between different enzyme types and soil nutrients were compared using a correlation procedure (PROC CORR) in SAS and declared significant at p ⩽ .05 unless otherwise stated.
Results and Discussion
Enzyme activity
Soil activities of phosphatase, N-acetylglucosaminidase (NAGase), β-glucosidase, and cellobiohydrolase in CT and NT tended to be comparable to each other during the 3 years of investigation in the 0 to 30 cm depth, except for phosphatase in the upper 10 cm depth which was 27% higher under NT compared to CT in 2021 (Table 3). A related study showed that 4 years after converting NT to reduced tillage (RT), both NT and RT practices had similar enzyme activities; in contrast, traditional tillage had the lowest recorded activities under a Mediterranean climate (Panettieri et al., 2013). The conventional tillage in this experiment involved moldboard plowing to a 25 cm depth for 10 years. The RT in the report was like CT in the current study and adopted in the LMD region which excludes the traditional soil inversion moldboard plow tillage practice. In another experiment, NT had higher enzymatic activity than CT after 15 years in a semi-arid subtropical region (Liu et al., 2010). Similarly, Dick (1984) reported higher enzyme activity under 18 years in NT than conventionally tilled plots. The conventionally tilled plots in that study involved plowing the soil to at least 20 cm depth followed by at least 10 cm deep secondary tillage operations about twice a year. As such, the similar enzyme activities between CT and NT reported in our study relative to the above-mentioned differences between CT and NT can be attributed to the reduced soil disturbance under our CT, which was only limited to surface soil disturbance using middle plowing and disc operations without deep tillage that engages a moldboard and turns the soil over. The reduced soil disturbance in our CT gave the soil ecosystem ample time to re-establish and minimize the negative effects associated with intensive plowing during the first 11 years before the current study. However, in 2021, NT showed 27% higher phosphatase enzyme activity than CT in the 0 to 10 cm depth (p < .05). A similar difference between phosphatase activities was observed in 2020, although it was not statistically significant. This treatment effect on phosphatase may be due to phosphorus surface stratification under NT practice. In a related study comparing the effects of RT and NT after 14 years, Tyler (2019) reported 38% higher phosphatase, and 17% higher beta-glucosidase activity in NT under soybean production. The plots from the current study were under corn production for 11 years and soybean production for the last 4 years while the other study (Tyler, 2019) was conducted in plots previously under cotton for 6 years followed by soybean for 8 years. Therefore, the greater differences in activities could be a result of the longer period of soybean production, as soybean adds more fixed N to the soil and has a lower C:N ratio than corn residue (Collino et al., 2015; Hungria & Mendes, 2015). The reduced tillage intensity LMD CT practice did not negatively impact enzyme activities compared to NT in general.
Soil enzyme activities under conventional Till and No-Till management from 2020 to 2022 in 0 to 10, 10 to 20, and 20 to 30 cm depths. (Data were not collected in 2019).
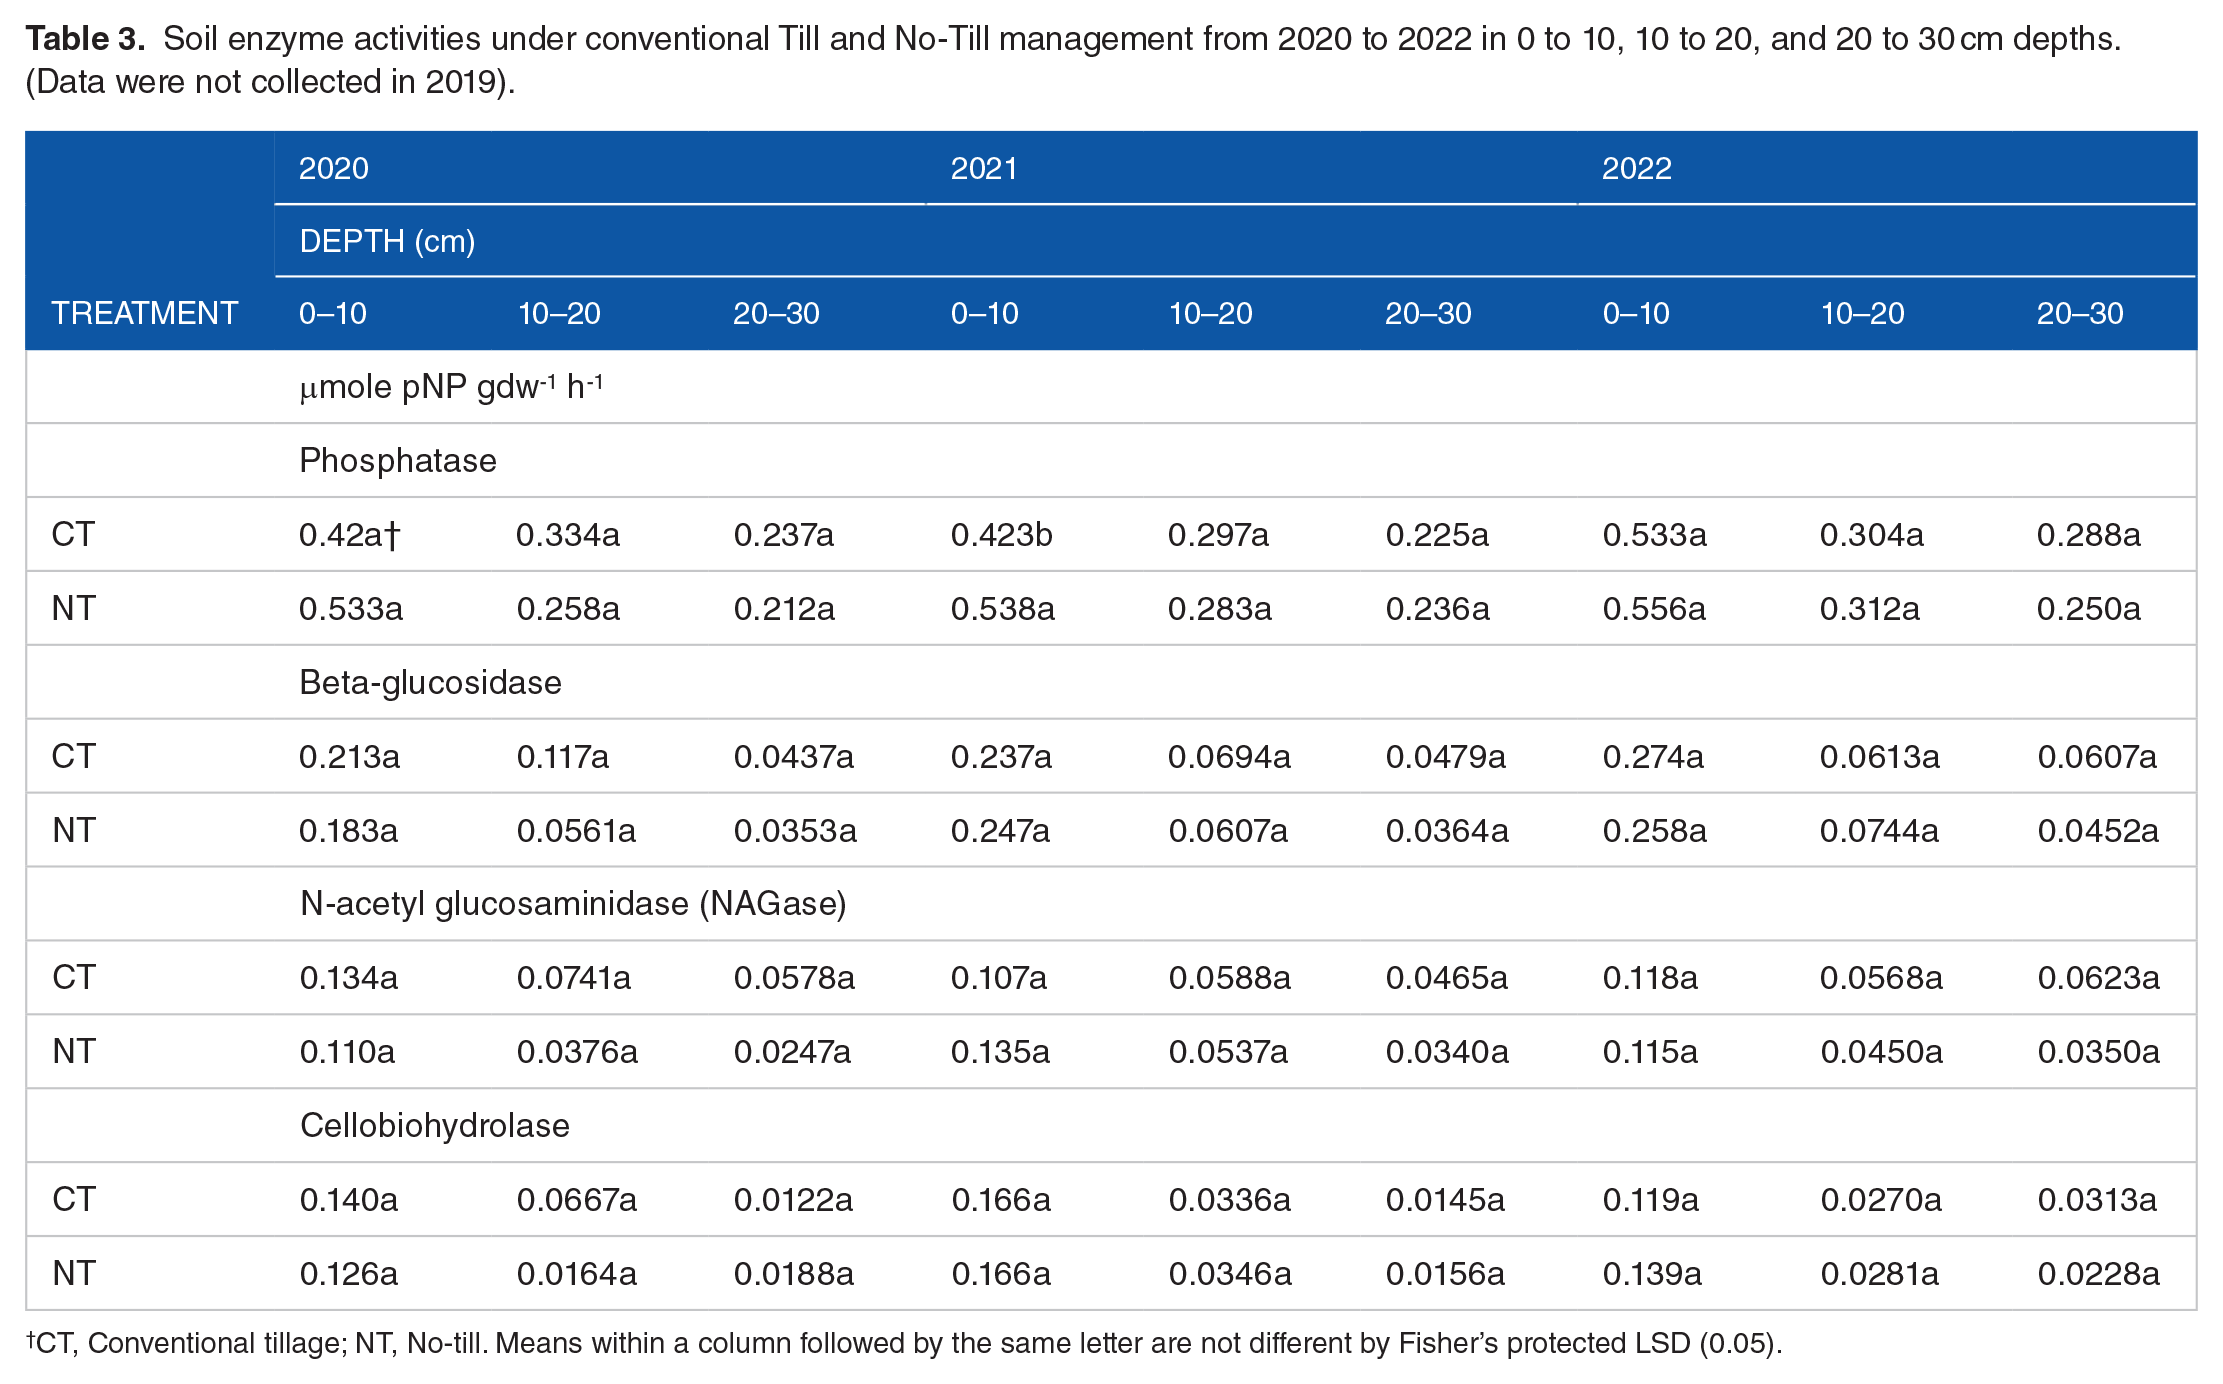
CT, Conventional tillage; NT, No-till. Means within a column followed by the same letter are not different by Fisher’s protected LSD (0.05).
Nutrient cycling
NT increased soil pH significantly in the 10 to 20 cm depth in 2021 and 2022 by 7% and 8%, respectively, compared to CT (p < .05; Table 4). The increase in pH under NT observed in this study is contrary to other findings, which generally reported NT lowering soil pH compared to tillage in global meta-analyses (Li et al., 2020; Zhao et al., 2022). These meta-analyses highlighted an array of factors that could explain the causes of variations, including NT duration, soil texture, initial soil pH, precipitation, mean annual temperature, and climate conditions (Li et al., 2020; Zhao et al., 2022). The increase in pH in our investigation could be attributed to the initial strong acidity of the soil before this study was initiated. Zhao et al. (2022) explained that soils with an initial strongly acidic pH value averaging 5.78 increased pH under NT, which was analogous to soil conditions in the current study. NT is widely reported to lower soil pH due to the release of acidifying hydrogen ions during residue or organic matter decomposition (Li et al., 2019). Soil pH is important in regulating and driving microbial activity, enzyme activity, and nutrient cycling and availability (Malik et al., 2018; Schlatter et al., 2020).
Soil Nutrients Levels Under Conventional Till and No-Till Management from 2020 to 2022 in 0 to 10, 10 to 20, and 20 to 30 cm depths. (Data Were Not Collected in 2019).

CT, conventional tillage; NT, No-till. Means within a column followed by the same letter are not different by Fisher’s protected LSD (0.05).
CT had 20%, 129%, and 100% higher STN compared to NT in the 10, 20, and 30 cm depths, respectively, in 2020 (p < .05; Table 4). However, a significant increase in STN under NT by 52% compared to an 18% increase under CT after 3 years (p < .05; Figure 3), resulted in no statistical differences in STN between NT and CT practices by 2022. In a five-year study, López-Garrido et al. (2014) compared CT, RT, and NT, where RT is comparable to CT in this study. In the last 2 years, they reported RT showing intermediate STN between NT and CT and no statistical difference between NT and RT. In another eight-year study, Fiorini et al. (2020) showed no initial differences in STN under NT, RT, and TT; gradually, STN in both NT and RT significantly increased with time compared to TT, while there were still no significant differences between NT and RT at the end of the 8-year period, which is comparable to the findings of the current study. RT, like our CT, was characterized by reduced tillage operations.
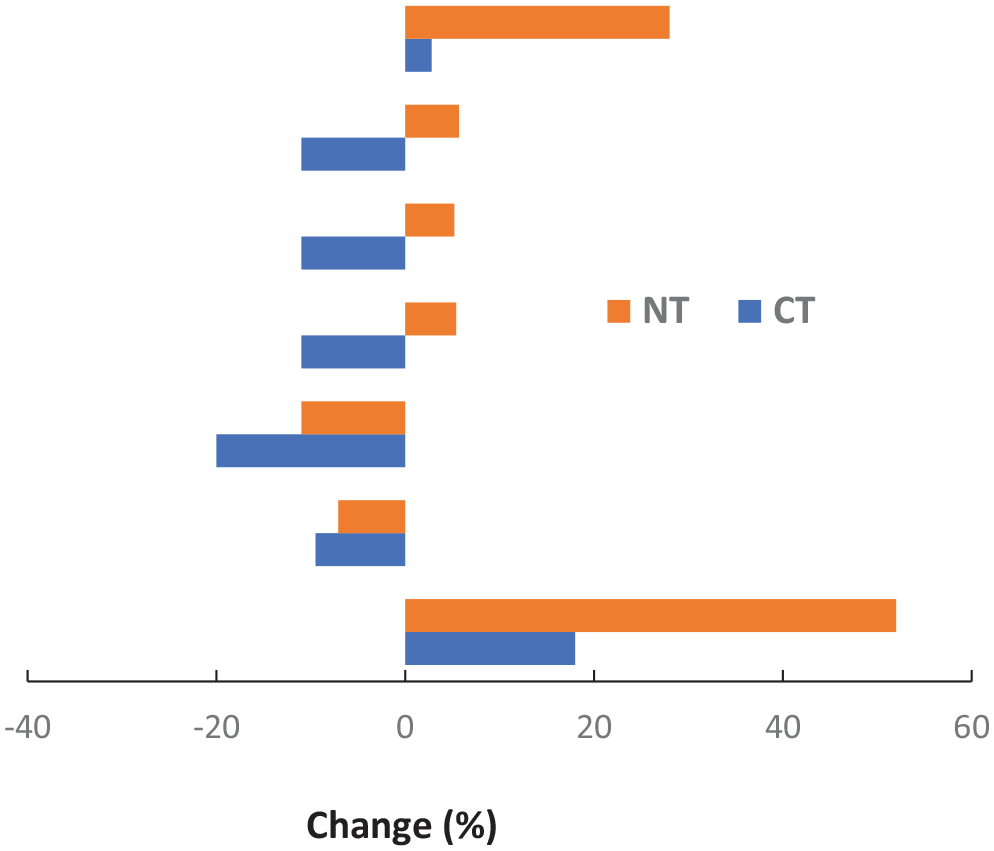
Percent (%) change in cation exchange capacity (CEC), soil organic matter (SOM), soil organic carbon (SOC), organic sulfur (OS), potassium (K), phosphorus (P), and soil total nitrogen (STN) in no-till (NT) and conventional till (CT) plots from 2020 to 2022 in the 0 to 10 cm depth.
Phosphorus (P) concentration in the 0 to 10 cm depth was consistently higher for CT by 22%, 21%, and 19% in 2020, 2021, and 2022 respectively (p > .05; Table 4). Conversely, López-Garrido et al. (2014) showed no difference in soil P under similar tillage practices in 5 years. The higher P in CT compared to NT in our findings can be explained by P stratification under NT, resulting in high P concentrations in the surface soil, which is susceptible to runoff losses during flash flooding events that are common in the region during storm events (Sharpley, 2003). Conventional tillage redistributes P in the soil, making it less vulnerable to loss.
Potassium was 14%, 23%, and 16% higher under CT in the 10, 20, and 30 cm depths in 2020 (p > .05; Table 4). However, there was a significant decrease in K under CT in 2022 (p < .05; Figure 3), resulting in no statistical differences between the two treatments at the end of the study (p < .05: Table 4). The high losses in surface K under CT compared to NT observed in 2022 were attributed to sediment-associated nutrient losses due to surface runoff, as reported in other related studies (Biddoccu et al., 2016). Soil disturbance due to CT can lead to K loss through sediment loss.
Organic sulfur under CT was 52% and 19% higher in the 10 to 20 cm and 20 to 30 cm depths, respectively, in 2020 (p > .05), while there were no differences in the 0 to 10 cm depth. However, by 2022, NT practice increased OS by 5% while CT reduced OS by 11% in the 0 to 10 cm depth (p < .05; Table 4; Figure 3), resulting in 11% higher OS under NT and no statistical differences in the lower depths. Similar trends were observed for SOC and SOM (p < .05; Table 4; Figure 3). Fiorini et al. (2020) reported no difference in SOC between NT and RT throughout the eight-year study period growing corn, contrary to our findings after 4 years of using soybean following 11 years of corn production in 15 years. Rusu (2014) reported no differences in SOM between NT and RT in a three-year corn, soybean, and wheat rotation study in the top 30 cm depth. A systematic review of how tillage intensity affects SOC (Haddaway et al., 2017) showed NT and intermediate tillage intensity increasing SOC stocks in the upper soil layer (0–15 cm) compared to high-intensity conventional or traditional tillage. Intermediate tillage, in this case, is comparable to CT in the current study. The minimal surface soil disturbance from CT in the LMD negatively impacted OS, soil organic SOC, and SOM compared to NT practice.
Although Ca concentrations increased in both NT and CT during the study period, NT was 20% higher in the 0 to 10 cm and 10 to 20 cm depths in 2022, with a 23% increase relative to 2020 levels compared to the 7% increase observed in CT (p < .05; Table 4). Tillage practices’ impact on Mg concentrations was very pronounced during the three years of observation. CT lowered Mg concentrations by 1.2%, while NT increased Mg concentrations by 32% from 2020 to 2022 (p < .05). On average Mg concentrations under NT practice were, about 42% higher than CT in 0 to 10 cm, 10 to 20 cm, and 20 to 30 cm depths in 2022 (p < .05; Table 4).
Both NT and CT reduced Zn concentrations by 29% and 17%, respectively, from 2020 to 2022 (p < .05; Table 4). In 2022, Zn concentrations in CT were about 1.2 to 3.5 times higher than in NT for the 0 to 10 cm, 10 to 20 cm, and 20 to 30 cm depths (p < .05; Table 4). While NT lowered Zn concentrations the most compared to CT, the converse was observed for Na concentrations. CT lowered Na concentrations by 20% while NT by 3% between 2020 and 2022 (p < .05). Na concentrations were 12% to 22% higher under NT in 2021 and 2022, respectively (p < .05; Table 4).
The NT practice increased the soil’s capacity to adsorb exchangeable cations (CEC) by 28% and 18% in the 0 to 10 and 10 to 20 cm depths, respectively, compared to 2% for both depths in CT during the 3 years (p < .05; Figure 3). The NT soil’s CEC was 24% and 16% higher than CT soil in the 0 to 10 and 10 to 20 cm depths, respectively, in 2022 (p < .05; Table 4). Similarly, other studies showed NT increasing Na, Mg, Ca, and CEC compared to RT and CT (Lv et al., 2023; Malvezi et al., 2019; Lozano-García and Parras-Alcántara, 2014). The increased soil organic matter observed under NT contributed to the enhanced CEC levels, resulting in higher exchangeable Mg2+, Ca2+, K+, and Na+ cations than CT. Reducing tillage operations under the LMD region’s CT did not match the long-term NT practice measured higher CEC levels.
Wet soil aggregate stability
Compared to the 15-year-old NT in this experiment, the CT practice did not significantly impact the wet soil aggregate stability for all the class sizes tested (Table 5). The lack of difference between treatments is a result of the CT practice in this study not being intensive enough to pulverize soil aggregates and significantly influence aggregate water stability capacity for the sizes that were evaluated because of the reduced tillage depth, frequency and number of land preparation operations, that minimized soil disturbance under the CT under investigation. In a related study following 12 years of treatment on sandy loam soil, Abdollahi and Munkholm (2017) also showed no significant differences in water-stable aggregates between NT and RT practices under crop rotations that included spring barley
Wet Soil Aggregate Stability Under Conventional Till and No-Till Management from 2020 to 2022. (Data Were Not Collected in 2019).

CT, Conventional tillage; NT, No-till. Means within a column followed by the same letter are not different by Fisher’s protected LSD (0.05).
However, in a three-year tillage study using traditional tillage (moldboard plowing), chisel plow (worked in fall and disked in spring), ridged tillage (re-hipped every summer) and NT under corn-soybean rotation, Khakural et al. (1992) reported increased water-stable aggregates on a well-drained fine-loamy, montmorillonitic, mesic Typic Argiustoll soil in the order: chisel plow <moldboard plow = ridge-till <NT. In the same study on a poorly drained fine, montmorillonitic, mesic Typic Argiaquoll toe slope soil, they reported an increase in water-stable aggregates in the order of ridge-till <chisel plow=NT <moldboard plow. Chisel plowing and ridge-till are synonymous with the CT practice used in the current study, under which moldboard plowing was only done twice in the 15-year-long period under CT practice, as the CT transitioned to reduced tillage status. The discrepancies between the effects of comparable tillage practices between Khakural et al. (1992) and the current study could be due to differences in soil texture. The Khakural et al. (1992) fine loam soil had higher clay particle content than silt loam soil study. The increased water-stable aggregates reported under fine loam could be due to higher clay content, which glues soil particles together into more stable aggregates (Pi et al., 2020). Soil texture, thus particle size distribution plays a critical role in determining soil aggregate stability.
Soil compaction
Based on soil penetration resistance (SPR) measurements every 2.5 cm from the soil surface to 30 cm depth, soil compaction tests did not show significant differences in 2021 (Figure 4). However, in 2022, higher subsurface SPR readings under CT in the depth range of 7.5 to 17.5 cm were observed (Figure 4(b)). SPR readings under CT were 55%, 52%, and 51% higher than NT at 10, 12.5, and 15 cm depth levels, respectively (p < .05), signifying the development of a plow pan. The soil tillage and furrow maintenance practices under CT were done at 10 cm depths, and 5 cm under NT once in the 3 years. Recently, a root excavation exercise for a new study in these plots revealed a J-rooting pattern in cotton grown in CT (data not shown), substantiating the existence of a plow pan, as roots could not easily penetrate the subsurface compact plow pan, forming a J-shaped pattern growing in a lateral direction. Li et al. (2019) showed varied plow pan thicknesses under different tillage depths. Traditional rotary tillage methods at 15, 20, 25, and 30 cm depths of plowing resulted in plow pans of thicknesses of 15, 10, 5, and 0 cm respectively, under a calcareous fluvo-aquic soil with a silt loam texture soil. In another study of 25 years of RT and CT, plowing depths of 12 to 15 and 20 to 30 cm, respectively, under a Chernozem, silt loam soil type, resulted in plow pans at 13 to 23 cm (RT) and 28 to 38 cm (CT) (Schlüter et al., 2018). Subsoiling has been shown to mitigate soil compaction and the development of plow pans under an Alfisol soil type, clay, sandy loam, and silt loam texture (Martínez et al., 2011; Ren et al., 2022).

Soil penetration resistance by depth under conventional tillage (CT) and no-till (NT) for 2021 (a) and 2022 (b).
The significant soil compaction observed under CT at the 10 to 15 cm depth level can be partially due to the increased traffic frequency observed during land preparation periods. Compared to NT, CT had 19 more soil preparation and furrow maintenance operations from 2019 to 2022 alone when this experiment was in progress (Table 1). The soil compaction was exacerbated by the continued increase in agricultural equipment weight which is reportedly one of the reasons for the current stagnation in crop yields (Keller et al., 2019; Keller et al., 2022). Although subsoiling was done once every year with shanks 45 to 50 cm deep and 2.5 cm thick, this was not sufficient to curb plow pan genesis, possibly because the homemade 2.5 cm thick shanks are too thin to break the soil crust enough, only slicing the soil in the short term.
Soil compaction shrunk pore sizes under CT, disrupting pore continuity and connectivity with adverse effects not only on soil aeration but water infiltration and holding capacity as well similar to related findings (Chyba et al., 2014; Shah et al., 2017), which may result in increased runoff and flash flooding according to Rogger et al. (2017) findings. This is a common occurrence in this part of the world, as exhibited by frequent flash flooding scenarios following rainfall. Soil compaction hindered root growth and development due to the increased penetration resistance that was witnessed in our study and is comparable to other related findings (Colombi et al., 2018). Soil compaction’s shrinkage of the soil system is a deterrent to root growth, development, and water seepage into subsurface soil horizons.
Soil water
Stored soil moisture was 24% higher under NT than CT practice in the 0 to 10 cm depth in 2020 (p < .05; Figure 5). In 2021, NT was 29% higher than CT in the 20 to 30 cm depth (p < .05; Figure 5). In the third year, NT was 59%, 25%, and 23% higher in the 0 to 10, 10 to 20, and 20 to 30 cm depths, respectively, compared to CT (p < .05; Figure 5). In a similar eight-year tillage study on a clay soil type under wheat, corn, and soybean rotation, with NT and RT comparable to our treatments, no significant differences in stored soil water content were observed (Acar et al., 2017). The higher stored soil water content observed in our 15-year NT practice compared to CT can be attributed to pore size distribution under the CT, which was negatively affected by the tillage operations and soil compaction over the years. Araya et al. (2022) showed how the relative abundance of the highest measured effective pore diameter of 50 to 1000 µm was significantly reduced under RT compared to NT in the 0 to 5 and 20 to 25 cm subsurface soil layers in a 20-year long-term NT study. RT operations in that study resulted in slaking that interfered with macropore continuity, thus reducing hydraulic conductivity. The relatively enhanced soil moisture under our NT compared to CT treatments can also be explained by the associated increase in SOC under NT which was also detected (Table 3). Since a high correlation between water holding capacity and CEC has been reported (Mohamed et al., 2016), the higher soil moisture under NT may have contributed to increased CEC observed under NT described previously (Table 3). All this, exacerbated by the reported soil compaction significantly lowered LMD CT practice capacity to store water compared to NT.

Fall soil water content (gravimetric, %) from 2020 to 2022 in no-till (NT) and conventional till (CT) treatments in the 0 to 10, 10 to 20, and 20 to 30 cm depths. Bars indicate standard errors. Different letters within the same depth range show differences at p < .05 in the stated year.
Enzymes activity correlation with nutrient concentrations
Enzyme activities were significantly correlated with select soil nutrient levels, which varied by enzyme type (Table 6). Soil organic carbon, SOM, and STN were positively associated with all enzymes (p < .05) and highly significant with β-glucosidase and cellobiohydrolase (p < .01). Both these enzymes are involved in organic matter decomposition (Woodward, 1991), and their correlations to SOC and SOM indicate that substrate availability essentially drives their activities in these soils. Similar trends were detected for OS, CEC), Ca, and Mg (p < .05), with variable significance levels. Highly significant correlations were also noted for CEC and Mg with phosphatase and NAGase, Ca with phosphatase, Zn with β-glucosidase, and cellobiohydrolase (p < .01). Magnesium and Zn have also been reported to enhance the activities of dehydrogenases, urease, and acid phosphatase under cadmium-contaminated soil at critical growth phases (Ayyar et al., 2019; Wyszkowska & Wyszkowski, 2003). Soil enzyme activities drive soil biological, chemical, and physical processes responsible for organic matter decomposition, stabilization of soil structure, and cycling of nutrients, defining soil quality and health for sustainable soil ecosystem services and function (Neemisha & Sharma, 2022).
Correlations Between Enzyme Activity and Soil Nutrients.
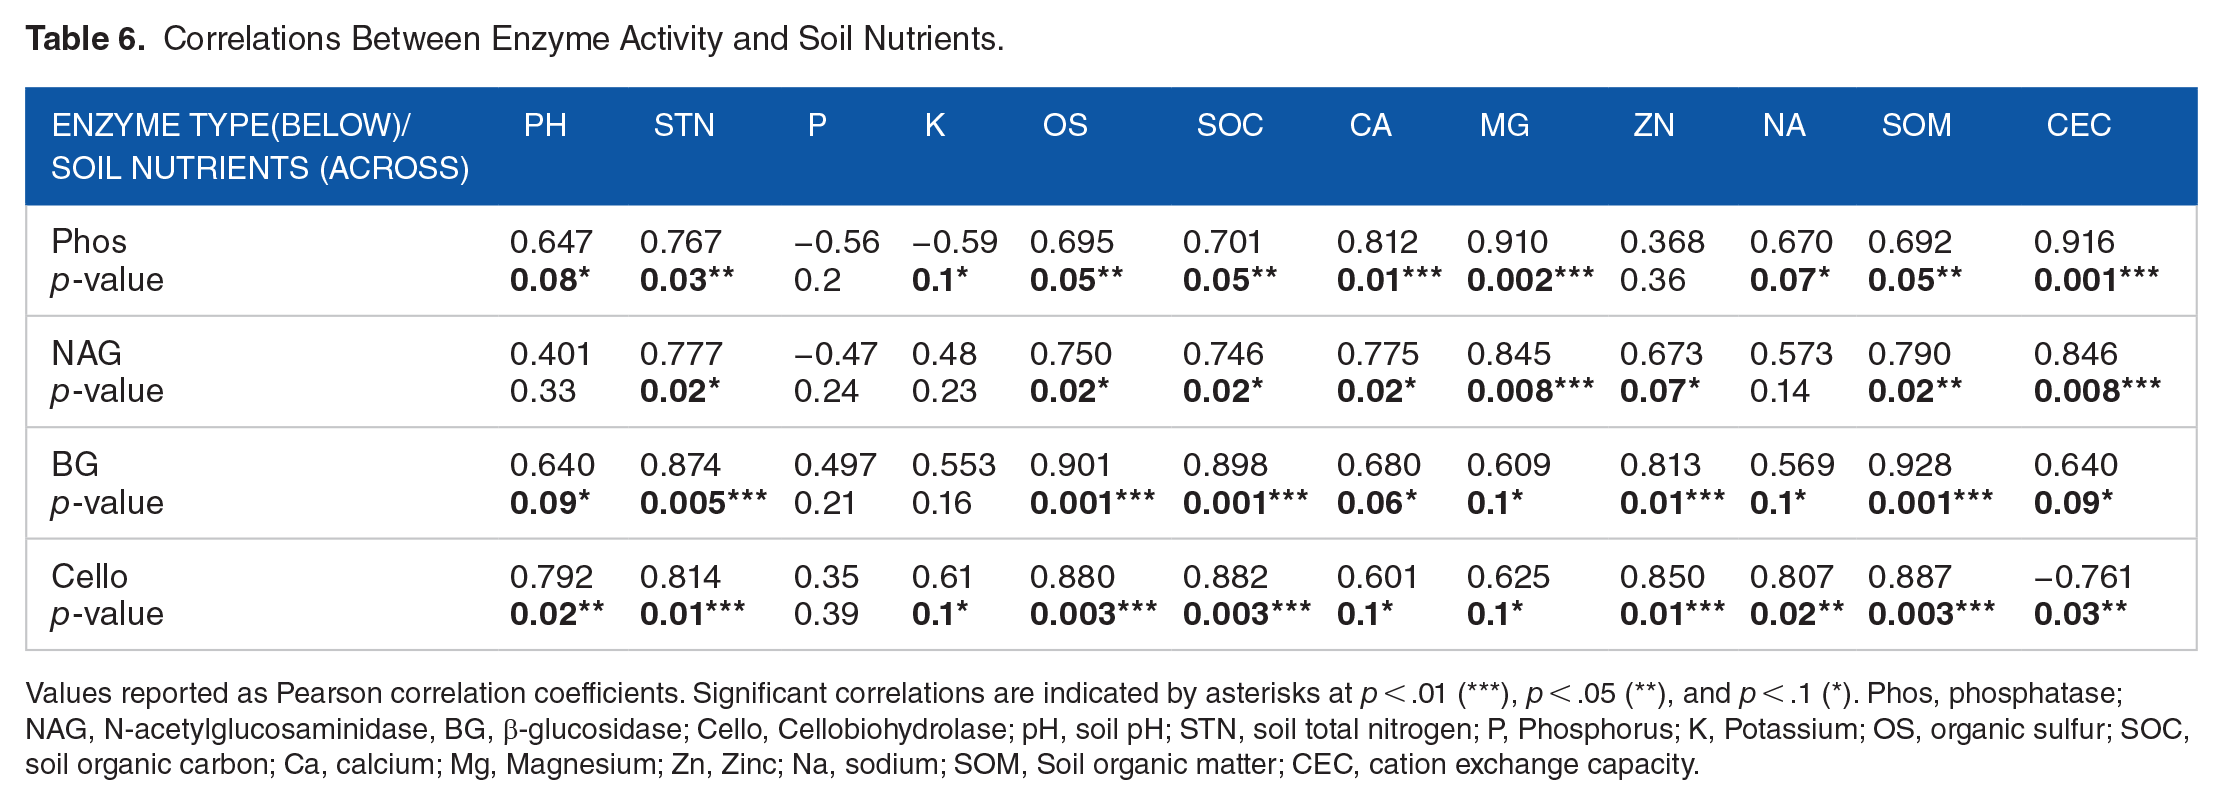
Values reported as Pearson correlation coefficients. Significant correlations are indicated by asterisks at p < .01 (***), p < .05 (**), and p < .1 (*). Phos, phosphatase; NAG, N-acetylglucosaminidase, BG, β-glucosidase; Cello, Cellobiohydrolase; pH, soil pH; STN, soil total nitrogen; P, Phosphorus; K, Potassium; OS, organic sulfur; SOC, soil organic carbon; Ca, calcium; Mg, Magnesium; Zn, Zinc; Na, sodium; SOM, Soil organic matter; CEC, cation exchange capacity.
Soybean yields
There were no significant differences in soybean yields from 2019 to 2022, following 10 years of continuous corn production. The CT yields ranged from 4,808 to 6,085 Kg ha-1, while NT ranged from 4,753 to 6,371 Kg ha-1 (Anapalli et al., 2024). The NT practice did not negatively affect ultimate soybean yields, despite limited furrow reconstruction, maintenance, and land preparation for efficient furrow water delivery compared to CT, which had 15 more land preparation operations. This can be attributed to the higher stored soil moisture content observed under NT compared to CT during the 4 years, more so in the fourth year. The NT practice also increased the soil’s STN, SOM, OS, Mg, Ca, and cation exchange capacity. The higher land preparation field passes compacted the CT soil, hence the lower recorded stored soil water compared to NT.
The comparable LMD CT practice yields to NT witnessed in this study can be attributed to the reduced soil disturbance, plowing depth, and number of land preparation operations compared to the traditional and more intensive conventional tillage practice. The LMD CT, which technically is reduced tillage has been reported to preserve the soil’s physicochemical and health attributes without adversely affecting productivity while controlling weeds (Blanco-Canqui & Ruis, 2018). In a similar study stretching over 20 years, no significant differences in corn yields between reduced till, and NT practices were detected under a humid continental climate (Kapusta et al., 1996). A gradual reduction in tillage operations might be an appealing pathway toward fully adopting no-till (NT) practices.
At the inception of the current study, the site had been under corn production for ten years before switching to soybean. The CT practice had higher yields in nine out of the reported ten years than the NT practice due to available nitrogen deficiency under NT (Anapalli et al., 2018). The introduction of soybean, which fixes nitrogen, facilitated the manifestation of ecosystem services and functional potential benefits in response to NT practice, highlighting the importance of corn-soybean rotation in plots under NT practice.
Conclusion
The NT practice in the LMD region is a viable potential alternative practice that mitigates the adverse effects of CT as was exhibited in this study. The NT increased STN, SOM, OS, magnesium, calcium, cation exchange capacity, and stored soil water compared to the LMD region CT. However, by further, reducing the number of field preparation operations under the LMD region CT standard practice can hypothetically minimize nutrient losses observed in this study by reducing soil disturbance more and shifting toward absolute NT practice, the ideal tillage practice without compromising furrow maintenance and yields. Strategic tillage (occasional) intervention operations, performed as needed, will be essential in managing herbicide-resistant weeds, nutrient stratification, and sustainable productivity without adversely compromising soil ecosystem services and function under the desirable long-term NT conservation practice. Conservation practices that include corn-soybean short-term rotations may alleviate nitrogen deficiency after continuous corn production under NT practice, which was observed before switching to a soybean crop. Further research in determining optimum furrow maintenance and land preparation field passes that will sustain viable irrigation water delivery and use efficiency, coupled with nutrient use efficiency characterization, will further bridge the divide between LMD CT practice and benchmark NT, incentivizing a shift toward absolute NT practice adoption in the LMD region.
Footnotes
Abbreviations
TT, traditional tillage; CT, conventional till; NT, no-till; STN, soil total nitrogen; P, phosphorus; K, potassium; OS, organic sulfur; SOM, soil organic matter; SOC, soil organic carbon; CEC, cation exchange capacity; WSAS, wet soil aggregate stability; SPR, soil penetration resistance; USA, United States of America.
Declaration of conflicting interests
The author(s) declared no potential conflicts of interest with respect to the research, authorship, and/or publication of this article.
Funding
The author(s) received no financial support for the research, authorship, and/or publication of this article.