
Abstract
Background:
Triple-negative breast cancer (TNBC) is a subtype of breast cancer characterized by poor prognosis due to the absence of effective targeted therapies. Emerging evidence indicates that the gut microbiota and its metabolites play a key role in the occurrence and development of TNBC. This study aimed to explore the metabolic changes and potential mechanisms associated with TNBC.
Objectives:
This study aimed to explore the potential relationship between targeted metabolites and the gut microbiota in TNBC.
Design:
We recruited 8 participants, including 4 with TNBC and 4 with benign fibroadenomas as controls.
Methods:
The gut microbiota was analyzed using metagenomics on fecal samples. Liquid chromatography–mass spectrometry (LC-MS) was employed to identify differential metabolites in serum and fecal samples. The correlation between the gut microbiota and metabolites was analyzed using Spearman’s correlation analysis.
Results:
Analysis of altered serum metabolites in the TNBC group revealed changes, particularly in carboxylic acids and derivatives, benzene, and substituted derivatives. Kyoto Encyclopedia of Genes and Genomes (KEGG) metabolic pathway analysis revealed significant enrichment in 18 pathways. Regarding fecal metabolites, differences between the 2 groups also included carboxylic acids and derivatives, benzene, and substituted derivatives, with 28 metabolic pathways enriched based on KEGG pathway analysis. Metagenomics analysis showed differences in the relative abundance of Anaerococcus, Fischerella, and Schizosaccharomyces at the genus level, which have been previously associated with breast cancer. Furthermore, 4 serum metabolites—L-glutamine, citrate, creatinine, and creatine—along with 9 fecal metabolites, were associated with the aforementioned microbiota.
Conclusion:
Our findings highlight distinct metabolite profiles in the serum and feces of patients with TNBC. The identification of gut microbiota and their associated metabolites provides new insights into the pathophysiological mechanisms underlying TNBC.
Introduction
Breast cancer (BC) is the most common cancer among women and has become an increasing global health challenge. 1 BC is a highly heterogeneous disease, comprising 4 main subtypes: luminal A, luminal B, human epidermal growth factor receptor 2 (HER2)-positive, and triple-negative breast cancer (TNBC). TNBC is characterized by the absence of estrogen receptors (ER), progesterone receptors (PR), and HER2. It accounts for 15% of all BC cases and is associated with a poor prognosis due to its high metastatic potential and the lack of effective targeted therapies. Therefore, there is an urgent need to elucidate the complex pathogenesis of TNBC to identify new therapeutic targets.
Metabolic reprogramming is recognized as a critical hallmark of cancer, actively contributing to cancer development. It enables cancer cells to acquire essential nutrients necessary for survival and rapid proliferation, even in nutrient-deprived environments. The changes in intracellular and extracellular metabolites that accompany cancer-associated metabolic reprogramming have profound implications for gene expression, cell differentiation, and the tumor microenvironment. 2 Xiao et al 3 profiled the polar metabolome and lipidome in 330 TNBC samples and 149 paired normal breast tissues, constructing a comprehensive metabolomic atlas of TNBC. TNBC is more dependent on glycolysis than other BC, as it upregulates several key glycolytic enzymes and transporters that sustain cancer cell metabolism. 4 The high expression of lactate dehydrogenase (LDH), a key enzyme in glycolysis, is closely associated with the poor prognosis of TNBC.5,6 Additionally, low levels of glutamine and high levels of glutamate, supporting enhanced glutaminolysis in TNBC, provide cancer cells with synthesis and metabolic energy. 7 Cancer cells may also use fatty acid oxidation (FAO) as an alternative energy source. 8 Consequently, metabolomics has emerged as a powerful tool for elucidating the pathogenesis and identifying therapeutic targets in BC. Nonetheless, relevant studies remain relatively rare in the context of TNBC.
The metabolic capacity of the human body is primarily influenced by the gut microbiota and its interactions with host cells. 9 The gut microbiome, an emerging field of research, has been implicated in cancer through direct and indirect involvement in multiple biological processes, including host cell proliferation and death, immune system function, oncogenic signaling, and hormone pathways. 10 Some researchers have proposed a potential gut-mammary axis that continuously influences the breast microenvironment via the gut microbiota through the transportation of dendritic cells. 11 Estrogen is one of the most important factors in BC. Notably, the gut microbiota can modulate systemic estrogens, with its dysregulation being associated with increased BC risk. 12 A study revealed that β-glucuronidase, secreted by the gut bacteria, can modulate the hormone estrogen via the enterohepatic pathway, thereby prolonging its retention in the body and potentially increasing the risk of BC. 13 However, few studies have investigated the potential associations between the gut microbiota, metabolites, and TNBC.
In this study, we used metagenomic sequencing for gut microbiome analysis and liquid chromatography–mass spectrometry (LC-MS) for metabolomic analysis. Additionally, we employed a multiomics approach, integrating these methods for a more comprehensive analysis aimed at identifying potential targeted metabolites and their associated gut microbiota in TNBC.
Methods
Clinical assessment
Clinical data were collected from the Department of Breast Surgery at the Women’s Hospital of Nanjing Medical University between 2020 and 2021. All participants were diagnosed with either benign fibroadenoma or TNBC through pathological examination at the hospital. Patients with other malignant tumors or those in the acute phase of the disease were excluded. Demographic data, including age, body mass index, and the number of medications, were also recorded. Participants did not take probiotics, antibiotics, or steroid hormones within 1 month prior to sample collection. Figure 1 provides a diagram of the study protocol.

Diagram of the study protocol.
The Institutional Review Board of the Women’s Hospital at Nanjing Medical University approved this study. All participants provided written informed consent prior to their recruitment.
Collection of blood and fecal samples
Blood samples were collected in tubes without anticoagulant on the second day of admission following an overnight fast. After allowing the samples to clot for 30 minutes, we centrifuged them at 3000 rpm for 10 minutes at 4 °C to obtain serum, which was then stored at −80 °C.
Fecal samples were freshly collected from participants within 3 days of their admission. Participants were provided with detailed instructions on the procedures for fecal sample collection. Each sample was obtained using a Commode specimen collection system (Thermo Fisher Scientific Inc., Waltham, MA, USA), immediately frozen in liquid nitrogen, and then stored at −80 °C until further processing.
Metabolomics
Metabolite extraction
We extracted 100 µL of serum by directly adding 300 μL of pre-cooled methanol and acetonitrile (2:1, v/v). To ensure the quality of sample preparation, we added internal standard mixes 1 (IS1) and 2 (IS2). Following vortexing for 1 minute and incubating at −20 °C for 2 hours, the samples were centrifuged at 4000 rpm for 20 minutes. The supernatants were then transferred to a vacuum freeze dryer for drying. The metabolites were resuspended in 150 µL of 50% methanol and centrifuged at 4000 rpm for 30 minutes. Finally, the supernatants were transferred to autosampler vials for analysis by LC-MS.
An extraction reagent (800 µL) was added directly to 25 mg of fecal samples after weighing and extraction (methanol: acetonitrile: water [2:2:1, v/v/v]). We added an internal standard mixture to the sample preparation as a quality control measure. The samples were homogenized for 5 minutes using a TissueLyser (Jingxin, Shanghai, China), followed by sonication for 10 minutes and incubation at −20 °C for 1 hour. The samples were then centrifuged at 25 000 rpm for 15 minutes at 4 °C, and the supernatant was collected for vacuum lyophilization. The metabolite suspension was resuspended in 600 µL of 10% methanol and sonicated at 4 °C for 10 minutes. Finally, the supernatants were centrifuged at 25 000 rpm for 15 minutes before being transferred to autosampler vials for LC-MS analysis.
Metabolomics analysis
The samples were analyzed using the Waters 2D Ultra-Performance Liquid Chromatography system (Waters, Milford, MA, USA) coupled with a Q-Exactive mass spectrometer (Thermo Fisher Scientific Inc., Waltham, MA, USA) equipped with a heated electrospray ionization (HESI) source. The system was controlled by Xcalibur 2.3 software (Thermo Fisher Scientific Inc., Waltham, MA, USA). We performed chromatographic separation on an ACQUITY UPLC BEH C18 column (1.7 μm, 2.1 × 100 mm2; Waters, Milford, MA, USA) with the column temperature maintained at 45 °C. The mobile phase for the positive mode consisted of 0.1% formic acid (A) and acetonitrile (B). For the negative mode, the mobile phase comprised 10 mM ammonium formate (A) and acetonitrile (B). The gradient conditions were as follows: 0 to 1 minute, 2% B; 1 to 9 minutes, 2% to 98% B; 9 to 12 minutes, 98% B; 12 to 12.1 minutes, 98% B to 2% B; and 12.1 to 15 minutes, 2% B. The flow rate was set at 0.35 mL/min, with an injection volume of 5 μL. For the mass spectrometer settings in both positive and negative ionization modes, the spray voltage was 3.8 and −3.2 kV, respectively. The sheath gas flow rate was set to 40 units (arb), and the auxiliary gas flow rate was set to 10 arb. The auxiliary gas heater temperature was maintained at 350 °C, while the capillary temperature was 320 °C. The mass spectrometer scanned a range of 70 to 1050 m/z at a resolution of 70 000. An automatic gain control (AGC) target of 3e6 was used with a maximum injection time of 100 ms for MS acquisitions. MS fragmentation was performed on the top 3 precursors, with a maximum ion implantation time of 50 ms, a resolution of 30 000, and an AGC target of 1e5. The stepped normalized collision energy was set to 20, 40, and 60 eV, respectively, for this study.
Statistical analysis
The raw LC-MS data were imported into the Compound Discoverer 3.1 software (Thermo Fisher Scientific Inc., Waltham, MA, USA). Data processing was performed using the metabolomics R package metaX 14 and the metabolome bioinformatics analysis pipeline. Multivariate raw data were dimensionally reduced using partial least squares-discriminant analysis (PLS-DA) to explore the potential relationships between metabolites and sample groups. Univariate analysis was performed by combining the Wilcoxon test and Student’s t-test to identify significantly differential metabolites, followed by correction using the false discovery rate (FDR) to ensure reliable detection. Variable importance in projection (VIP) scores were used to assess different metabolites at a threshold of 1, as determined by the 7-fold cross-validation of PLS-DA. Metabolites were considered different when the P-value was < .05, q-value was < .05, fold-change was < 0.8 or > 1.2, and VIP score was > 1, based on the combined PLS-DA and univariate analyses.
Pathway analysis
The Kyoto Encyclopedia of Genes and Genomes (KEGG) database was used to annotate the identified metabolites, elucidate their functional characteristics, and determine the primary biochemical metabolic pathways and signal transduction pathways involved. Metabolic pathways with a P-value < .05 were considered enriched by different metabolites.
Metagenomics
DNA extraction, library preparation, and sequencing
DNA was extracted using the Qiagen MagAttract PowerSoil DNA KF kit (Thermo Fisher Scientific Inc., Dusseldorf, Germany) with a KingFisher robot (Thermo Fisher Scientific Inc., Waltham, MA, USA) at Microbiome Insights. DNA quality was assessed via gel electrophoresis and quantified using a Qubit 3.0 fluorometer (Thermo Fisher Scientific Inc., Waltham, MA, USA). Approximately 300 ng of genomic DNA was used for library construction following the MGIEasy FS Library Prep Kit protocol (MGI Tech, Shenzhen, China). Shotgun genome sequencing was performed using paired-end (150 bp) sequencing on the MGISEQ-2000RS platform (MGI Tech, Shenzhen, China) in accordance with the manufacturer’s instructions.
Gut microbiota diversity
We calculated alpha diversity using the Shannon, Chao1, and Simpson indices to assess and summarize taxonomic diversity in terms of richness and evenness. Beta-diversity was measured based on the differences between groups, typically assessed by calculating the Jensen–Shannon divergence (JSD) distance from the abundance matrix.
Data analysis
Data processing was conducted using R software (v. 3.4.1). Wilcoxon and Kruskal–Wallis tests were performed using R to assess the significance of pairwise comparisons, with an adjusted P-value ⩽ .05. Linear discriminant analysis (LDA) coupled with effect size (LEfSe) was applied to evaluate differentially abundant taxa.
Microbiota–metabolome correlation analysis
We used Spearman’s correlation analysis in R software (v. 3.4.1) to analyze the correlation between metabolites and microbiota. Correlations were considered significant when the P-value was < .05 and |r| was > 0.5. A negative correlation was indicated if r < 0, while a positive correlation was indicated if r > 0.
Results
Clinical characteristics of participants
Notably, 8 participants were enrolled in the study, comprising 4 with benign fibroadenoma and 4 with TNBC. The clinical characteristics of the participants are detailed in Supplementary Table 1. All participants were premenopausal women aged 40 to 50 years. The 4 participants with benign fibroadenoma served as the control group. None of the 4 participants with TNBC exhibited distant metastases. However, 2 patients with TNBC underwent modified radical mastectomy, while the other 2 underwent breast-conserving surgery and sentinel lymph node biopsy. No statistically significant differences were observed in age or BMI between the 2 groups.
Altered serum metabolites in patients with TNBC
The metabolomics analysis identified 664 metabolites in the negative ion mode and 198 in the positive ion mode. On comparing patients with TNBC with the controls, we observed significant between-group differences in metabolomic profiles, as revealed by PLS-DA (Figure 2A). In the TNBC group, the relative concentrations of 34 metabolites decreased, while those of 32 metabolites increased (Supplementary Table 2). The differential metabolites, categorized by class, indicated that the shifts in the TNBC group were primarily associated with carboxylic acids and derivatives, and benzene and substituted derivatives (Figure 2B). In particular, metabolite levels of a class of carboxylic acids and derivatives were significantly lower in the serum of patients with TNBC (Supplementary Table 2). KEGG metabolic pathway analysis revealed a significant enrichment of 18 pathways, such as alanine, aspartate, and glutamate metabolism; glyoxylate and dicarboxylate metabolism; 2-oxocarboxylic acid metabolism; and arginine and proline metabolism (Figure 2C; Supplementary Table 3). Key metabolites in these pathways included citrate, creatine, and L-glutamine. Figure 2D illustrates the relative concentrations of representative metabolites with class and pathway information, such as citrate, creatine, creatinine, and L-glutamine. These results demonstrate distinct serum metabolic profile characteristics between the TNBC and control groups.
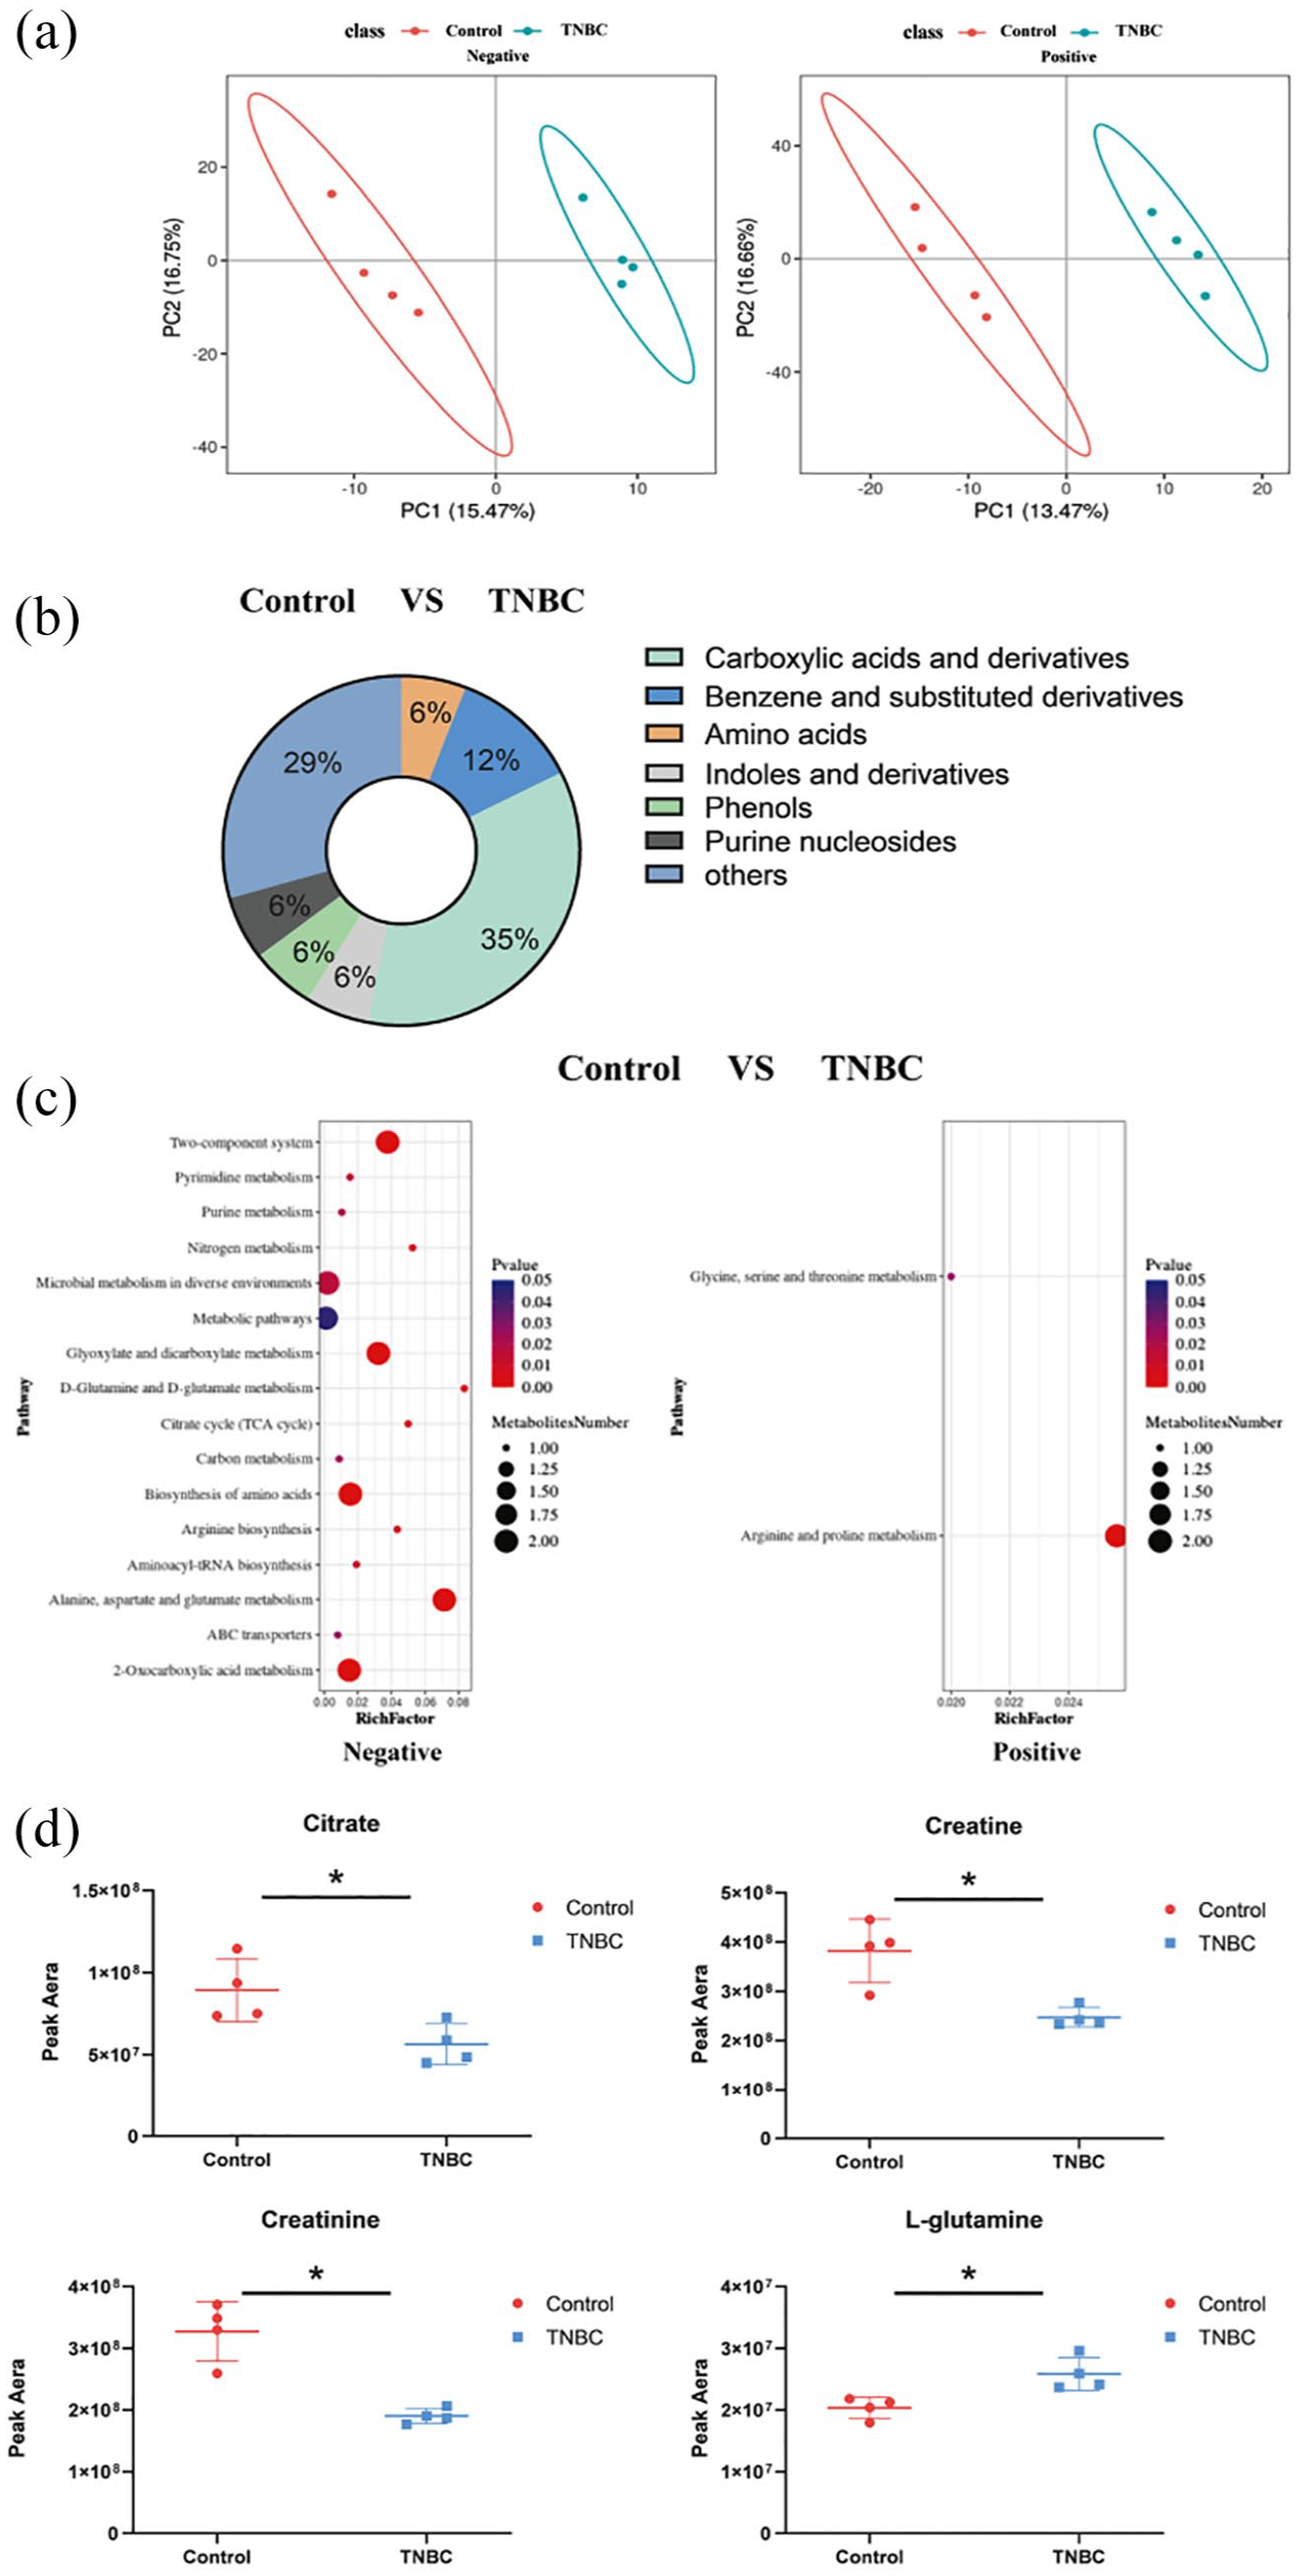
Altered serum metabolites in TNBC patients. (A) PLS-DA analysis of the difference between classification groups in positive (pos) and negative (neg) ion modes. (B) Pie graph of the class composition according to the number of altered metabolites. (C) Bubble chart of the pathway enrichment analysis of differential metabolites analyzed in the negative and positive ion modes. Rich Factor was the number of differential metabolites divided by the identified metabolites associated with the pathway. (D) Relative abundance of metabolites. Peak area: relative concentrations of metabolites.
Altered fecal metabolites in patients with TNBC
A total of 1068 metabolites in negative ion mode and 3072 metabolites in positive ion mode were identified. PLS-DA clearly distinguished between the TNBC and control groups (Figure 3A). Compared with the control group, the relative concentrations of 233 metabolites were lower, while 439 metabolites were higher in the feces of patients with TNBC (Supplementary Table 4). Differential fecal metabolites between the 2 groups were identified, including carboxylic acids and derivatives, benzene, and substituted derivatives, based on class information (Figure 3B). Furthermore, 28 metabolic pathways were enriched by differential metabolites, as determined by KEGG pathway analysis, including neuroactive ligand–receptor interaction, glyoxylate and dicarboxylate metabolism, and dopaminergic synapse (Figure 3C; Supplementary Table 5). Similarly, the relative concentrations of representative metabolites, such as 2ʹ-deoxyinosine, 2-deoxyguanosine, adenosine, calcitriol, desmosterol, and thymidine, along with their class and pathway information, are presented in Figure 3D.
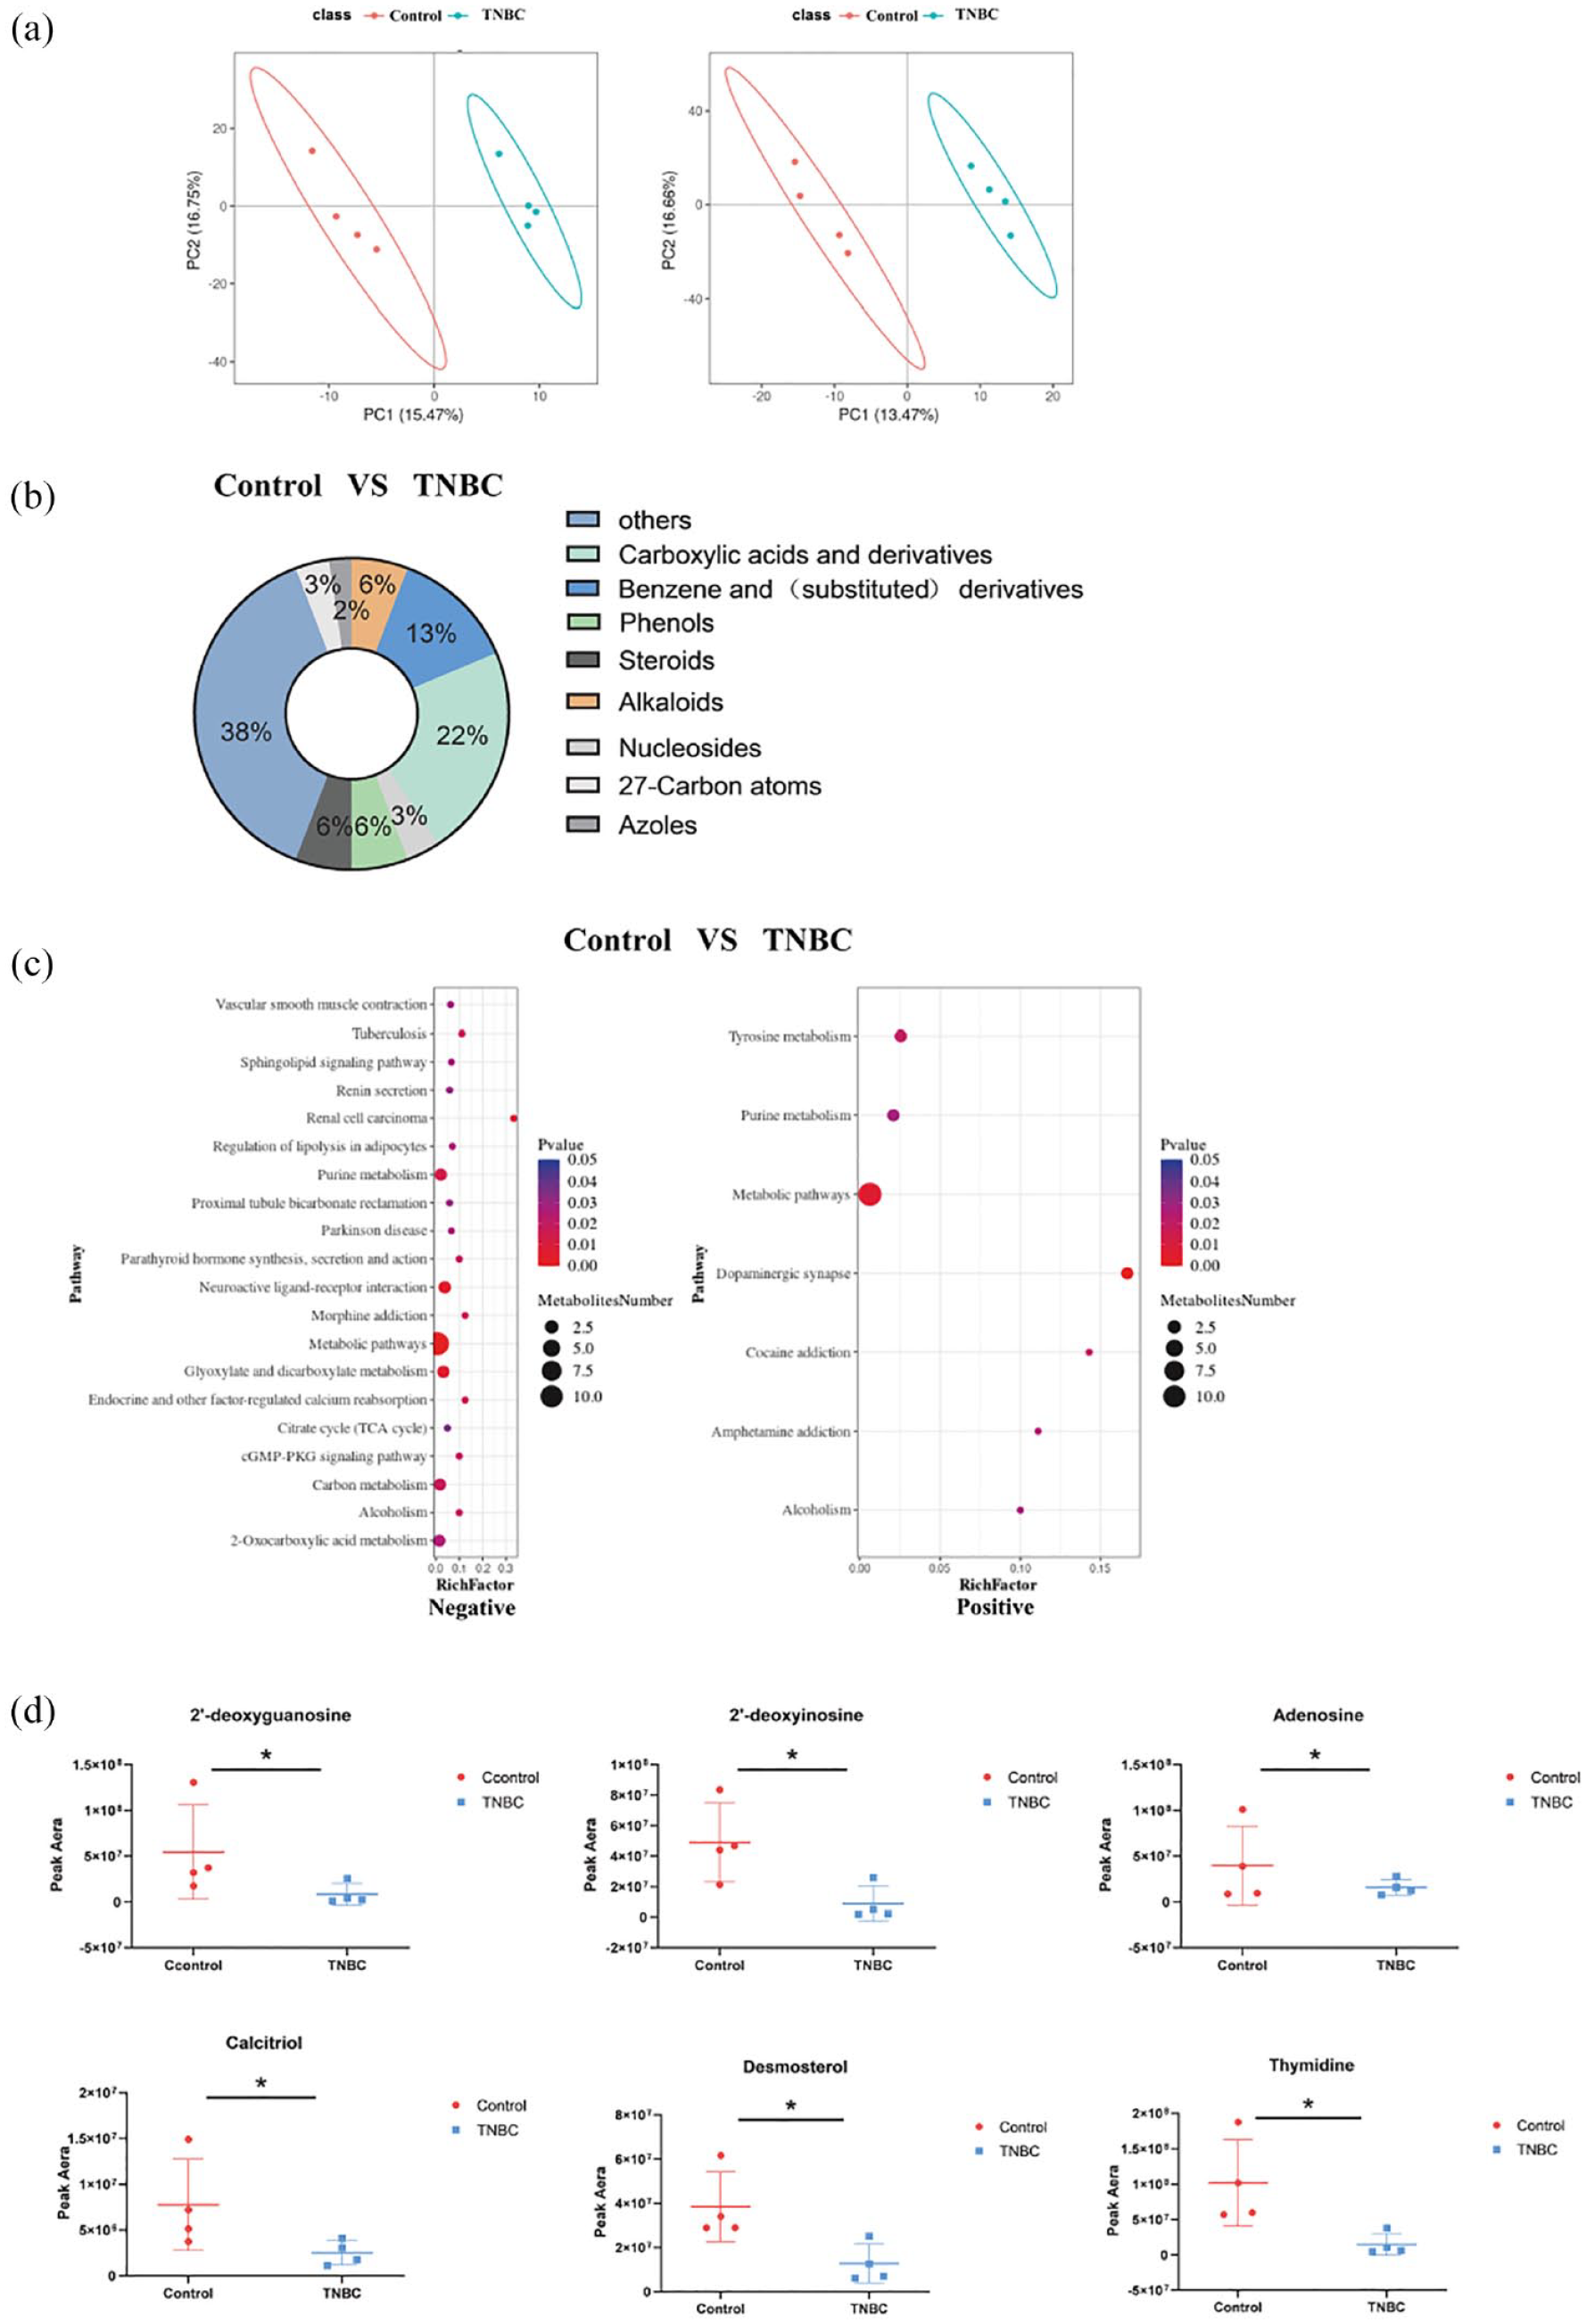
Altered fecal metabolites in TNBC patients. (A) PLS-DA analysis of the difference between classification groups in positive (pos) and negative (neg) ion modes. (B) Pie graph of the class composition according to the number of altered metabolites. (C) Bubble chart of the pathway enrichment analysis of differential metabolites analyzed in the negative and positive ion modes. Rich Factor is the number of differential metabolites divided by the identified metabolites associated with the pathway. (D) The relative abundance of the metabolites linked with the serum metabolites is shown in Figure 2D. Peak area: relative concentrations of metabolites.
Analysis of the gut microbiome in patients with TNBC
Previous studies have indicated that blood metabolites detected in the human body are influenced by the microbiota, 15 with approximately 58% originating from the microbiota. 16 Investigating gut microbiome characteristics can provide insights into the potential mechanisms underlying altered serum and fecal metabolites in patients with TNBC. Therefore, we conducted a metagenomic analysis of fecal samples from these patients to identify gut microbiota. A total of 353 599 genes were co-expressed in the 2 groups, as revealed by a Venn diagram, whereas the remaining genes were differentially expressed (Figure 4A). Notably, the gene count in the control group was significantly higher than in the TNBC group, suggesting fewer microbial species in the TNBC group.

Analysis of the gut microbiome in patients with TNBC. (A) Venn diagram showing the number of overlapping genes. (B) Beta-diversity analysis based on the JSD distance calculated from the abundance matrix. (C) Species diversity differences were assessed using the Chao1, Simpson, and Shannon indices. (D) Distribution of gut microbiota diversity at the phylum and genus levels.
We calculated alpha- and beta-diversities to investigate differences in species profiles. Statistical differences in the quantity and distribution of communities between the control and TNBC groups were assessed using the JSD distance from the ambiguity matrix (Figure 4B). In contrast, the Chao1, Simpson, and Shannon indices showed no significant differences between the samples (Figure 4C).
To explore the characteristics of the gut microbiota in patients with TNBC, we analyzed the microbial composition in 2 groups at both the phylum and genus levels (Figure 4D). Bacteroidetes and Firmicutes were the dominant phyla in both groups, with no statistical differences observed between the 2 groups. At the genus level, a total of 25 bacterial taxa exhibited differences between the 2 groups (Supplementary Table 7). Among these, Anaerococcus, Fischerella, and Schizosaccharomyces have been previously associated with BC.17 -19 In our study, the relative abundance of Anaerococcus was higher in the TNBC group, while Fischerella and Schizosaccharomyces were less abundant compared with the control group.
Moreover, we employed LEfSe to generate a cladogram, identifying specific bacteria associated with patients with TNBC (Figure 5). In total, 65 microflora displayed different relative abundances between the TNBC and control groups (LDA score > 2.0; P < .05). Notably, potentially harmful bacteria, such as Candidatus Nitrososphaera evergladensis and Bacteria, were significantly overexpressed in the feces of patients with TNBC (all LDA scores [log10] > 3), whereas Lysobacter sp. HDW10, Mesorhizobium sp. M7D.F.Ca.US.005.01.1.1, and Natronococcus were the most abundant in the control group (all LDA scores [log10] > 2.6). Overall, these results reveal an altered gut microbiome composition in patients with TNBC.

LDA integrated with effect size (LEfSe). Left: the phylogenetic distribution of microbiota in cladogram. Right: the differences in abundance of microbiota.
Correlations between serum/fecal metabolites and the gut microbiota
To investigate the potential correlation between the gut microbiota and serum or fecal metabolites, we conducted an intergroup correlation analysis between the microbiota at the genus level and serum or fecal metabolites. We focused on Anaerococcus, Fischerella, and Schizosaccharomyces, which have been previously reported to be associated with BC. We found that 4 serum metabolites—L-glutamine, citrate, creatinine, and creatine—were associated with the aforementioned microbiota (Figure 6A). L-glutamine was negatively correlated with the abundant genera Fischerella and Schizosaccharomyces, while citrate, creatinine, and creatine were positively associated with the genus Fischerella. In addition, creatine was positively correlated with the genus Schizosaccharomyces. Moreover, 9 fecal metabolites were found to be correlated with the microbiota (Figure 6B). Among these, N~6~-(5-oxo-d-isoleucyl)-L-lysine was negatively correlated with Anaerococcus, Fischerella, and Schizosaccharomyces, whereas desmosterol was positively correlated with all 3 genera. These results suggest potential relationships between serum/fecal metabolites and the gut microbiota. In addition, correlations between serum and fecal metabolites were also analyzed (Figure 6C). Decreased serum citrate, creatinine, and creatine levels were positively correlated with fecal metabolites, such as 2ʹ-deoxyinosine, 2-deoxyguanosine, adenosine, calcitriol, desmosterol, and thymidine. These findings indicate that alterations in metabolite profiles and metabolic disorders in patients with TNBC may be associated with the gut microbiota.

Correlation between serum/fecal metabolites and gut microbiota. (A) Spearman’s correlation coefficient between gut microbiota and serum metabolites. (B) Spearman’s correlation coefficient between gut microbiota and fecal metabolites. (C) Spearman’s correlation coefficient between the serum and fecal metabolites.
Discussion
The reprogramming of cell metabolism has become a crucial area of research in cancer studies and has garnered considerable interest in understanding the processes underlying cancer cell growth, invasion, and metastasis. It is generally acknowledged that cancer cells use metabolic pathways in atypical ways to sustain their rapid proliferation.20,21 Thus, altered metabolites are indicative of potential cancer progression. In this study, the composition of metabolite categories and the pie chart of metabolite concentrations reveal increased ratios of energy-related metabolites, such as those involved in amino acid and creatine metabolism, suggesting a distinct metabolic adaptation to meet the energy demands during cancer development.
Moreover, we observed notable changes in serum metabolites, including citrate, creatine, creatinine, and L-glutamine in TNBC. As previously noted, L-glutamine, a non-essential amino acid, supports the energy requirements of cancer cells. 22 Therefore, elevated serum levels of L-glutamine observed in our study may therefore reflect the altered amino acid metabolism characteristic of TNBC. In addition, citrate is a key substrate in energy metabolism for normal cells, while creatine serves as a primary energy source for adenosine triphosphate (ATP) production in muscles to meet the energy demands. 23 Creatine has also been reported to enhance the therapeutic efficacy of HER2-positive BC. 24 Hence, the reduced levels of these 2 serum metabolites in TNBC may suggest the cancer cells’ impaired ability to use conventional energy metabolism pathways, compelling them to seek alternative, more efficient mechanisms to sustain their uncontrolled growth.
Furthermore, we focused on thymidine in fecal metabolites and found that it is positively correlated with serum citrate, creatine, and creatinine. A previous study reported that thymidine phosphorylase could mediate the metabolism of thymidine to supply carbon for the glycolytic pathway, thereby supporting cancer cell survival under nutrient-deprived conditions. 25 The observed decrease in fecal thymidine suggests its decomposition in the body to serve as an energy source for cancer cells. This finding is consistent with the decrease in citrate and creatine, which are essential for providing energy to normal cells. Therefore, understanding the shift in energy supply in TNBC may provide a novel target for therapeutic intervention.
We analyzed the sources of these metabolites (https://hmdb.ca/metabolites). 2-deoxyguanosine, calcitriol, desmosterol, and thymidine are exogenous metabolites, while citrate is an endogenous metabolite. Creatine, creatinine, L-glutamine, and adenosine are of both endogenous and exogenous origin. Notably, the differential metabolites in feces are primarily exogenous, whereas those in blood originate from both sources.
To explore the mechanisms underlying the distinct metabolomic profiles observed in TNBC, we hypothesized the involvement of the gut microbiome, referring to this interaction as the gut–mammary axis. No integrated studies have explored the relationship between serum and fecal metabolomics, and the gut microbiome in TNBC. Our correlation analysis revealed that Fischerella not only showed a positive correlation with the serum metabolites citrate, creatine, and creatinine but was also positively associated with the fecal metabolite thymidine. A study indicated that Fischerella ambigua can produce ambiguine I isonitrile, a potent nuclear factor kappa B (NF-κB) inhibitor, which induces apoptosis in MCF-7 cells. 18 Moreover, Habib et al 19 found that Schizosaccharomyces pombe contains pre-mRNA processing factor 4 kinase (PRP4K), where partial loss of this kinase increases taxane resistance in several malignancies, including cervical, breast, and ovarian cancers. Notably, Anaerococcus, which is significantly enriched in patients with TNBC, exhibited a negative correlation with metabolites that are more abundant in TNBC, such as L-glutamine and N-6-(5-oxo-d-isoleucyl)-L-lysine. This unusual phenomenon may reflect the unique influence of the TNBC-specific tumor microenvironment on the composition of the gut microbiota. As a crucial energy source and biosynthetic precursor, L-glutamine is highly demanded by rapidly proliferating tumor cells, and its elevated serum levels may reflect the high metabolic activity of TNBC. The negative correlation between Anaerococcus and L-glutamine suggests that these bacteria may have their utilization of glutamine inhibited in the TNBC environment or that they may regulate the metabolic pathway of glutamine through specific mechanisms. Meanwhile, the precise role of N-6-(5-oxo-d-isoleucyl)-L-lysine remains unclear.
The discovery of the gut microbiota and their associated metabolites provides a novel perspective for studying the pathophysiological mechanisms of TNBC. While our bioinformatics analysis revealed a positive correlation between certain bacteria and metabolites, we have not found any relevant published literature reporting that these bacteria can produce the related metabolites. Further research is required.
Limitations
Indeed, our research has certain limitations, including the relatively small size of the control group and the exclusive focus on the relationship between metabolites and gut microbiota in patients with TNBC.
Conclusion
More than half of the risk factors for BC remain unidentified, highlighting the need to continue searching for new risk factors. Our findings highlight distinct metabolite profiles in the serum and feces of patients with TNBC. However, we were unable to establish a strong link owing to the limited sample size, and the mechanisms underlying these metabolic changes remain unclear. In conclusion, the correlation between the gut microbiota and serum/fecal metabolites suggests that TNBC may be a metabolic disorder. This finding provides a foundation for further research into the disease pathogenesis.
Supplemental Material
sj-docx-1-bcb-10.1177_11782234241285645 – Supplemental material for Serum and Fecal Metabolite Profiles Linking With Gut Microbiome in Triple-Negative Breast Cancer Patients
Supplemental material, sj-docx-1-bcb-10.1177_11782234241285645 for Serum and Fecal Metabolite Profiles Linking With Gut Microbiome in Triple-Negative Breast Cancer Patients by Jiawei Liu, Jing Shi, Tingting Zhang, Mie Chen, Zhennan Li, Cheng Lu and Fengliang Wang in Breast Cancer: Basic and Clinical Research
Supplemental Material
sj-xlsx-2-bcb-10.1177_11782234241285645 – Supplemental material for Serum and Fecal Metabolite Profiles Linking With Gut Microbiome in Triple-Negative Breast Cancer Patients
Supplemental material, sj-xlsx-2-bcb-10.1177_11782234241285645 for Serum and Fecal Metabolite Profiles Linking With Gut Microbiome in Triple-Negative Breast Cancer Patients by Jiawei Liu, Jing Shi, Tingting Zhang, Mie Chen, Zhennan Li, Cheng Lu and Fengliang Wang in Breast Cancer: Basic and Clinical Research
Footnotes
References
Supplementary Material
Please find the following supplemental material available below.
For Open Access articles published under a Creative Commons License, all supplemental material carries the same license as the article it is associated with.
For non-Open Access articles published, all supplemental material carries a non-exclusive license, and permission requests for re-use of supplemental material or any part of supplemental material shall be sent directly to the copyright owner as specified in the copyright notice associated with the article.